どうも、Beyond the Pixelです。MRガイド下集束超音波治療(MRgFUS)は、切開せずに脳深部の病変を熱で焼灼できる画期的な技術であり、機能的神経外科分野において確立された治療法となっています。特に、本態性振戦やパーキンソン病といった疾患に対する治療で注目されています。しかし、この治療の効率は、頭蓋骨を通過する際に超音波が減衰することに大きく影響されます。従来、治療の適格性を判断する主要なパラメーターは、頭蓋骨密度比(SDR)でした。これは、頭蓋骨の皮質骨と海綿骨の密度の比率を示す指標です。しかし、SDRは頭蓋骨に関連する熱応答の変動を部分的にしか説明できず、治療中のエネルギー調整に対するガイダンスも限られていました。SDRが低い場合(0.4未満)は超音波の減衰が大きく、効率が低いとされますが、SDRが低いケースでも治療可能な場合があり、また中程度のSDRでも効率が予想外に低いケースも存在します。このため、SDRのみに頼るのでは不十分であるという課題がありました。本研究の著者らは、SDRを超える頭蓋骨関連の熱効率決定因子を包括的に特性評価し、治療効率とソニケーションごとのピーク温度を予測する多変量モデルを開発することを目的としました。これにより、対象者のスクリーニングと治療中の意思決定を支援することを目指しています。
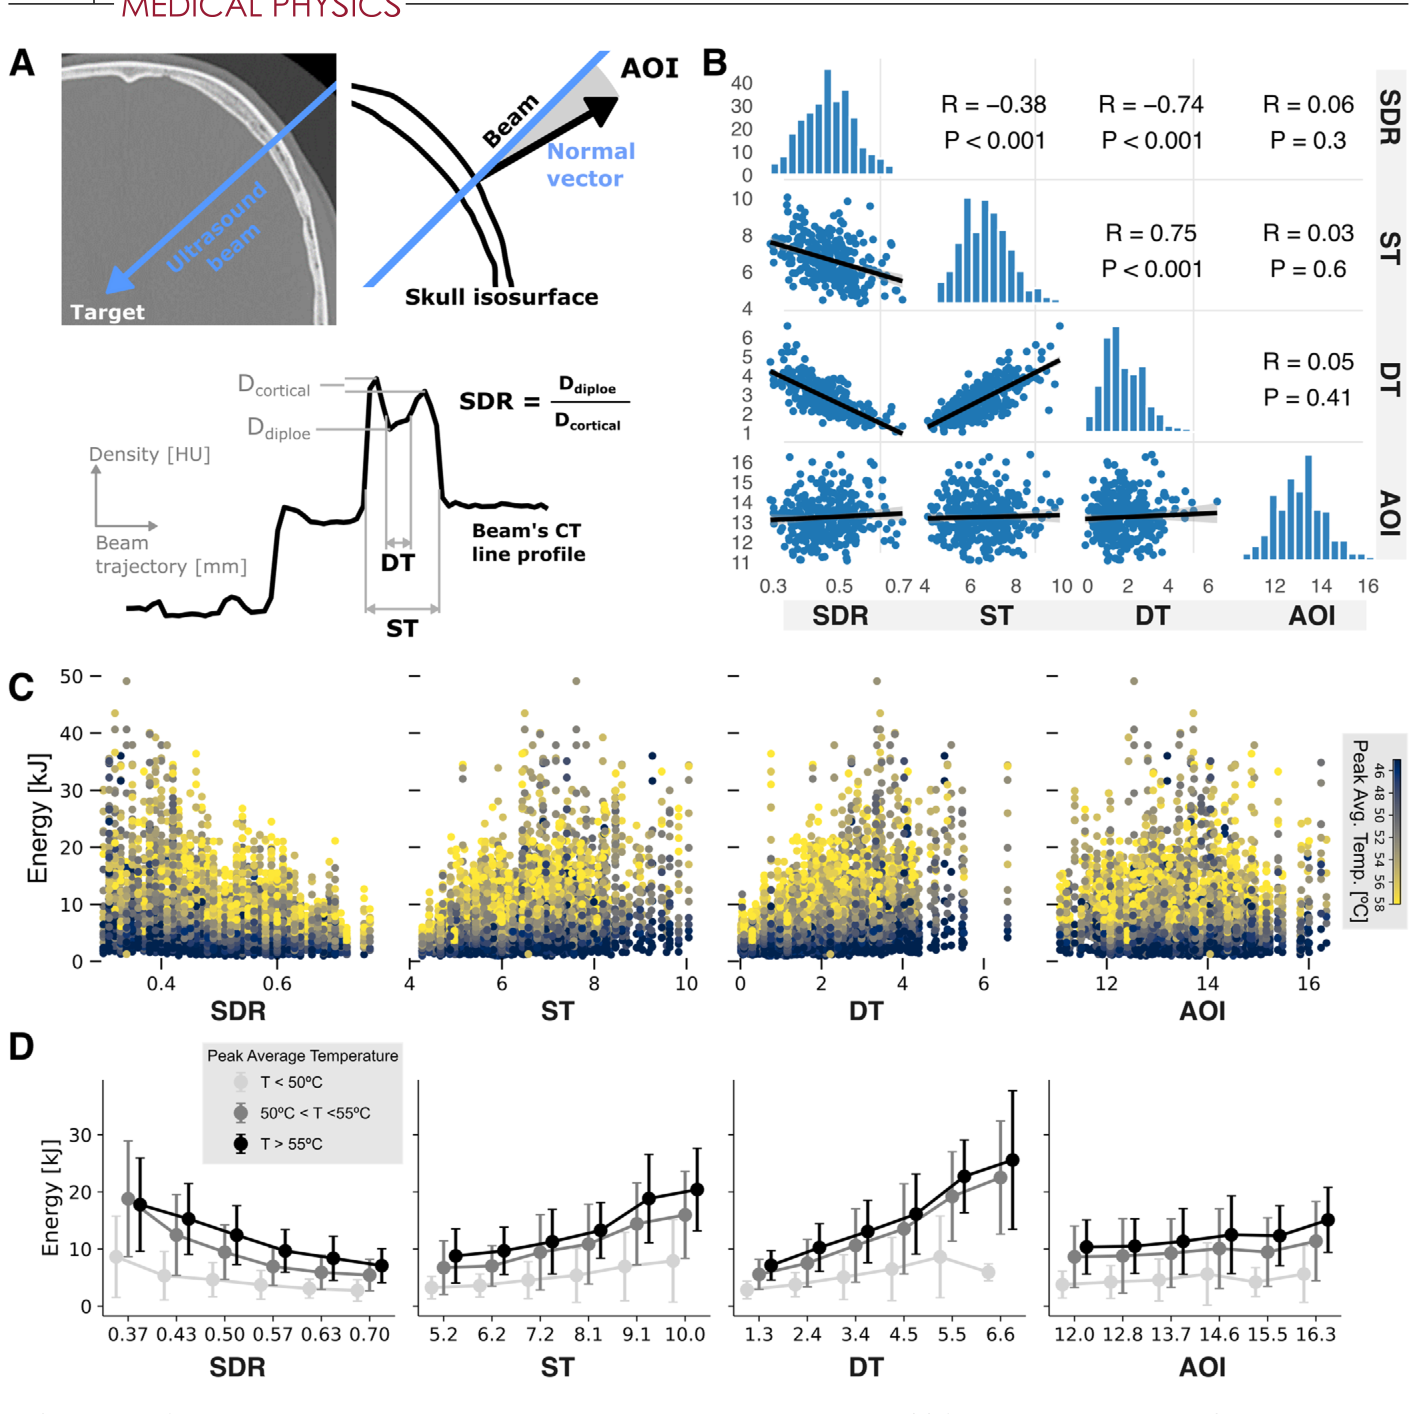
Figure 1. FIGURE 1 Skull parameters and their implications in energy-temperature relationships. (a) Schematic representation of skull metrics, including skull density ratio (SDR), skull thickness (ST), and diploe thickness (DT) derived from CT images. The angle of incidence (AOI) is illustrated as the angle between the beam trajectory and the normal vector to the skull isosurface. (b) Pairwise correlation matrix between skull average metrics, showing Pearson correlation coefficients and significance levels. (c) Scatter plots showing individual sonications, where skull metrics (SDR, ST, DT, AOI) are plotted against delivered energy, with peak average temperature achieved represented in color (gray to yellow). (d) Error-bar plots depicting the relationship between skull metrics and delivered energy. Sonications are now grouped into three thermal ranges: [<50◦C] (light gray), [50–55◦C] (dark gray), and > 55◦C (black). Average values and standard deviations are shown.解説: 頭蓋骨パラメータとエネルギー-温度関係への影響を示しています。(a) CT画像から導出された頭蓋骨密度比(SDR)、頭蓋骨厚(ST)、双板間層厚(DT)などの頭蓋骨指標の模式図。(b) 頭蓋骨平均指標間のピアソン相関係数と有意水準を示す相関行列。(c) 個々のソニケーションについて、頭蓋骨指標(SDR、ST、DT、AOI)と投入エネルギーの関係をプロットし、到達した最高平均温度を色で示しています。(d) 頭蓋骨指標と投入エネルギーの関係を示すエラーバープロットで、ソニケーションを3つの温度範囲にグループ分けしています。
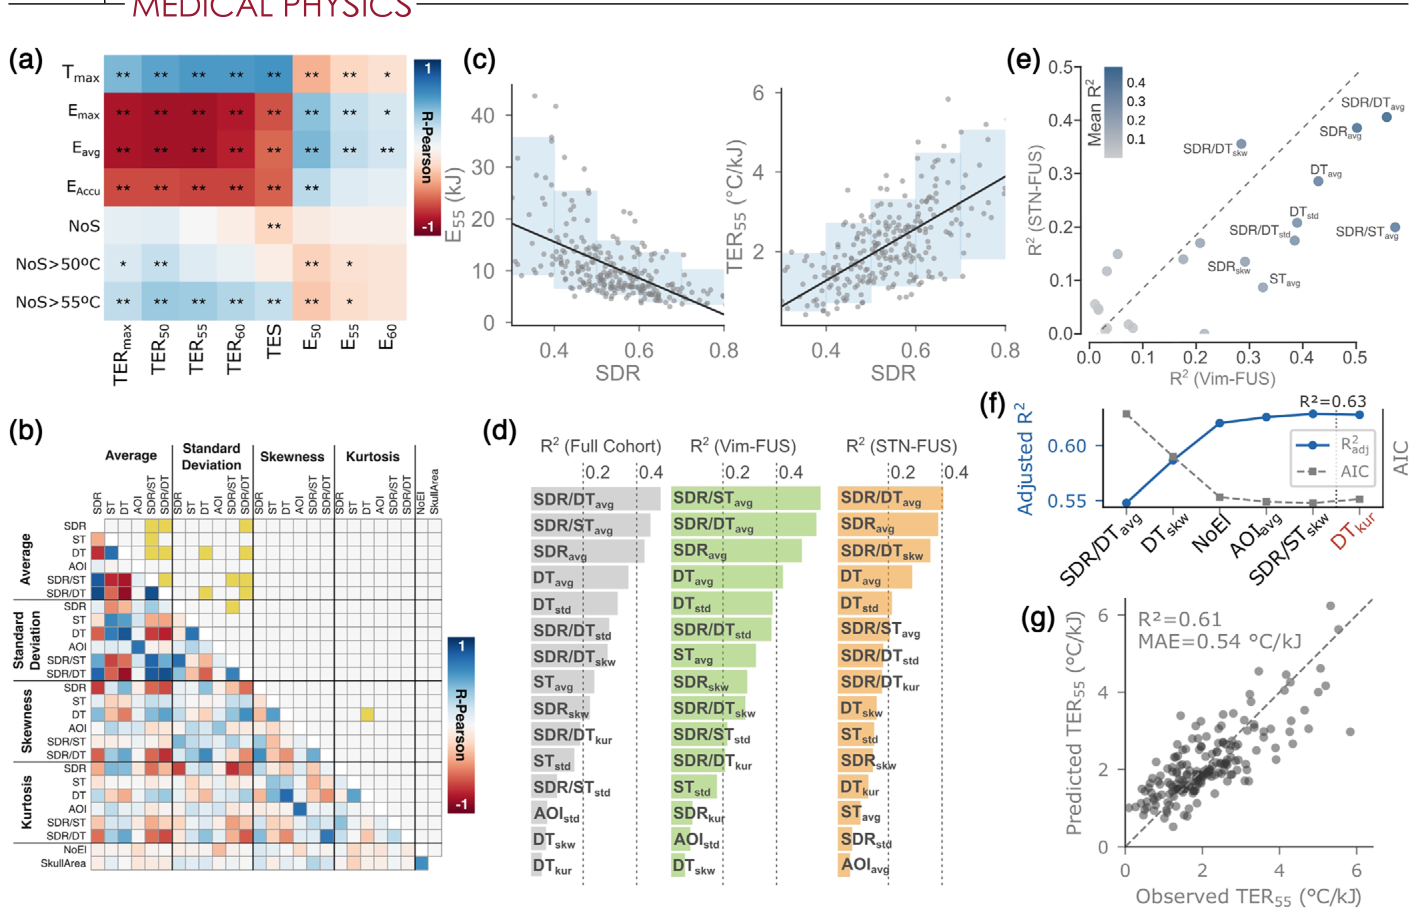
Figure 3. FIGURE 3 Temperature-energy relationships and skull-related predictors of thermal efficiency. (a) Inter-subject correlation matrix between efficiency estimators and treatment summary metrics, including maximum temperature (Tmax), maximum energy (Emax), average and accumulated energy (Eavg, Eaccu), total number of sonications (NoS), and the number of sonications exceeding 50◦C and 55◦C. Colors indicate Pearson correlation coefficients (blue: positive; red: negative), with statistical significance denoted as *P < 0.05 and **P < 0.01. (b) Correlation matrix of skull-derived metrics and their statistical estimators (mean, standard deviation, skewness, and kurtosis) for SDR, ST, DT, AOI, and the ratios SDR/ST and SDR/DT. (c) Scatterplots of SDR against E55 (left) and TER55 (right). Solid line: linear regression fit. Shaded rectangles indicate the 5th–95th percentile range within consecutive SDR bins (width = 0.10), illustrating the inter-patient variability that persists across the SDR spectrum. (d) Bar plots showing the coefficient of determination (R2) from univariate linear regressions between TER55 and individual skull parameters for the full cohort, Vim-FUS, and STN-FUS groups, respectively. Variables are ranked by decreasing explanatory power within each group. (e) Comparison of R2 values for each skull parameter between the Vim-FUS and STN-FUS groups. The dashed diagonal indicates equal explanatory power across targets, highlighting parameters with group-specific relevance. (f) Forward feature selection results for multivariable modeling of TER55, showing the evolution of adjusted R2 (left axis) and AIC (right axis) as skull-derived predictors are sequentially added. The vertical dotted line indicates the optimal model (5 features, adjusted R2 = 0.63), beyond which additional variables do not improve the AIC criterion. Variables beyond the optimal set are shown in red. (g) Scatter plot of observed versus predicted TER55 from 5-fold cross-validation (N = 178 procedures). Each point represents an out-of-fold prediction. The dashed diagonal indicates perfect agreement (identity y = x). Cross-validated R2 = 0.61, MAE = 0.54◦C/kJ.解説: 温度-エネルギー関係と熱効率の頭蓋骨関連予測因子を示しています。(a) 効率推定器と治療サマリー指標間の対象者内相関行列。(b) SDR、ST、DT、AOI、およびSDR/STとSDR/DTの比率の頭蓋骨由来指標とその統計推定器(平均、標準偏差、歪度、尖度)の相関行列。(c) SDRとE55(左)およびTER55(右)の散布図。(d) TER55と個々の頭蓋骨パラメータ間の単変量線形回帰による決定係数(R2)の棒グラフ。(e) Vim-FUSとSTN-FUSグループ間での各頭蓋骨パラメータのR2値の比較。(f) TER55の多変量モデリングにおける前方特徴選択の結果、調整済みR2とAICの推移。(g) 5分割交差検証からの観測値と予測値のTER55の散布図。
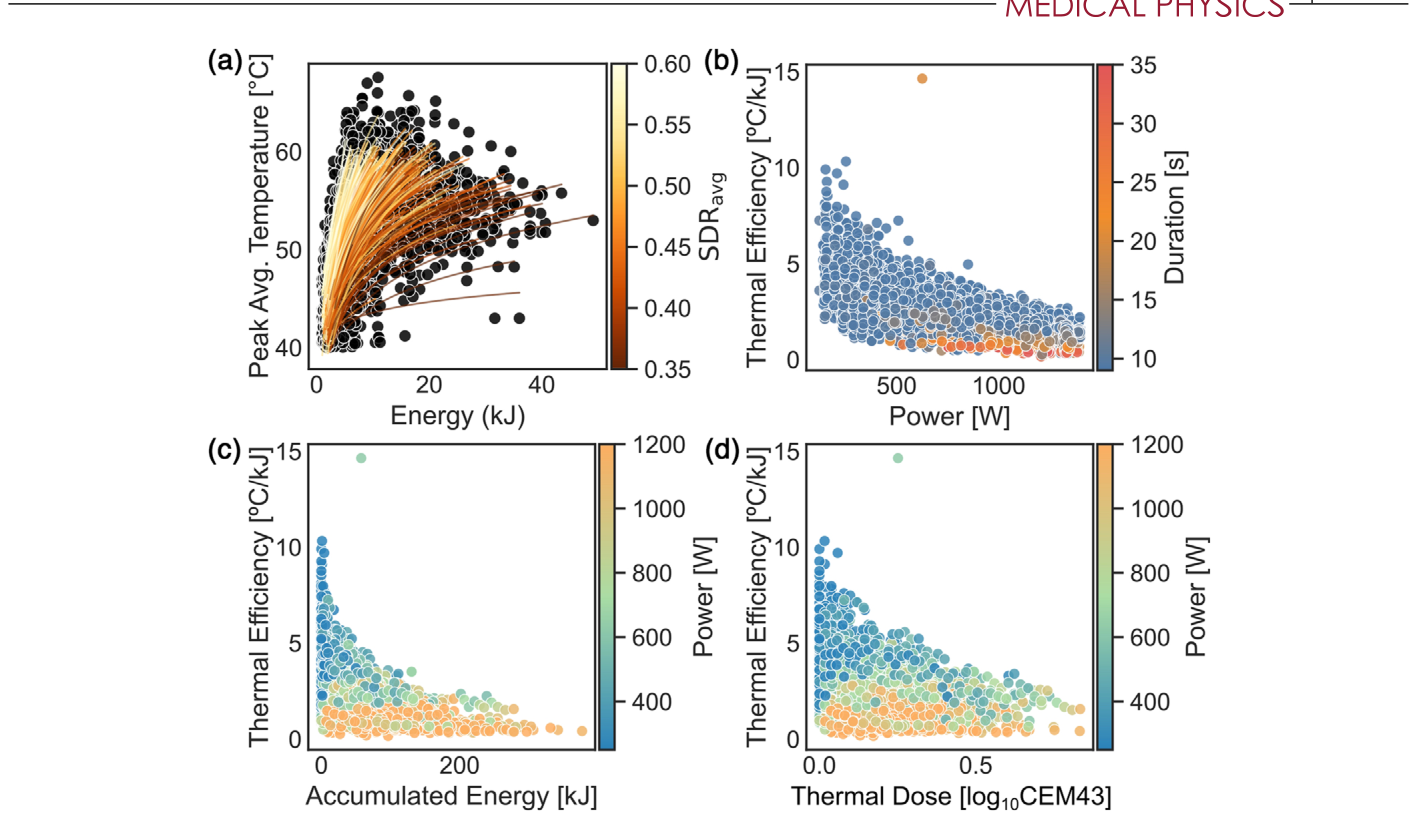
Figure 4. FIGURE 4 Nonlinear dependencies between acoustic delivery parameters and thermal efficiency. (a) Peak average temperature as a function of delivered acoustic energy, illustrating a saturating relationship in which temperature increments progressively diminish at higher energy levels. Line color encodes skull density ratio (SDR). (b) Thermal efficiency, defined as temperature increase per unit energy, plotted against applied acoustic power. Higher powers are associated with reduced efficiency, indicating non-proportional heat deposition. (c) Relationship between accumulated acoustic energy and thermal efficiency, showing a monotonic decrease in efficiency with increasing cumulative energy, potentially reflecting time-dependent skull or tissue effects. (d) Thermal efficiency as a function of thermal dose (log10CEM43), highlighting reduced efficiency at higher doses, which suggest additional non-linear and tissue-related contributions to heating dynamics.解説: 音響エネルギー供給パラメータと熱効率間の非線形な依存関係を示しています。(a) 投入された音響エネルギーに対するピーク平均温度の関数であり、高エネルギーレベルで温度上昇が徐々に減少する飽和関係を示しています。(b) 投入された音響出力に対する熱効率(単位エネルギーあたりの温度上昇として定義)のプロットで、高出力は効率の低下と関連しています。(c) 累積音響エネルギーと熱効率の関係で、累積エネルギーの増加に伴い効率が単調に減少することを示しています。(d) 熱量(log10CEM43)に対する熱効率の関数で、高熱量での効率低下を強調しています。
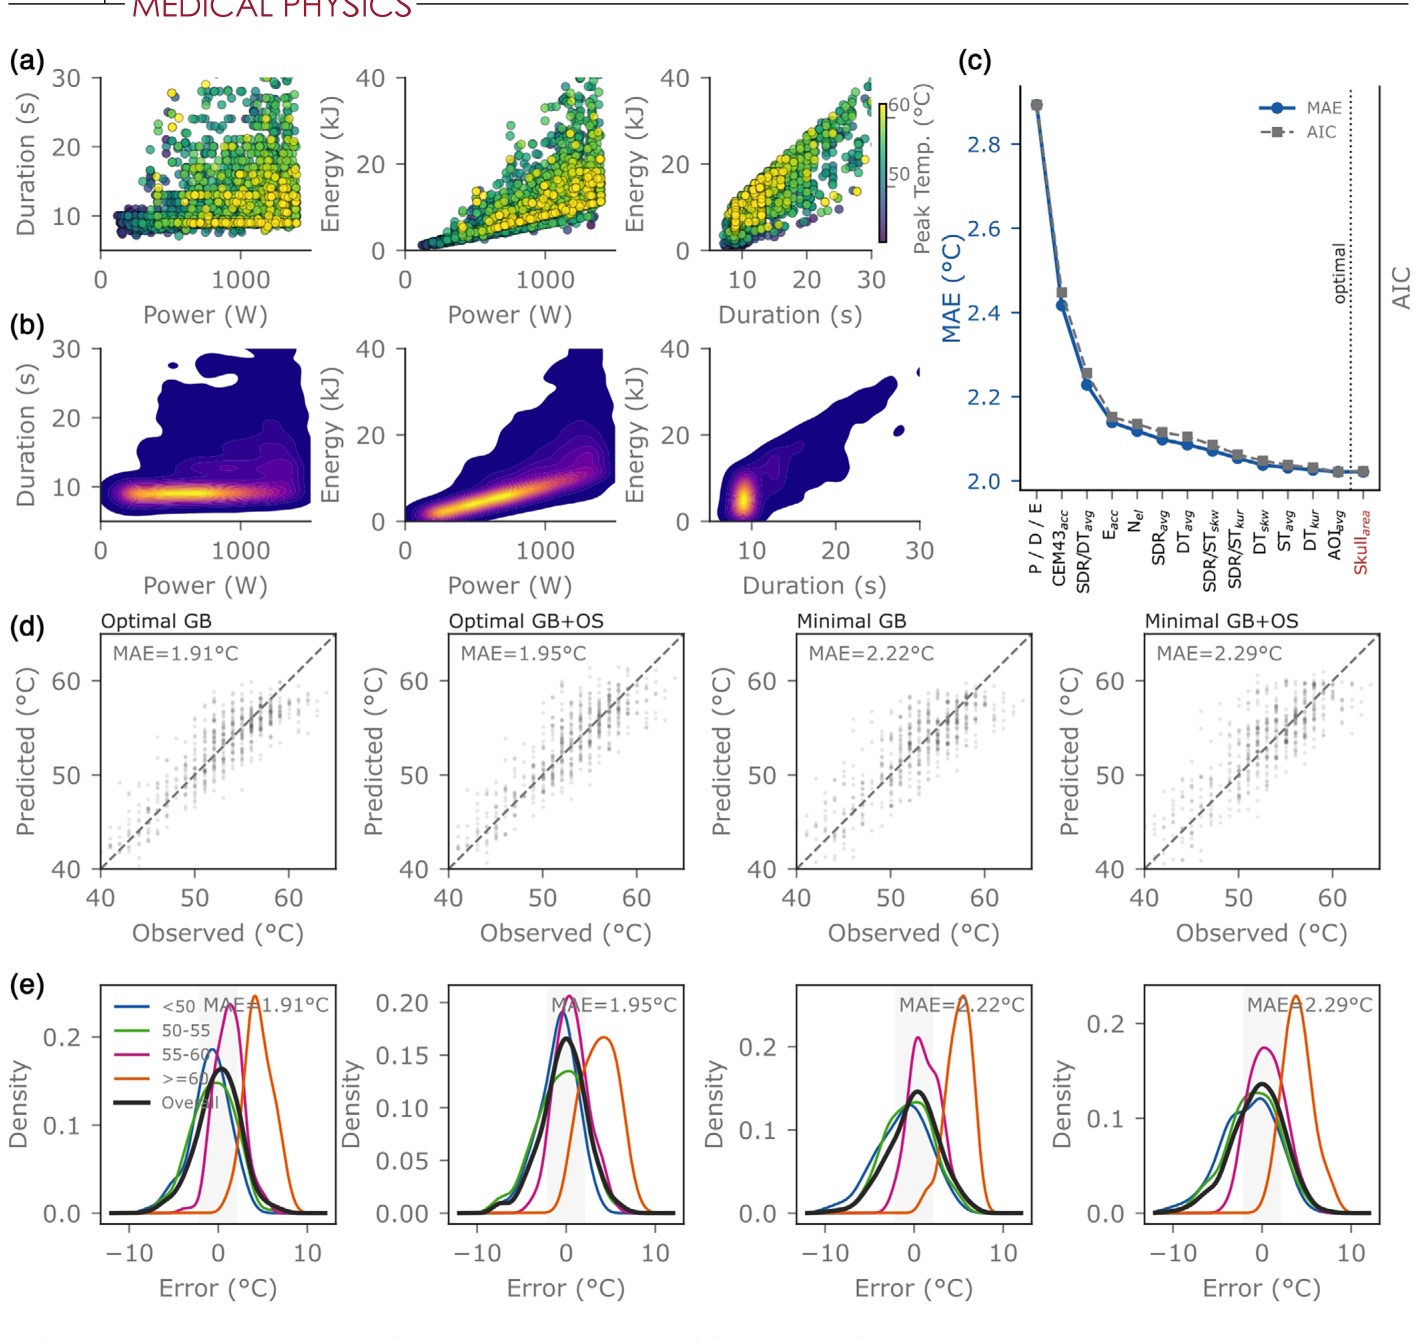
Figure 5. FIGURE 5 Multivariate modeling of peak temperature prediction. (a) Distribution of individual sonications in the power-duration-energy space, color-coded by the achieved peak average temperature. (b) Bivariate two-dimensional density estimates of the same physical relationships, highlighting the most frequent regions of the parameter space. (c) Evolution of the mean absolute error (MAE) as a function of the feature set; the dashed line indicates the baseline reference, and feature sets with the best accuracy-complexity trade-off are highlighted in red. (d) Scatter plots showing the relationship between true and predicted peak average temperature for the different models: minimal feature set, minimal set with oversampling, optimal feature set, and optimal set with oversampling; the dashed line represents identity (y = x). (e) Prediction error density distributions (True—Predicted) for each model, shown by temperature range, and overall, the gray shaded area denotes the ± 2◦C error interval.解説: ピーク温度予測の多変量モデリングを示しています。(a) 出力-持続時間-エネルギー空間における個々のソニケーションの分布を、達成されたピーク平均温度で色分けしています。(b) 同じ物理的関係の二変量二次元密度推定値で、パラメータ空間の最も頻繁な領域を強調しています。(c) 特徴セットの関数としての平均絶対誤差(MAE)の推移で、最適なモデルが示されています。(d) さまざまなモデル(最小特徴セット、オーバーサンプリング付き最小セット、最適特徴セット、オーバーサンプリング付き最適セット)の真のピーク平均温度と予測ピーク平均温度の関係を示す散布図。(e) 各モデルの温度範囲別および全体的な予測誤差密度分布(実測値-予測値)。
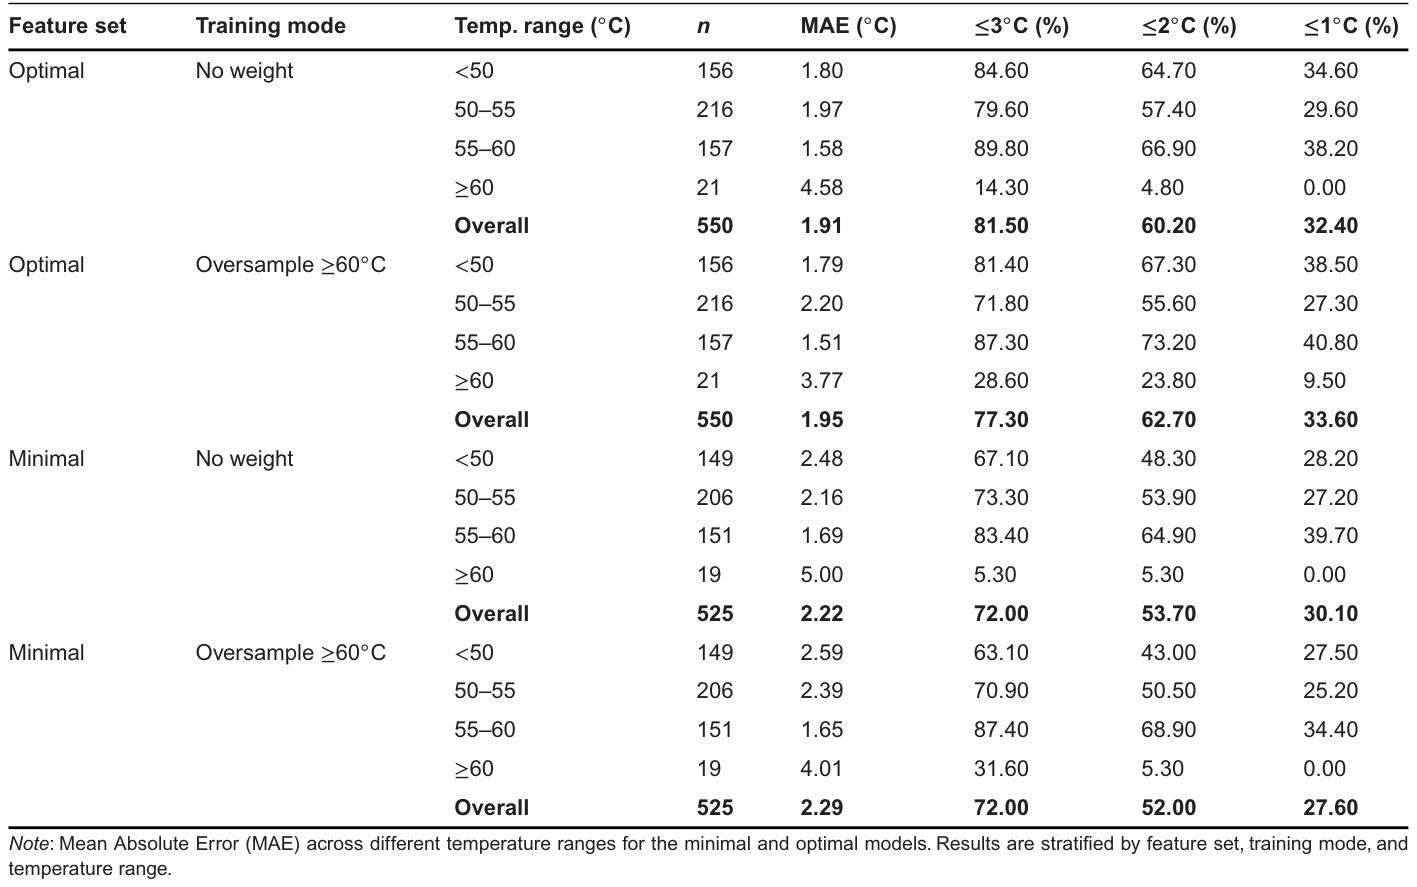
最小の特徴セットを用いたモデルでも、全体のテストMAEは2.22°Cでした。
Table 3. TABLE 3 Held-out test set performance for peak temperature prediction (inclusion criteria: Logistic fit R2 ≥0.75, fitting MAE ≤7.5◦C).解説: ピーク温度予測におけるホールドアウトテストセットの性能を示しています。最小モデルと最適モデルにおける異なる温度範囲での平均絶対誤差(MAE)が報告されています。結果は、特徴セット、トレーニングモード、および温度範囲によって層別化されています。

コメントを残す