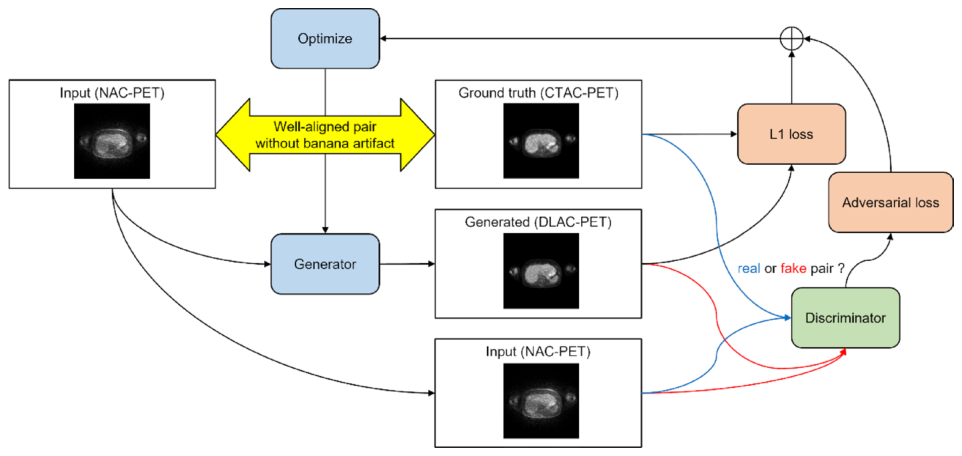
どうも、Beyond the Pixelです。医療画像診断において、PET/CTはがんなどの診断に不可欠なモダリティですが、呼吸による体の動きが画像の質に影響を与えることがあります。特に、PET画像とCT画像が呼吸のタイミングでずれてしまう「呼吸性ミスマッチ」は、診断を困難にする問題を引き起こします。このミスマッチは、PET画像の減弱補正(AC)にCT画像を用いる際に発生し、しばしば「バナナアーチファクト(BA)」と呼ばれる現象を生じさせます。これは、横隔膜直下のトレーサー(薬剤)の取り込みが実際よりも低く評価されるというもので、肝臓上部や下肺野でよく見られます。呼吸性ミスマッチは、PETデータの定量的精度と病変の位置特定を低下させ、診断の妨げとなります。この課題に対し、本研究はディープラーニングを用いた新しい減弱補正法(DLAC)を提案し、その有効性を検証しました。
Table 2. Table 2 Visual assessment of WA-cases (n = 51 per fold) by a physician (K.I.)解説: 本表は、専門家(K.I.)によるWA-cases(各foldにつきn=51)の視覚評価結果をまとめたものです。評価基準は(1)肝臓の形状、(2)横隔膜の形状、(3)スライスの連続性、(4)肝臓のトレーサー取り込みの4項目です。各foldにおける臨床的に許容可能な品質と判断されたケースの数(n)とその割合(%)が示されています。肝臓の取り込みを除き、ほとんどの項目で90%以上のケースが「良好」と評価されました。
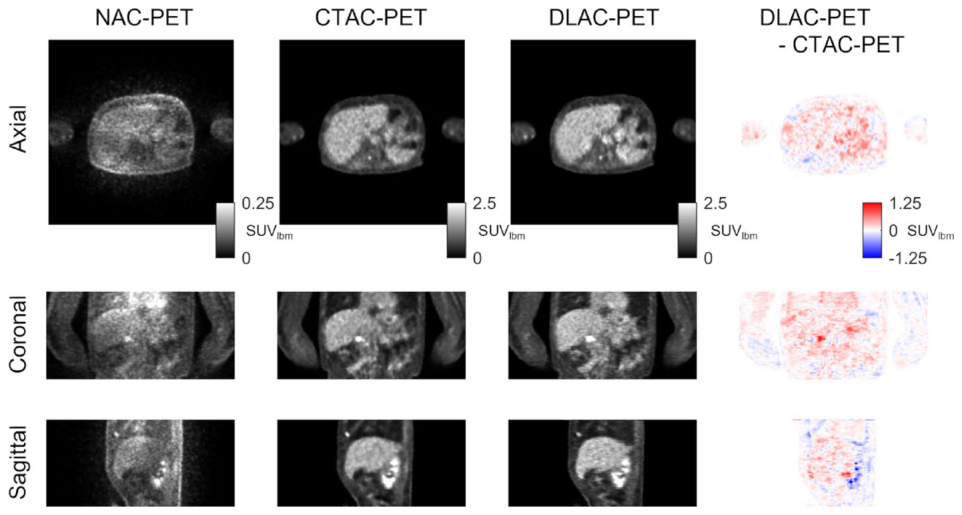
Figure 2. Fig. 2 Results for a representative case (fold 2, male, 76 years). This case was close to the mean performance across all WA-cases. The images shown, from left to right, are input NAC-PET, corresponding CTAC-PET, predicted DLAC- PET, and error map of three orthogonal planes解説: 本図は、肝臓に位置ずれがない代表的なケース(WA-cases)におけるDLAC(Deep Learning-based CT-less Attenuation Correction)の推定結果を示しています。入力のNAC-PET(非減弱補正PET)、対応するCTAC-PET(CT減弱補正PET)、予測されたDLAC-PET、および3つの直交面(軸状、冠状、矢状)におけるDLAC-PETとCTAC-PETの誤差マップが示されています。DLAC-PETは、CTAC-PETと肝臓の形状やトレーサー取り込みが類似しており、臨床的に許容可能な画像品質を示しています。
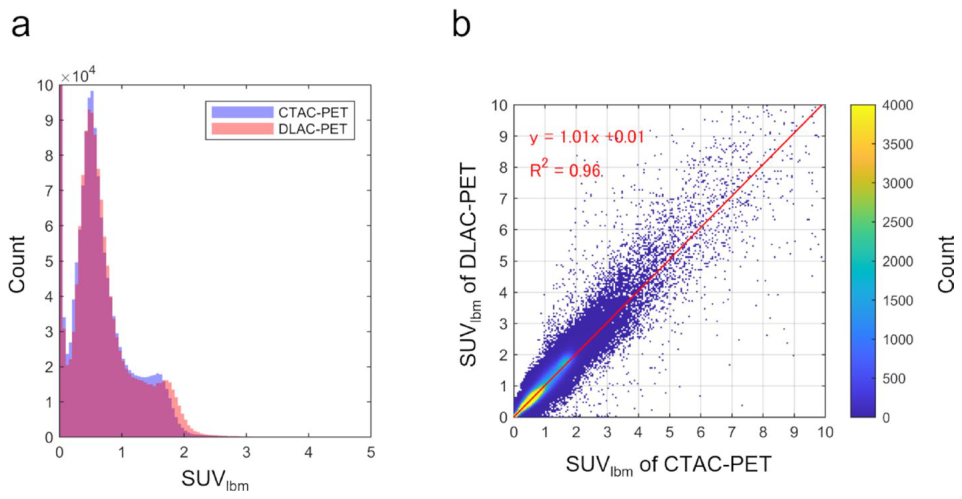
Figure 3. Fig. 3 Histogram analysis of the case presented in Fig. 2. a Histograms of the CTAC-PET (blue) and DLAC-PET (red). The overlapping regions are shown in purple. b Bivariate histogram with CTAC-PET on the x-axis and DLAC-PET on the y-axis解説: 本図は、Figure 2に示したケースのヒストグラム解析結果を示しています。図aはCTAC-PET(青)とDLAC-PET(赤)のSUVlbm値のヒストグラムであり、両者は類似した全体的な形状を示しています。図bはCTAC-PETをx軸、DLAC-PETをy軸とした二変量ヒストグラムで、回帰分析の結果、傾きが1.01、切片が0.01、R2値が0.96であり、両者に強い線形関係があることが示されています。
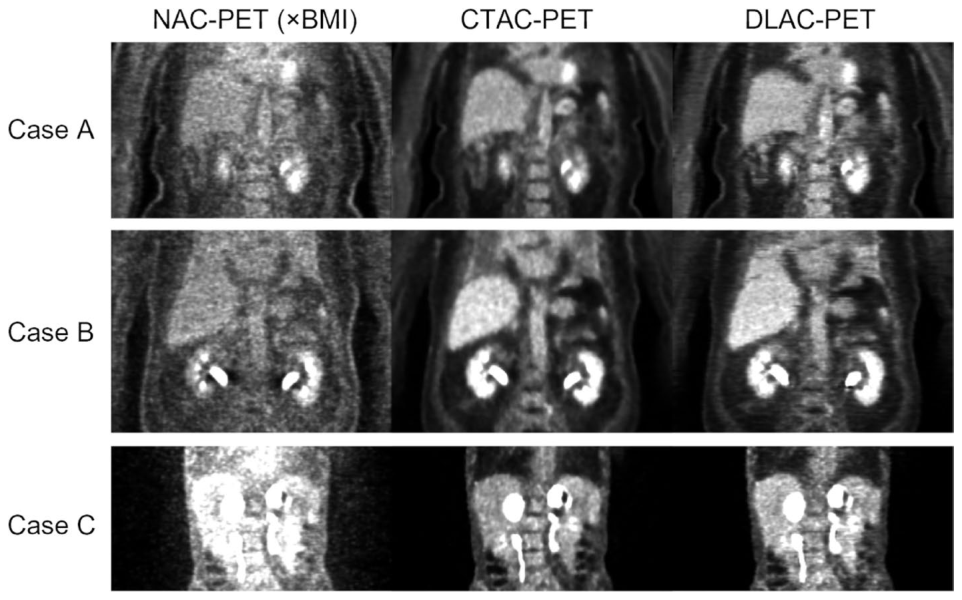
Figure 4. Fig. 4 Three representative failure cases in the visual assessment of DLAC for WA-cases. From top to bottom are shown: Case A (BMI = 32.5; poor liver and diaphragm shape), Case B (BMI = 30.0 with high uptake in the lung bases; poor liver and diaphragm shape), and Cases C (multiple areas of abnormal tracer uptake; poor liver shape and uptake)解説: 本図は、WA-cases(整列良好ケース)におけるDLACの視覚評価で不良と判断された3つの代表的な失敗例を示しています。上から順に、ケースA(BMI=32.5、肝臓と横隔膜の形状不良)、ケースB(BMI=30.0で肺底部に高集積、肝臓と横隔膜の形状不良)、ケースC(異常なトレーサー取り込みの多発領域、肝臓の形状と取り込み不良)です。これらのケースでは、NAC-PET画像の画質が劣化していることが特徴です。
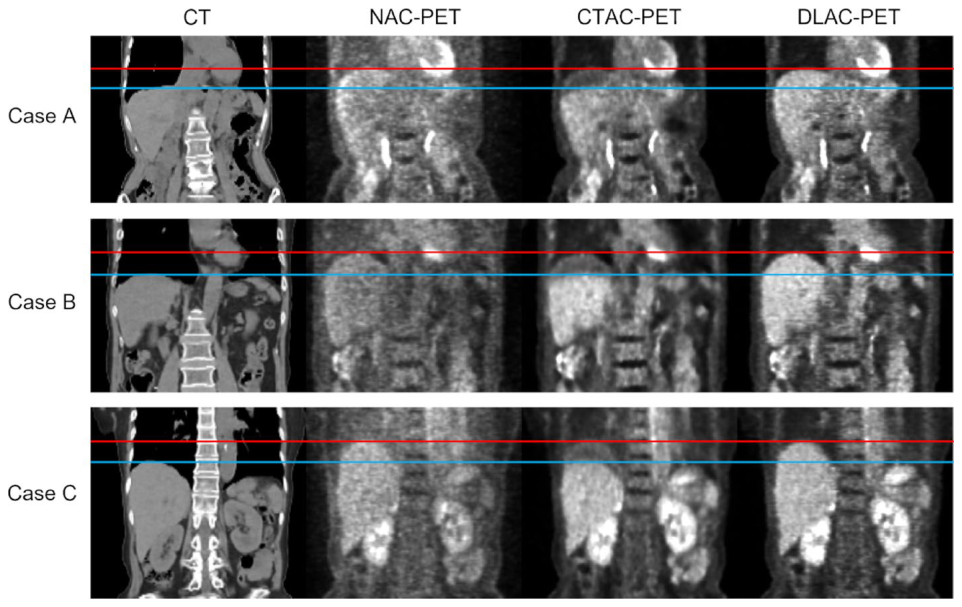
Figure 5. Fig. 5 Test results for three representative cases with apparent BA. From top to bottom are shown: Case A (dNAC-CTAC = 28.0 mm, rBAR = 100%), Case B (dNAC-CTAC = 33.6 mm, rBAR = 100%), and Case C (dNAC-CTAC = 30.8 mm, rBAR = 100%). The red line indicates the upper liver edge position in the NAC-PET image, and the blue line indicates the corresponding position in the CT image解説: 本図は、明らかなバナナアーチファクト(BA)が見られる3つの代表的なケースのテスト結果を示しています。上から順に、ケースA(dNAC-CTAC=28.0mm、rBAR=100%)、ケースB(dNAC-CTAC=33.6mm、rBAR=100%)、ケースC(dNAC-CTAC=30.8mm、rBAR=100%)です。赤線はNAC-PET画像における肝臓上端の位置、青線はCT画像における対応する位置を示しています。CTAC-PET画像では肝臓上端でのトレーサー取り込みが過小評価されていますが、DLAC-PET画像ではより均一な肝臓の取り込みが観察され、BAが効果的に除去されています。
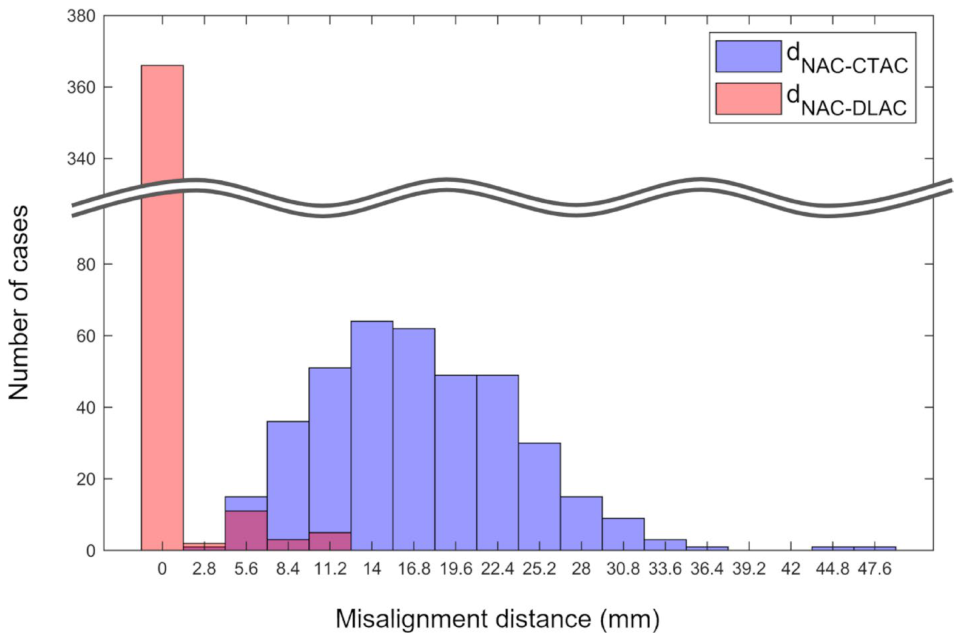
Figure 6. Fig. 6 BA-Cases frequency distributions for dNAC-CTAC (blue) and dNAC-DLAC (red). The overlapping regions are shown in purple解説: 本図は、387のバナナアーチファクトケース(BA-cases)における、dNAC-CTAC(青)とdNAC-DLAC(赤)の周波数分布を示しています。これは、CTAC-PETで観察された元の位置ずれが、DLAC法適用後の残存位置ずれへとどのように変化したかを示しています。重複領域は紫色で示されています。DLAC適用後(赤)は、位置ずれが0mmに近いケースが大幅に増加していることがわかります。
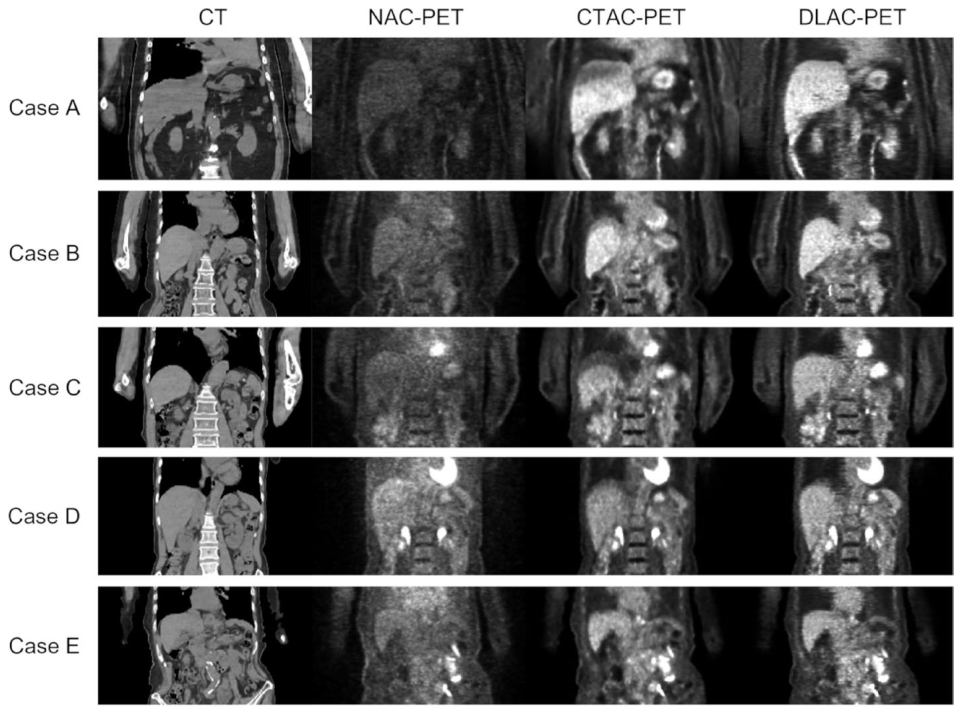
Figure 7. Fig. 7 Test results for five representative BA-cases. From top to bottom are shown: Case A (largest BA, dNAC-CTAC = 44.8 mm, rBAR = 100%), Case B (rBAR = 100%), Case C (rBAR = 69.2%), and Cases D and E (smallest im provement, dNAC-CTAC = 14 mm, dNAC-DLAC = 11.2 mm, rBAR = 20%)解説: 本図は、5つの代表的なバナナアーチファクトケース(BA-cases)のテスト結果を示しています。上から順に、ケースA(最大のBA、dNAC-CTAC=44.8mm、rBAR=100%)、ケースB(rBAR=100%)、ケースC(rBAR=69.2%)、ケースDおよびE(最小の改善、dNAC-CTAC=14mm、dNAC-DLAC=11.2mm、rBAR=20%)です。これらの画像は、DLAC-PETが様々な程度のバナナアーチファクトを低減する効果を示しています。
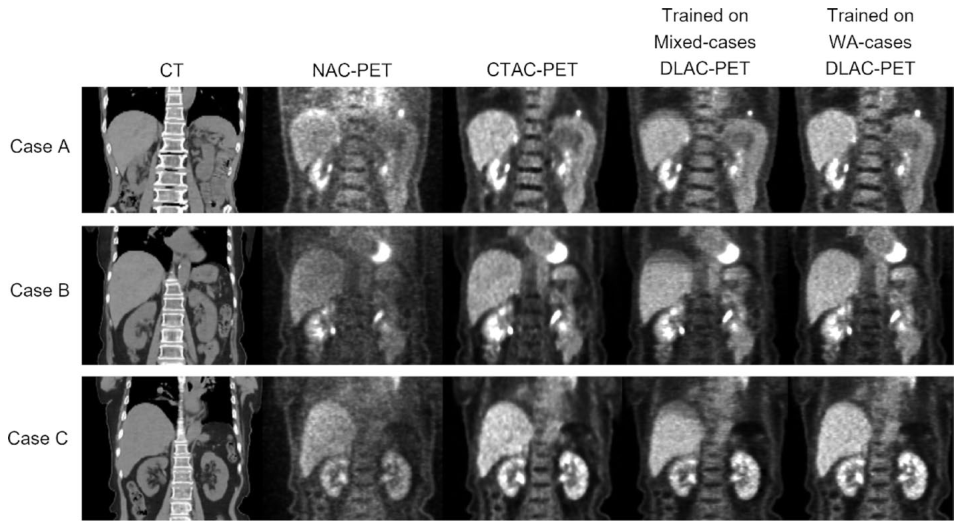
Figure 8. Fig. 8 Comparison of DLAC-PET images generated by the proposed WA-cases model and the mixed-cases model. For all three representative cases (Case A-C), the images generated by the mixed-cases model exhibit BA-like AC er rors at the upper edge of the liver. In contrast, the proposed WA-cases model successfully reproduces liver shapes that are consistent with those observed in the corresponding NAC-PET and CTAC-PET images解説: 本図は、提案されたWA-casesモデルと混合ケースモデルによって生成されたDLAC-PET画像を比較しています。3つの代表的なケース(A~C)すべてにおいて、混合ケースモデルによって生成された画像には、肝臓上端にバナナアーチファクト様の減弱補正エラーが見られます。対照的に、提案されたWA-casesモデルは、対応するNAC-PETおよびCTAC-PET画像で観察される肝臓の形状と一貫した画像を再現しています。
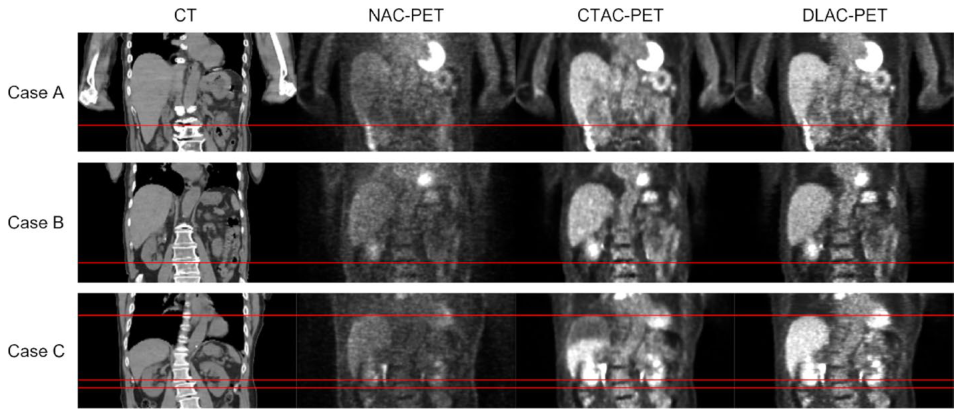
Figure 9. Fig. 9 Test results for three representative cases that include PET-CT misalignments other than BA. Case A shows misalignment at the lower edge of the liver (the red line indicates the lower edge of the liver position in the NAC- PET image). Case B shows misalignment at the lower edge of the kidney (the red line indicates the lower edge of the kidney position in the NAC-PET image). Case C shows typical BA together with misalignment at the lower edges of the liver and kidneys (the red lines shown in the image indicate, from top to bottom, the upper edge of the liver, the lower edge of the liver, and the lower edge of the kidneys in the NAC-PET image)解説: 本図は、バナナアーチファクト(BA)以外のPET-CTミスマッチを含む3つの代表的なケースのテスト結果を示しています。ケースAは肝臓下端での位置ずれ(赤線はNAC-PET画像における肝臓下端の位置)、ケースBは腎臓下端での位置ずれ(赤線はNAC-PET画像における腎臓下端の位置)、ケースCは典型的なBAに加えて肝臓と腎臓の下端での位置ずれを示しています(赤線は上から順にNAC-PET画像における肝臓上端、肝臓下端、腎臓下端の位置)。生成されたDLAC-PET画像は、NAC-PET画像で観察される組織や臓器の解剖学的形状と空間的位置を維持していることを示しています。
我々の研究は、Shiri et al.やLi et al.といった先行研究と比較して、上腹部における減弱補正の精度が向上していることを示唆しています。これは、DDG PETの呼吸位相一致データを選定して学習データとして使用し、各解剖学的領域に特化したモデルを開発することが精度向上に寄与する可能性を示唆しています。ただし、本研究にはいくつかの限界があります。各臓器や病変ごとのSUVの詳細な評価は行われていません。DLAC-PET画像において、わずかなSUVlbmの過大評価が見られるケースもありましたが、その臨床的影響は今回の解析では判断できませんでした。今後は、詳細な局所SUV解析を実施し、定量的信頼性をさらに評価・改善する必要があります。



コメントを残す