どうも、Beyond the Pixelです。大腸がんは、欧州でがんによる疾病負荷の主要な原因の一つであり、診断の遅れを減らすために多くの医療システムで迅速診断パスウェイが採用されています。例えば、スウェーデンの結腸直腸がん標準ケアコース(SCC-CRC)もその一つです。しかし、これらのパスウェイは内視鏡検査のキャパシティに大きな負担をかけ、待機時間の目標が達成されないケースも少なくありません。この状況は、がん発見率を高く維持しつつ、迅速診断パスウェイ内での優先順位付けを支援するツールの必要性を示唆しています。
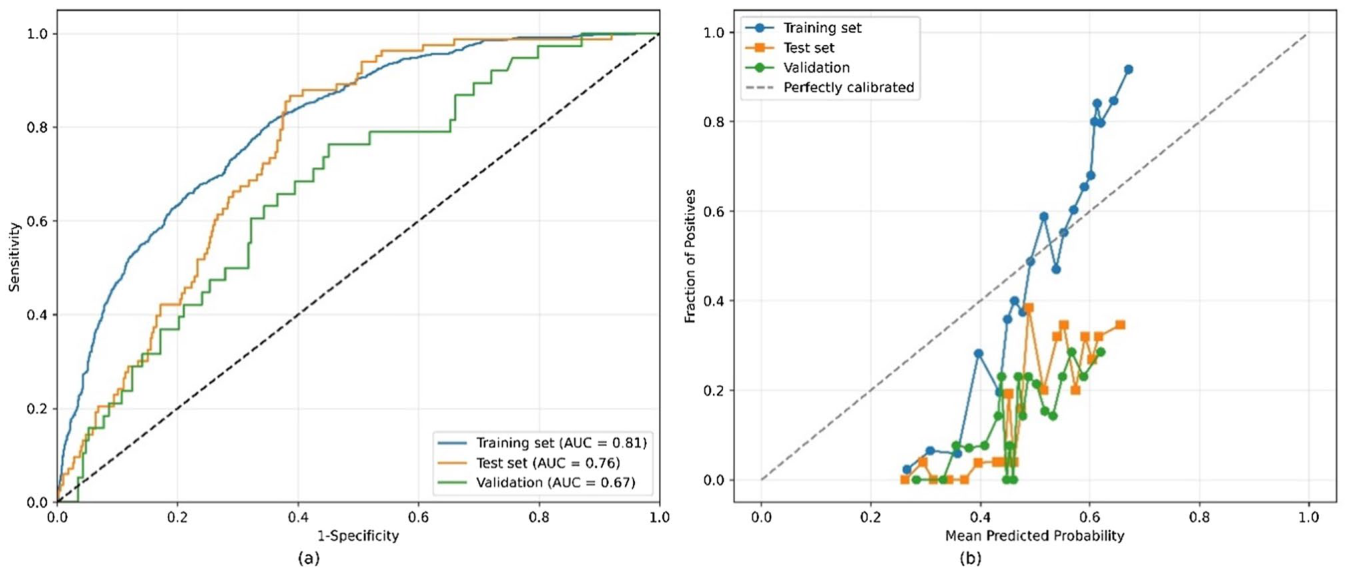
Figure 1. Fig. 1 Discrimination and calibration of the final CatBoost CRC risk model. (a) ROC curves. Performance is shown for the training set (n = 2 031), the inter nal test set (n = 508), and complete-case external validation in 2021-2022 (n = 271 out of 723, after excluding participants with missing predictor values). The dashed 45°-line marks chance discrimination (AUC = 0.5). (b) Calibration plot. For the same three datasets, each symbol represents the observed proportion of CRC within a decile of predicted risk (colours match panel a). The dashed 45° reference denotes perfect calibration; points below the line indicate risk over-estimation, points above indicate under-estimation. Overall, the model tends to overpredict lower risk and underpredict higher risks in training set and consistently overpredict risk in test and validation sets, with calibration slopes of 0.57, 0.55, and 0.48, respectively解説: (a)はROC曲線で、モデルの識別能力を示し、CatBoostモデルのトレーニングセット、テストセット、外部検証におけるAUC値が示されています。(b)はキャリブレーションプロットで、予測リスクと観測リスクの一致度を示しており、モデルが低リスクを過大に予測する傾向があることを表しています。
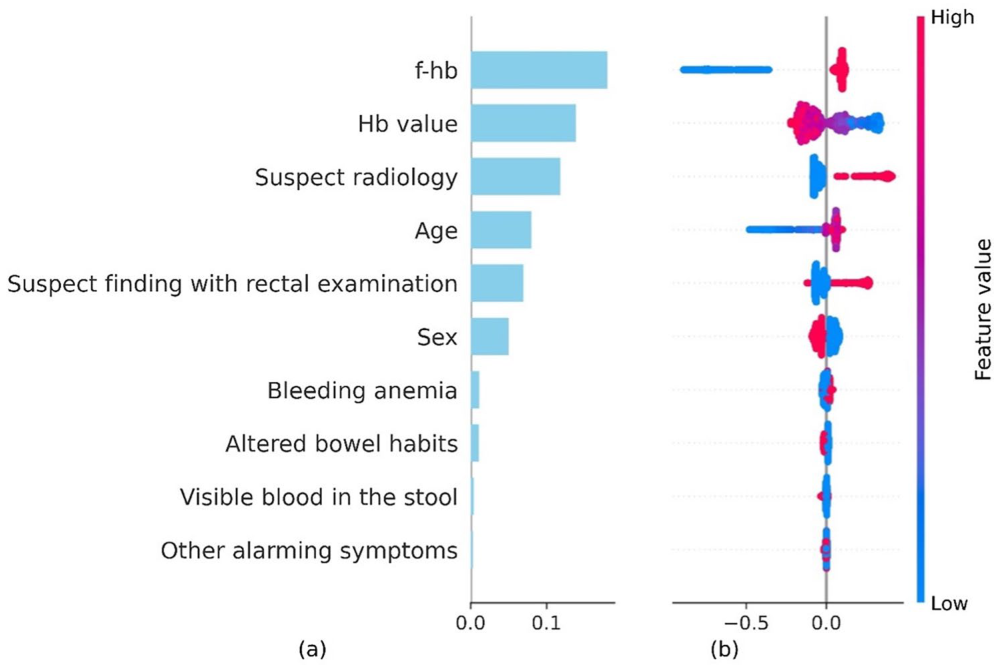
FITステータス、疑わしい画像所見、および年齢が主要な予測因子でした。
Figure 2. Fig. 2 SHAP summary plot illustrating the contribution of each feature to predictions of the final CatBoost model: (a) Mean absolute SHAP value for each feature, representing its overall importance in the model; (b) Distribution of SHAP values for individual instances: each point represents a single observa tion, with colour indicating the feature value (red = high, blue = low). SHAP values represent contributions on the model’s log-odds scale. Positive SHAP values correspond to an increased model prediction toward the positive class (e.g., CRC), while negative values correspond to a decreased prediction. The most influential features in the model are f-Hb, blood Hb (Hb-value), suspect radiology findings, and age解説: CatBoostモデルの予測に対する各特徴の寄与度をSHAP値で示したサマリープロットです。(a)は各特徴の平均絶対SHAP値で全体的な重要度を、(b)は個々の観測値に対するSHAP値の分布を示しており、色(赤は高値、青は低値)で特徴量の値を示しています。便ヘモグロビン(f-Hb)が最も影響力の高い特徴であることがわかります。
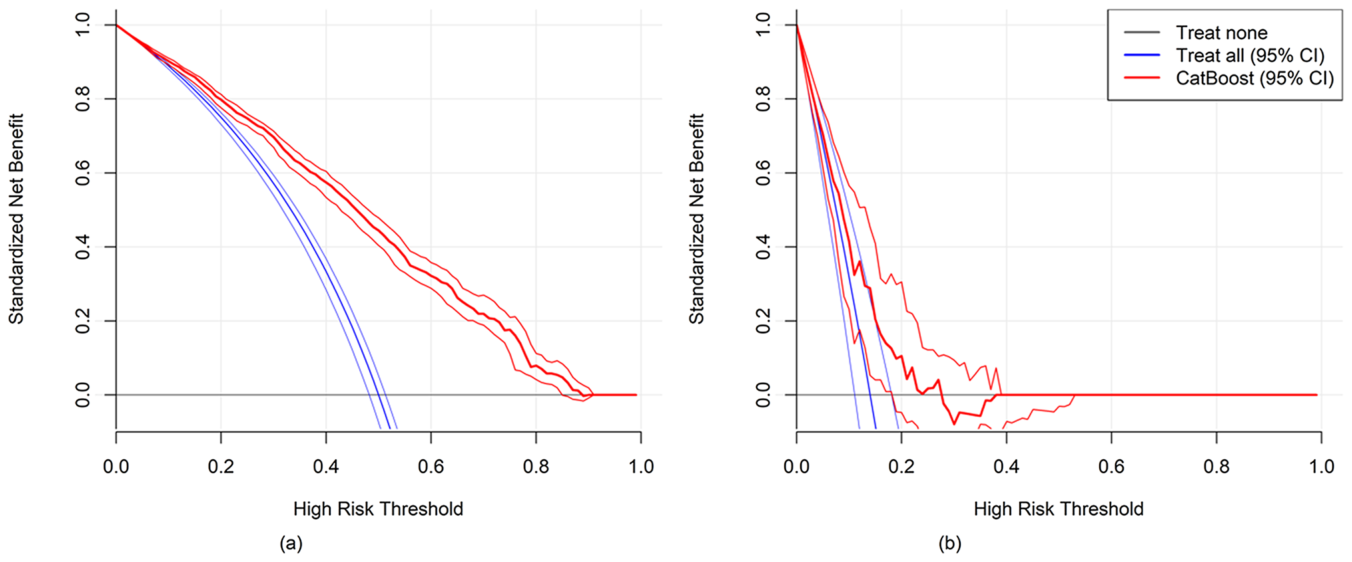
Figure 3. Fig. 3 Decision curve analysis (DCA) of the final CatBoost CRC risk model in the (a) development and (b) external validation cohorts. Net benefit is shown across threshold probabilities for CatBoost, “Treat all” (refer all fast-track patients), and “Treat none”. Shaded bands show 95% confidence intervals from bootstrap resampling. Development cohort uses the internal test split from the 2016–2020 dataset; external validation cohort uses complete cases between 2021 and 2022 (n = 271)解説: CatBoostモデルの決定曲線分析(DCA)の結果です。(a)は開発コホート、(b)は外部検証コホートにおける正味の利益を示しており、CatBoostモデルと「全対象者を検査する」戦略、および「全対象者を検査しない」戦略を比較しています。

コメントを残す