どうも、Beyond the Pixelです。血管造影検査、特にデジタルサブトラクションアンギオグラフィ(DSA)は、血管内の異常を特定し、血管内治療のような低侵襲な手技を行う上で不可欠なツールです。しかし、腹部骨盤領域のDSA画像は、血管構造の多様性、呼吸による動きのアーティファクト、腸の蠕動運動、造影剤の排泄など、多くの課題を抱えています。これらの要因は画像の判読を難しくし、診断に重要なフレーム(画像)がシーケンス全体のごく一部にしか存在しない「情報スパース性」という問題を引き起こします。本日は、これらの課題に対し、深層学習がどのように腹部骨盤DSAの解剖学的部位特定を自動化し、高い精度を達成できるかを探った興味深い研究をご紹介します。
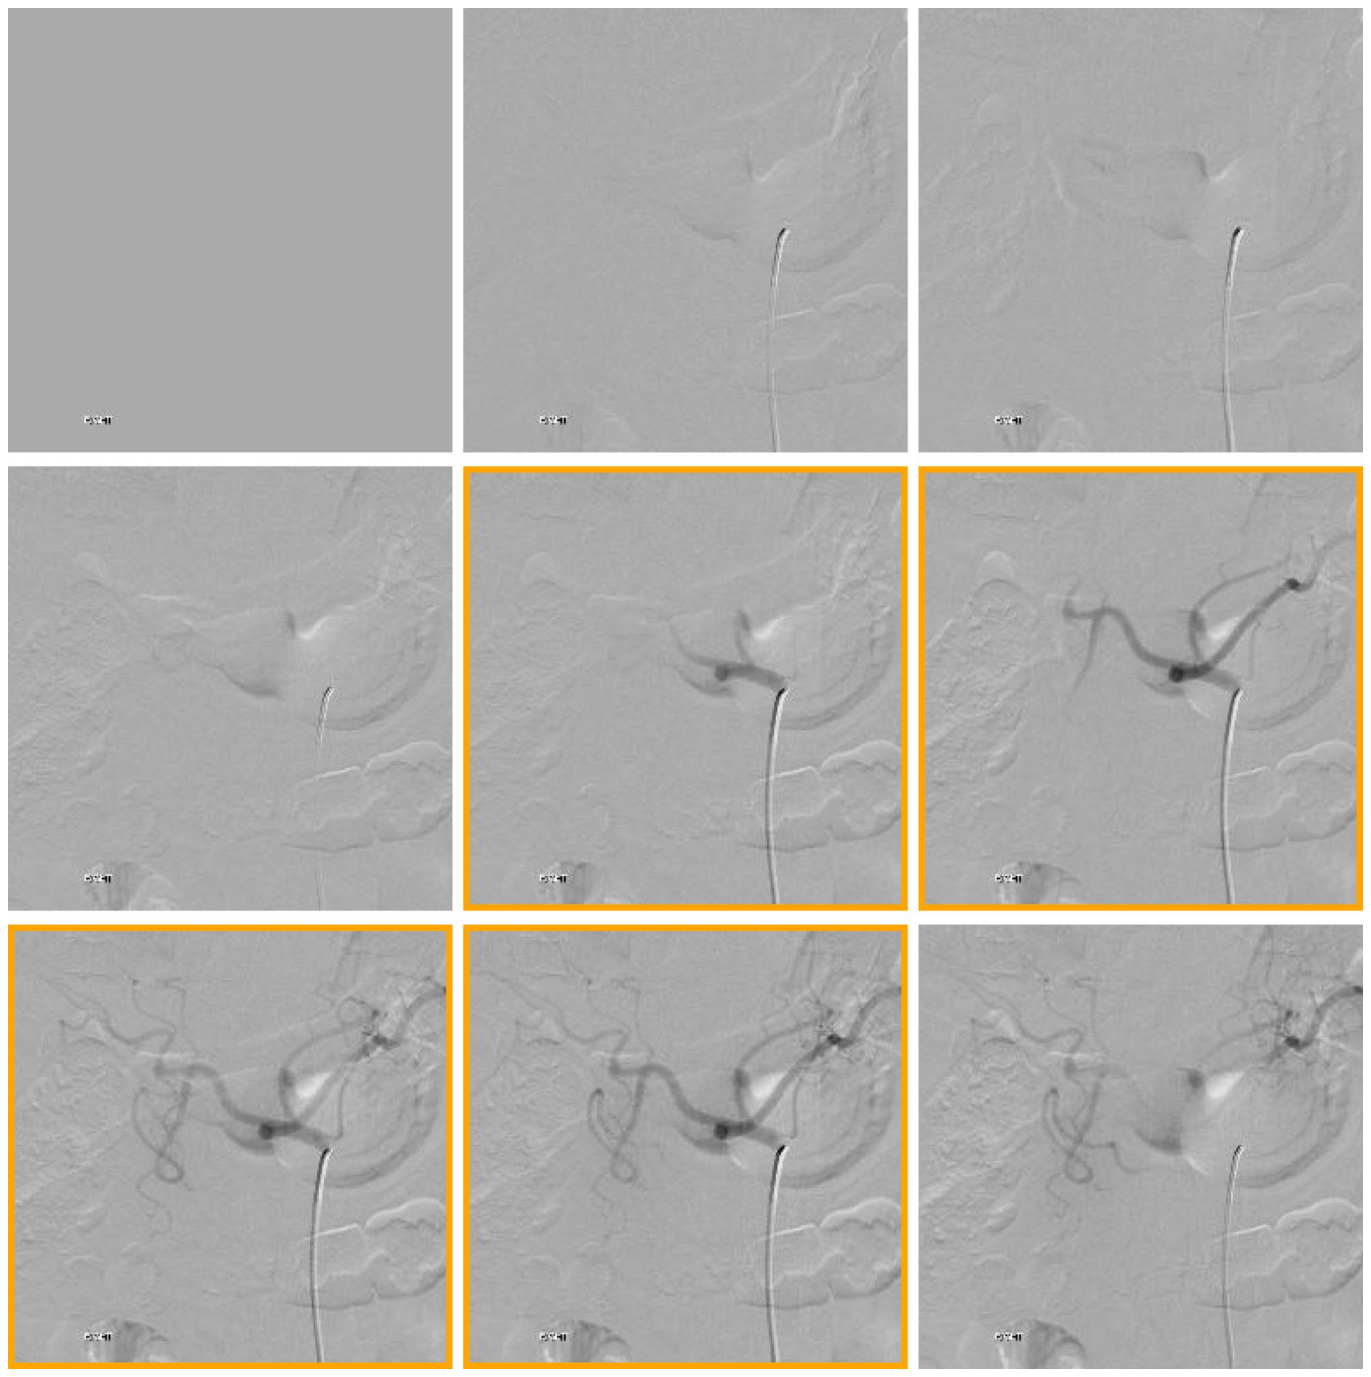
Figure 1. Fig. 1 “Key” image labeling. A 9-image sequence with “key” images framed in gold. All images in an angiographic sequence in which the par- ent vessel and first bifurcation and opacified are labeled “key”解説: この図は「Key」画像の手動ラベリングを示しています。9枚の画像シーケンスの中で、親血管と最初の分岐が造影されている診断上重要な「Key」画像が金色の枠で示されています。
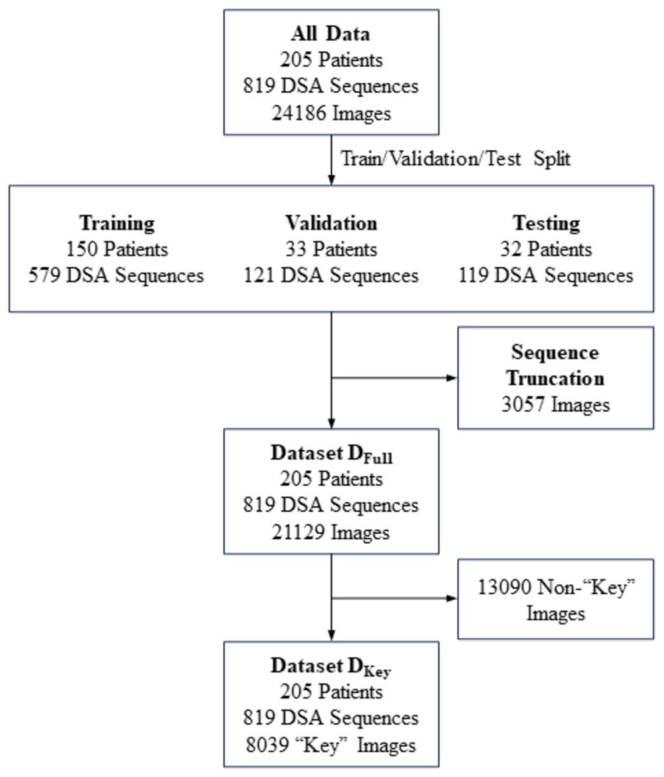
Figure 2. Fig. 2 Datasets for training, validation, and testing. The angio- graphic sequences were split randomly into training (70%), validation (15%), and test (15%) sets, each containing non-overlapping patients. Sequences with more than 50 images were truncated at 50 images. Dataset DFull is comprised of all individual images from the 205 unique patients and 276 procedures after splitting into training, vali- dation, and test sets and sequence truncation. Dataset DKey is a subset of DFull comprised of the “key” images only for each sequence解説: このフローチャートは、モデルの訓練、検証、テストに使用されたデータセットの構成を示しています。205名の対象者からの819のDSAシーケンスが、訓練、検証、テストセットに分割され、それぞれ「Key」画像と非「Key」画像を含むDFullと「Key」画像のみのDKeyが構築されました。
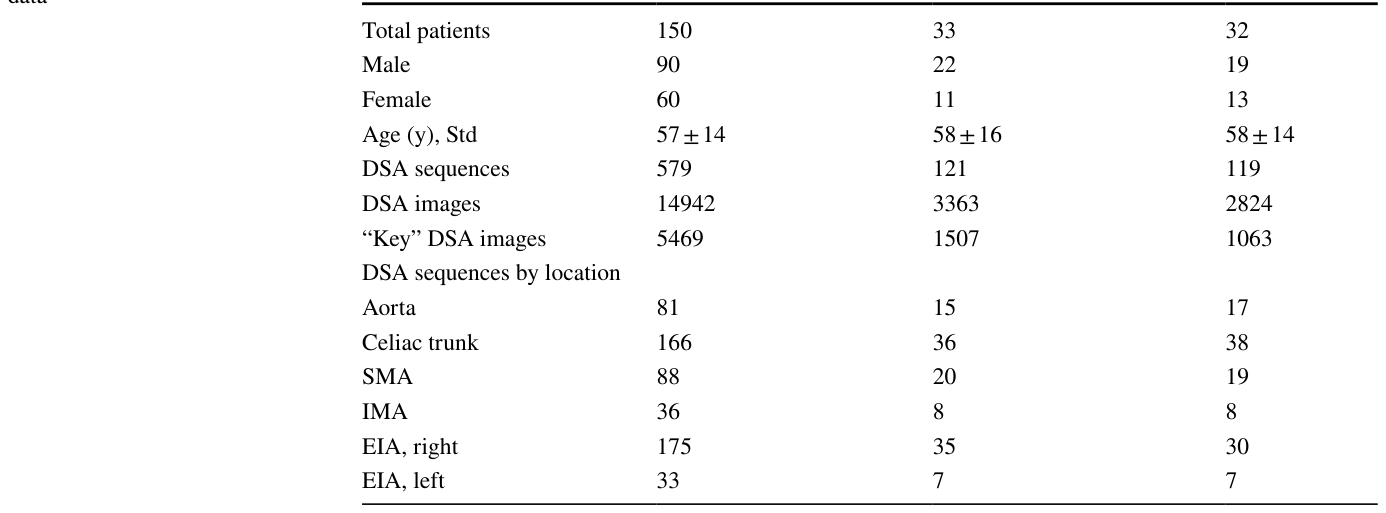
Table 1. Table 1 Characteristics of the data Training dataset Validation dataset Testing dataset解説: この表は、訓練、検証、テストの各データセットにおける対象者特性とDSAシーケンスの数、および解剖学的部位ごとのDSAシーケンスの内訳をまとめたものです。
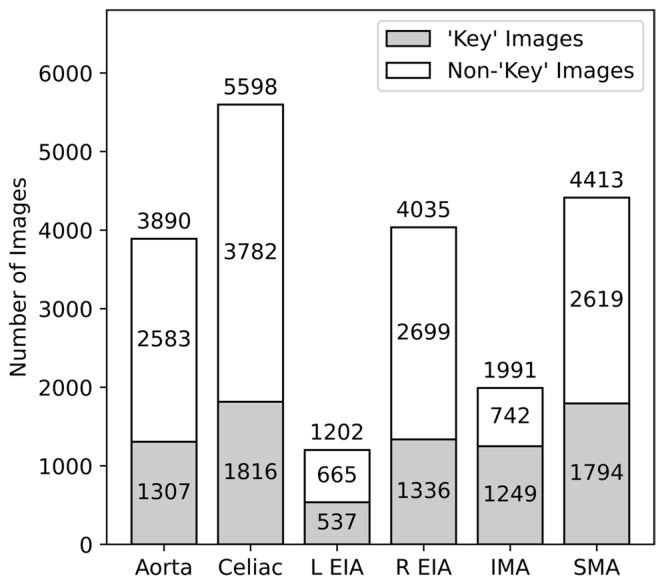
Figure 4. Fig. 4 Information density. Diagnostic “key” images represent images demonstrating opacification of the index artery and the first downstream bifurcation such that the location may be inferred. The remainder of the images are labeled non-“key.” The images are grouped by label class. R, right; L, left; EIA, external iliac artery; IMA, inferior mesenteric artery; SMA, superior mesenteric artery解説: この棒グラフは、診断上重要な「Key」画像と非「Key」画像の数を、解剖学的部位ごとに示しています。データセット全体の情報スパース性、すなわち「Key」画像が総画像数の少数であることが視覚化されています。
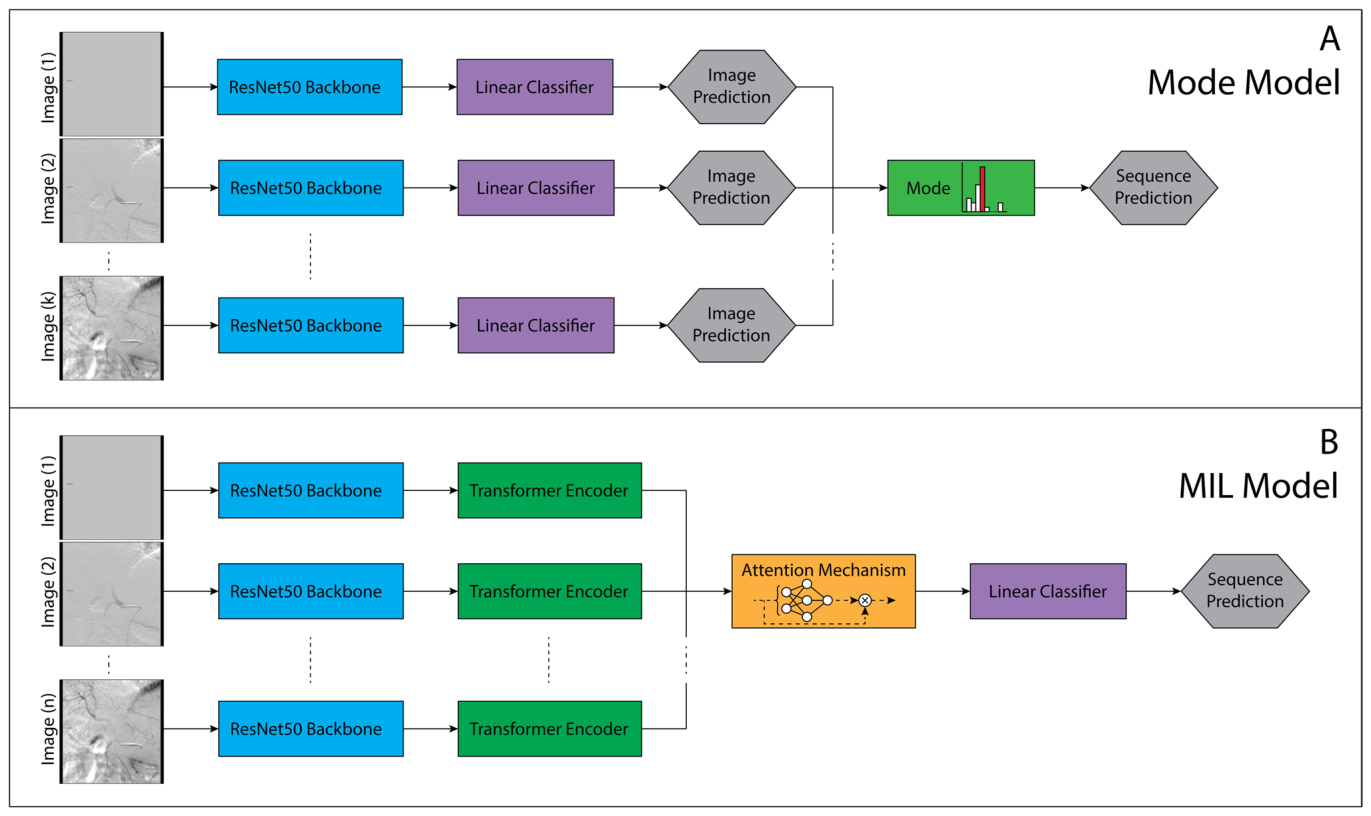
Figure 3. Fig. 3 Schematic representations of the deep learning model architectures. A Mode Model. The angiographic location of individual images is predicted using a ResNet50 convolutional neural network (CNN) and fully connected linear classifier. The model accepts a DSA sequence of an arbitrary number of k images. The prediction for the DSA sequence is calculated by the mode of the individual predictions. B MIL Model. The extracted features of images from ResNet50 CNN are supplied to a transformer encoder and subsequently an attention mechanism. The model accepts a sequence of n images, where for sequences < n, the sequence is padded with blank images. The model predicts the anatomic location of the sequence and the “key” diagnostic images within the sequence based upon the attention weights解説: この図は、開発された深層学習モデルのアーキテクチャの概略図です。Aはモードモデルを示し、個々の画像予測を集約してシーケンス予測を行います。BはMILモデルを示し、ResNet50からの特徴をトランスフォーマーエンコーダとアテンションメカニズムを通してシーケンス分類を行います。
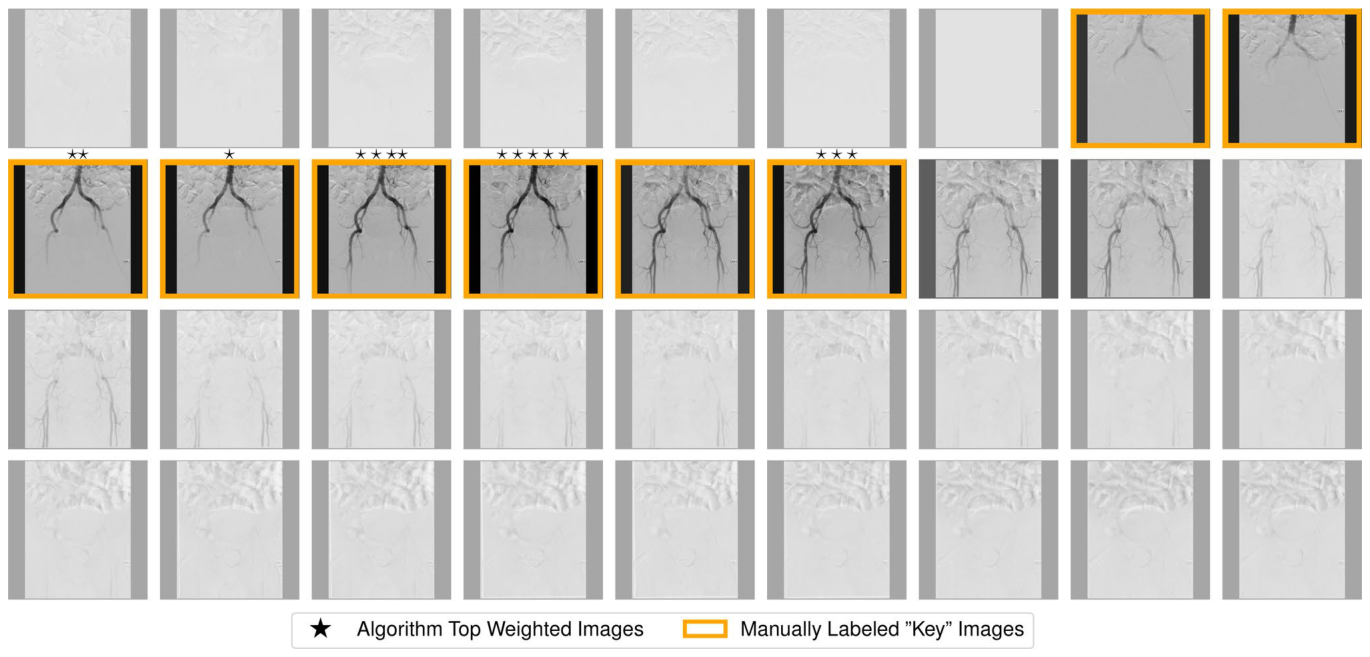
Figure 6. Fig. 6 Comparison of manually labeled “key” images to weights of the MIL model attention mechanism. The opacity of each image in the DSA sequence of the aorta varies directly with the MIL algorithmically generated weights. Images with stars above represent the top five weighted images by the MIL model, with the star count correlating to the assigned weight. The manually labeled “key” images are framed in gold解説: この図は、MILモデルのアテンションメカニズムによって割り当てられた重みと、手動でラベリングされた「Key」画像との比較を示しています。各画像の不透明度は、MILアルゴリズムが生成した重みに直接対応しており、星の数は重みの高さを表しています。手動でラベリングされた「Key」画像は金色の枠で囲まれています。
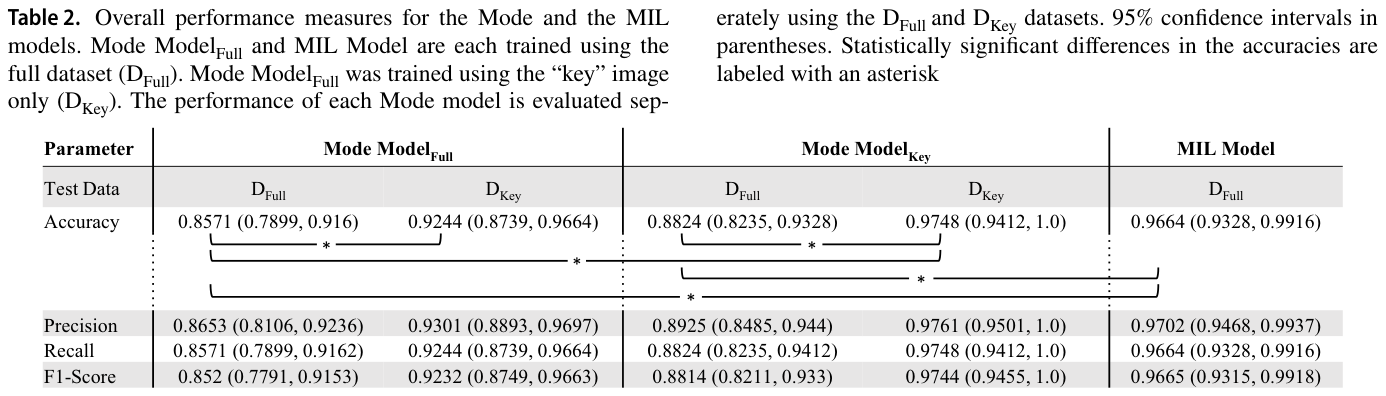
Table 2. Table 2. Overall performance measures for the Mode and the MIL models. Mode ModelFull and MIL Model are each trained using the full dataset (DFull). Mode ModelFull was trained using the “key” image only (DKey). The performance of each Mode model is evaluated sep-解説: この表は、モードモデルとMILモデルの全体的な性能指標(精度、適合率、再現率、F1スコア)を、95%信頼区間とともに示しています。DFullデータセットとDKeyデータセットで評価された各モードモデルの性能が比較されており、統計的に有意な差にはアスタリスクが付いています。
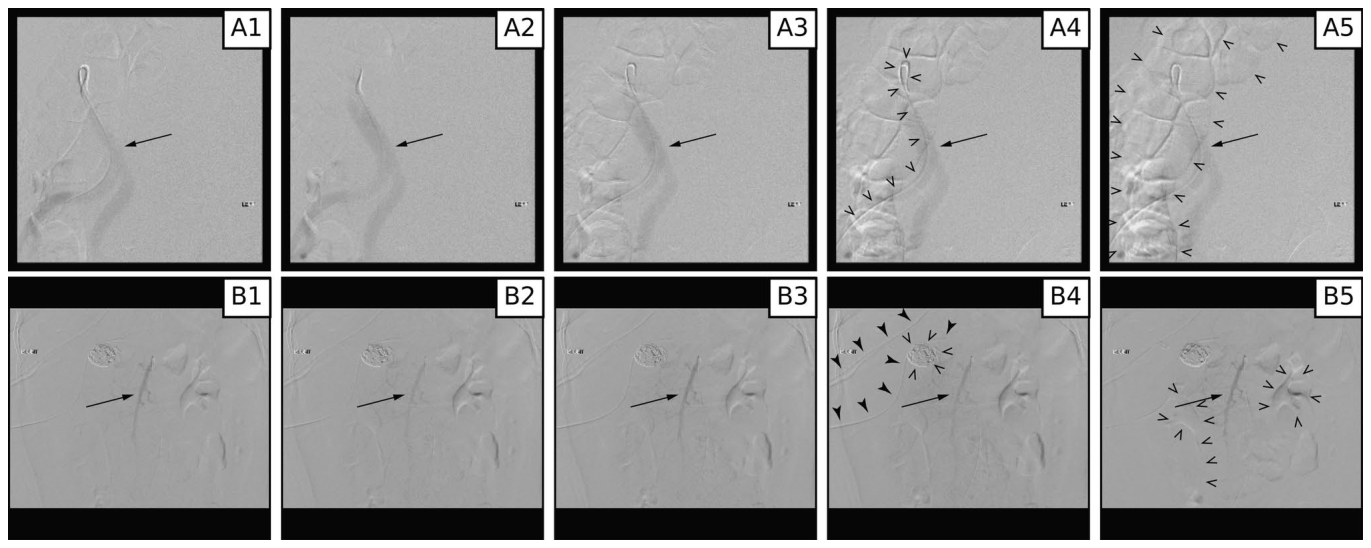
Figure 5. Fig. 5 “Key” images from DSA sequences of the aorta (A) and superior mesenteric artery (B) misclassified by the MIL algorithm. Variable contrast within the vessels is highlighted by arrows in all frames (A and B). Multiple artifacts are created by motion including the angiographic catheter (open arrowheads, frame A4), bowel (open arrowheads, frame A5), internal hardware (open arrowheads, frame B4), overlying support hardware (solid arrowheads, frame B4), and renal contrast excretion (open arrowheads, frame B5)解説: この図は、MILアルゴリズムによって誤分類された大動脈(A)と上腸間膜動脈(B)のDSAシーケンスにおける「Key」画像を示しています。各フレームに矢印で示された血管内の造影剤の変動や、動きのアーティファクト(カテーテル、腸、内部ハードウェア、腎臓の造影剤排泄)が強調されています。

コメントを残す