どうも、Beyond the Pixelです。敗血症性ショックは、全世界で高い死亡率を示す重篤な病態です。この状態は、全身性の血管拡張と循環不全を特徴とし、血圧維持のためにノルエピネフリン(NE)などの血管作動薬が第一選択薬として用いられます。しかし、同じ量のノルエピネフリンを投与しても、対象者ごとに血管の反応性は大きく異なります。血管緊張が速やかに回復する対象者がいる一方で、カテコラミン耐性血管麻痺と呼ばれる、薬剤に反応しにくい状態が持続する対象者も存在します。このような個別の反応性をベッドサイドでリアルタイムに評価できれば、よりパーソナライズされた治療が可能になり、予後改善に繋がる可能性があります。しかし、これまでの研究では、血管ノルエピネフリン反応指数(VNERi)のような指標は、主に治療開始時の単一時点での評価に留まっていました。そこで今回ご紹介する論文は、敗血症性ショックにおけるVNERiの48時間にわたる経時的変化を初めて前向きに追跡し、その予後予測能を検証した画期的な研究です。
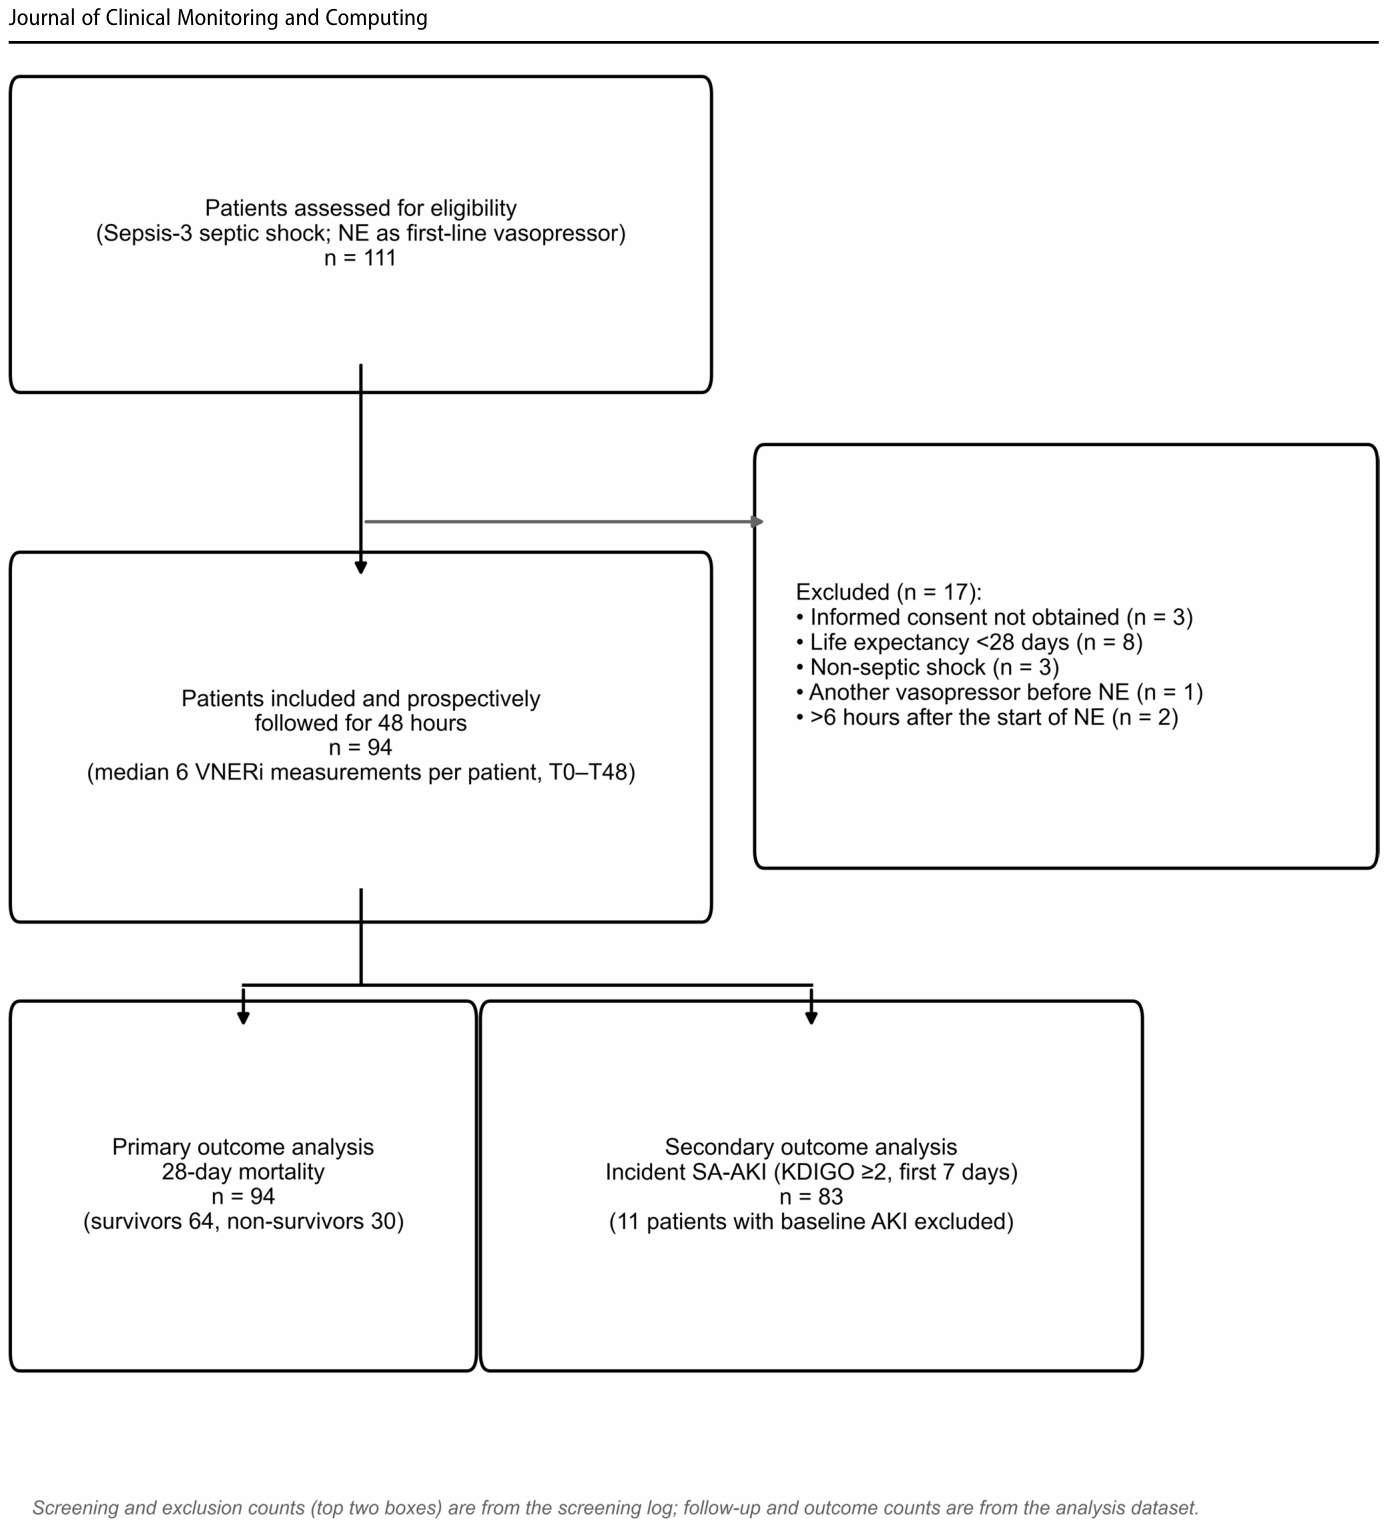
Figure 1. Fig. 1 Study flow diagram. Of 111 patients assessed for eligibility, 17 were excluded and 94 were included and followed prospectively for 48 h (median 6 vascular norepinephrine response index [VNERi] mea surements per patient, from hour 0 to hour 48). The primary analysis of 28-day mortality included all 94 patients (64 survivors, 30 non-survi vors). The exploratory analysis of incident sepsis-associated acute kid解説: このフローダイアグラムは、研究に参加した対象者の選択プロセスを示しています。111名の対象者が適格性を評価され、そのうち17名が除外されました。最終的に94名が研究に含まれ、48時間にわたって前向きに追跡されました。主要解析は28日死亡率について全94名で実施され、副次解析である敗血症関連急性腎障害の新規発症については、ベースラインで腎障害がなかった83名で評価されました。
に示されています。
主要な発見:VNERiの経時的変化は予後と関連するが、既存指標を超えるものではない
この研究の重要な結果は以下の通りです。
1. ベースラインVNERiは予後予測能が低い
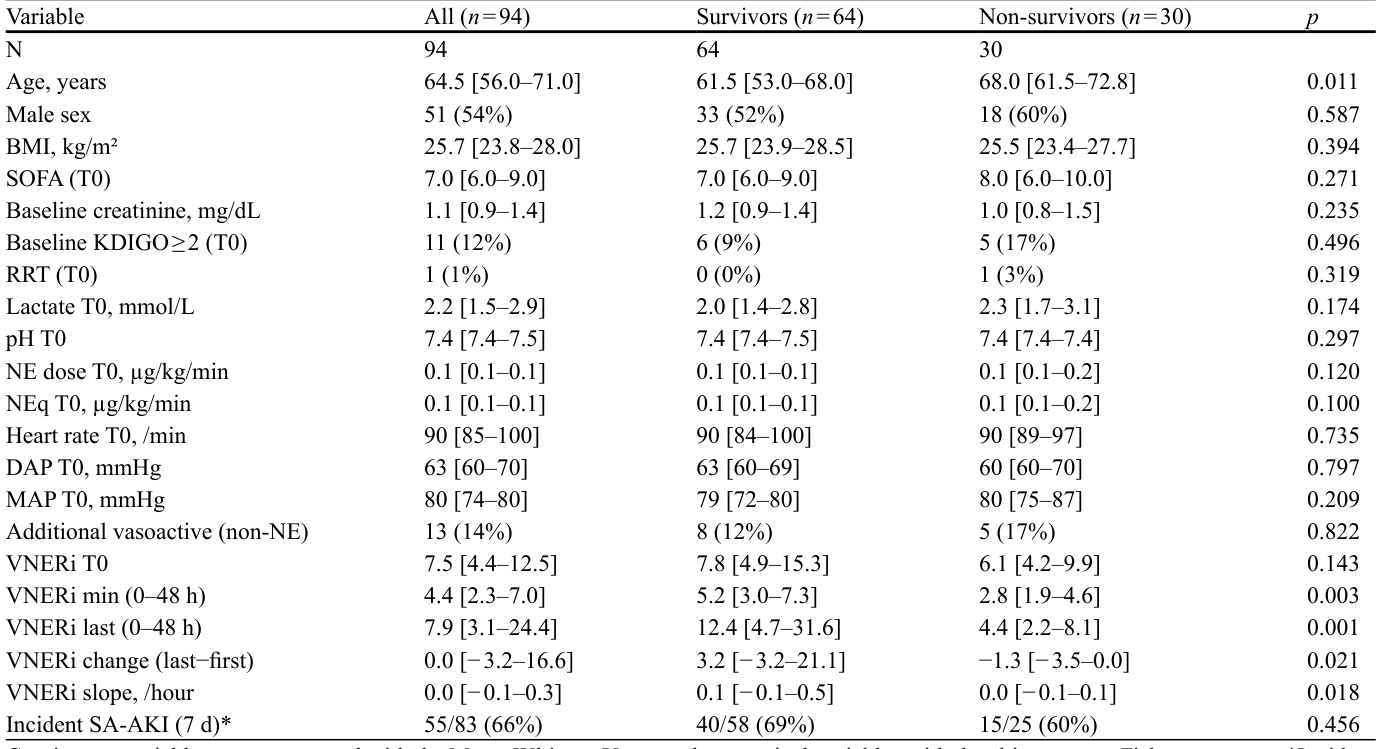
28日死亡率は32%(94名中30名)でした。ベースラインのVNERi中央値は7.5であり、ほとんどの対象者で血管反応性が保たれていました。このため、ベースラインVNERiは死亡率との関連が明確ではなく、予後予測能も低い結果となりました(AUC 0.59)。これは、対象者の多くがベースラインで血管低反応性を示さなかったためと考えられます。非生存者は生存者よりも年齢が高かったものの(中央値68歳 vs 61.5歳、p=0.011)、ベースラインのSOFAスコア、乳酸値、ノルエピネフリン投与量、その他の血行動態変数は両群間で類似していました。詳細なベースライン特性は
Table 1. Table 1 Baseline characteristics by survivors and non-survivors. Continuous variables are shown as the median [interquartile range, IQR] Variable All (n = 94) Survivors (n = 64) Non-survivors (n = 30) p N 94 64 30 Age, years 64.5 [56.0–71.0] 61.5 [53.0–68.0] 68.0 [61.5–72.8] 0.011 Male sex 51 (54%) 33 (52%) 18 (60%) 0.587 BMI, kg/m² 25.7 [23.8–28.0] 25.7 [23.9–28.5] 25.5 [23.4–27.7] 0.394 SOFA (T0) 7.0 [6.0–9.0] 7.0 [6.0–9.0] 8.0 [6.0–10.0] 0.271 Baseline creatinine, mg/dL 1.1 [0.9–1.4] 1.2 [0.9–1.4] 1.0 [0.8–1.5] 0.235 Baseline KDIGO ≥ 2 (T0) 11 (12%) 6 (9%) 5 (17%) 0.496 RRT (T0) 1 (1%) 0 (0%) 1 (3%) 0.319 Lactate T0, mmol/L 2.2 [1.5–2.9] 2.0 [1.4–2.8] 2.3 [1.7–3.1] 0.174 pH T0 7.4 [7.4–7.5] 7.4 [7.4–7.5] 7.4 [7.4–7.4] 0.297 NE dose T0, µg/kg/min 0.1 [0.1–0.1] 0.1 [0.1–0.1] 0.1 [0.1–0.2] 0.120 NEq T0, µg/kg/min 0.1 [0.1–0.1] 0.1 [0.1–0.1] 0.1 [0.1–0.2] 0.100 Heart rate T0, /min 90 [85–100] 90 [84–100] 90 [89–97] 0.735 DAP T0, mmHg 63 [60–70] 63 [60–69] 60 [60–70] 0.797 MAP T0, mmHg 80 [74–80] 79 [72–80] 80 [75–87] 0.209 Additional vasoactive (non-NE) 13 (14%) 8 (12%) 5 (17%) 0.822 VNERi T0 7.5 [4.4–12.5] 7.8 [4.9–15.3] 6.1 [4.2–9.9] 0.143 VNERi min (0–48 h) 4.4 [2.3–7.0] 5.2 [3.0–7.3] 2.8 [1.9–4.6] 0.003 VNERi last (0–48 h) 7.9 [3.1–24.4] 12.4 [4.7–31.6] 4.4 [2.2–8.1] 0.001 VNERi change (last−first) 0.0 [− 3.2–16.6] 3.2 [− 3.2–21.1] −1.3 [− 3.5–0.0] 0.021 VNERi slope, /hour 0.0 [− 0.1–0.3] 0.1 [− 0.1–0.5] 0.0 [− 0.1–0.1] 0.018 Incident SA-AKI (7 d)* 55/83 (66%) 40/58 (69%) 15/25 (60%) 0.456 Continuous variables were compared with the Mann-Whitney U test and categorical variables with the chi-square or Fisher exact test. *Incident SA-AKI was assessed only in the 83 patients without kidney injury at baseline (58 survivors, 25 non-survivors). BMI, body mass index; DAP, diastolic arterial pressure; IQR, interquartile range; KDIGO, Kidney Disease: Improving Global Outcomes; MAP, mean arterial pressure; NE, norepinephrine; NEq, norepinephrine equivalent; RRT, renal replacement therapy; SA-AKI, sepsis-associated acute kidney injury; SOFA, Sequential Organ Failure Assessment; T0, baseline (hour 0); VNERi, vascular norepinephrine response index解説: この表は、生存者と非生存者におけるベースライン特性を比較したものです。年齢(中央値64.5歳)やSOFAスコア(中央値7.0)、ベースラインのVNERi(中央値7.5)などが示されています。非生存者は生存者よりも年齢が高かった(中央値68.0歳 vs 61.5歳、p=0.011)ですが、SOFAスコアや乳酸値、ノルエピネフリン投与量など、他の多くのベースライン指標は両群間で有意な差がありませんでした。
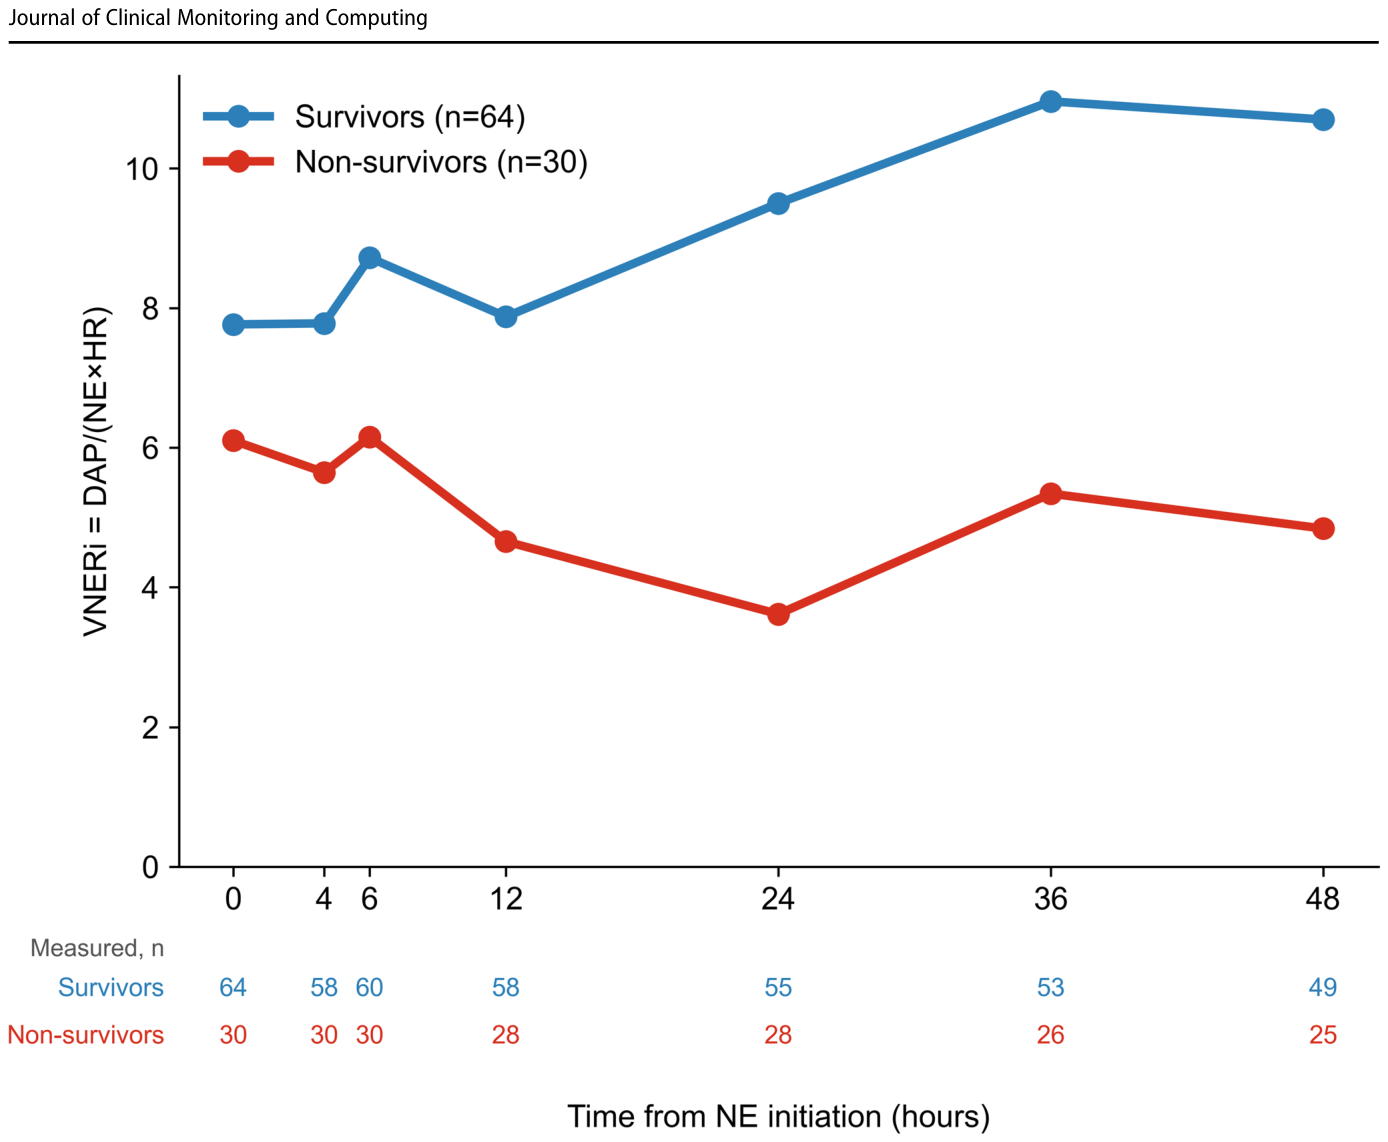
Figure 2. Fig. 2 Median VNERi over the first 48 h in survivors and non-survi vors. Points show the median VNERi at each scheduled time point for survivors (n = 64) and non-survivors (n = 30). VNERi is the diastolic arterial pressure (DAP) divided by the product of the norepinephrine解説: この図は、生存者(青線、n=64)と非生存者(赤線、n=30)における最初の48時間のVNERi中央値の推移を示しています。VNERiは拡張期動脈圧をノルエピネフリン投与量と心拍数の積で割った値です。ベースラインでは両群の値が重なっていますが、時間が経つにつれて生存者のVNERi値が上昇し、非生存者の値は低いままで推移することで両群が分離していることが見て取れます。
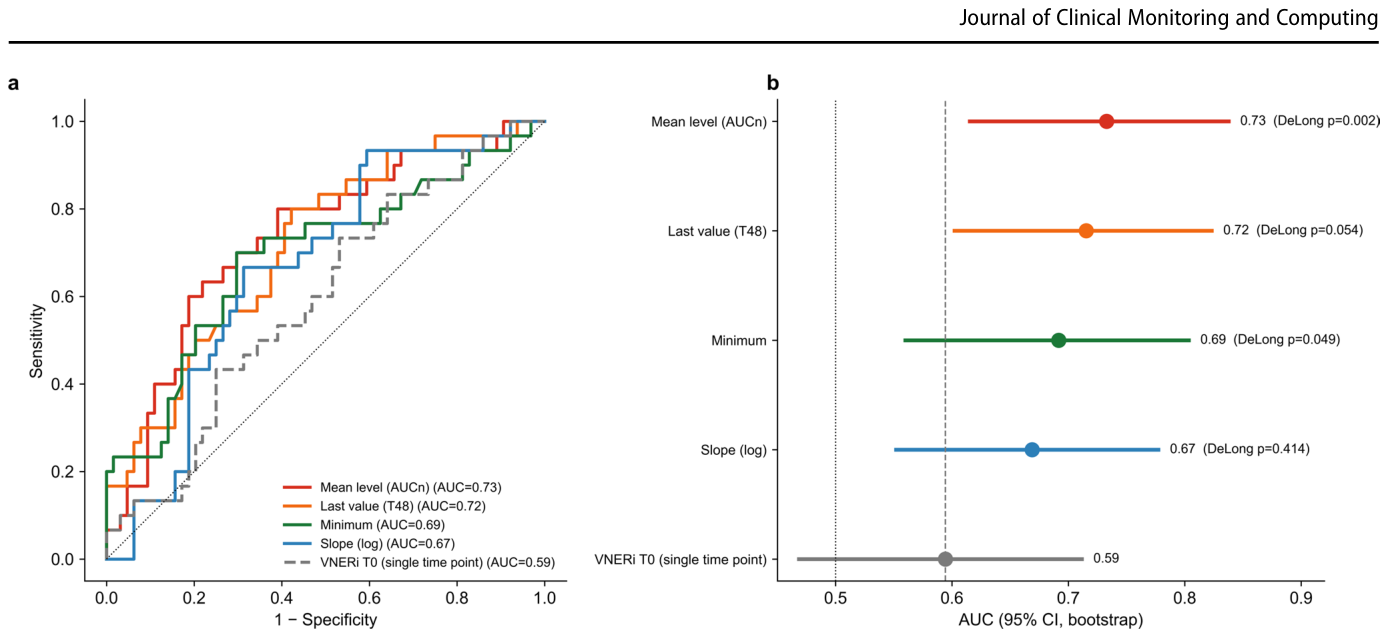
Figure 3. Fig. 3 Discrimination of the baseline versus the trajectory VNERi parameters for 28-day mortality. (a) Receiver operating characteristic (ROC) curves for the baseline value (T0) and the trajectory param eters. (b) The area under the ROC curve (AUC) with its bootstrap 95% confidence interval (CI), and the DeLong p value for the comparison解説: この図は、28日死亡率に対するVNERiのベースライン値と経時的パラメータの識別能を比較したものです。(a)は各パラメータの受信者動作特性(ROC)曲線を示しており、(b)はAUC(ROC曲線下面積)と95%信頼区間、およびベースライン値に対するDeLong検定のp値を示しています。単一のベースライン値(T0)は予後を分離しませんでしたが(AUC 0.59)、平均レベル(AUCn)が最も強い識別能(AUC 0.73)を示し、ベースラインより有意に優れていることがわかります。
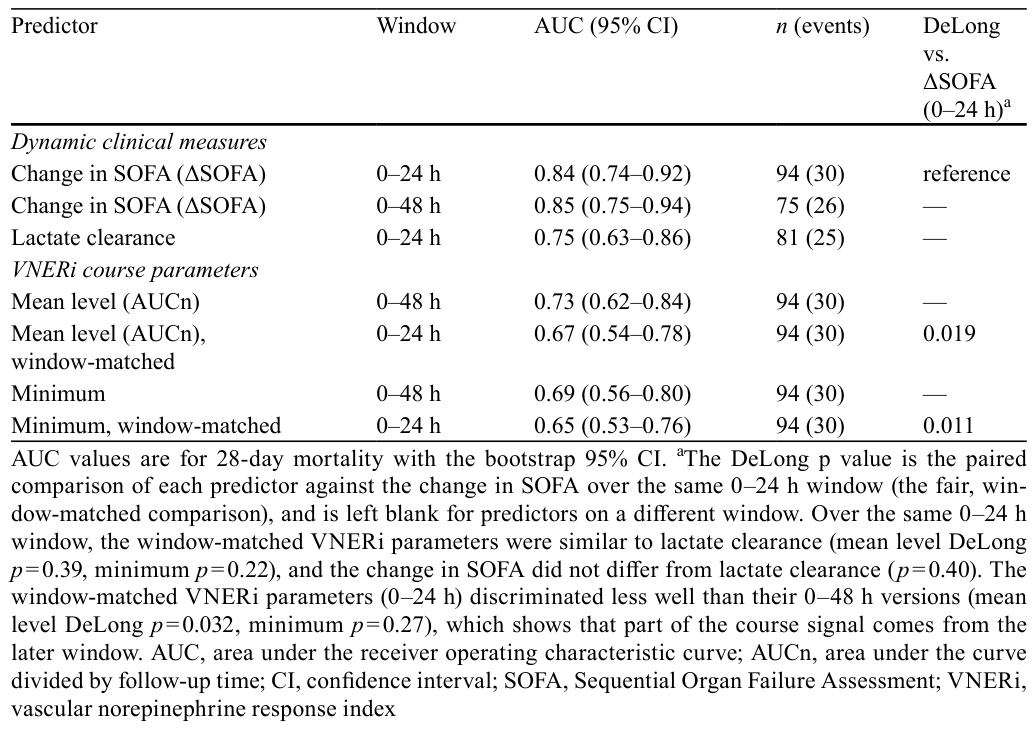
Table 2. Table 2 Head-to-head discrimina tion of the VNERi course param eters and the dynamic clinical measures for 28-day mortality解説: この表は、VNERiのコースパラメータと動的臨床指標(SOFAスコアの変化、乳酸クリアランス)の28日死亡率に対する識別能を比較したものです。SOFAスコアの変化(ΔSOFA)が0-24時間ウィンドウでAUC 0.84と最も優れた予測能を示しました。VNERiの平均レベル(AUCn)は0-48時間でAUC 0.73でしたが、ΔSOFAよりも劣る結果でした。ウィンドウマッチさせたVNERiパラメータは、ΔSOFAと比較して有意に劣っていました。
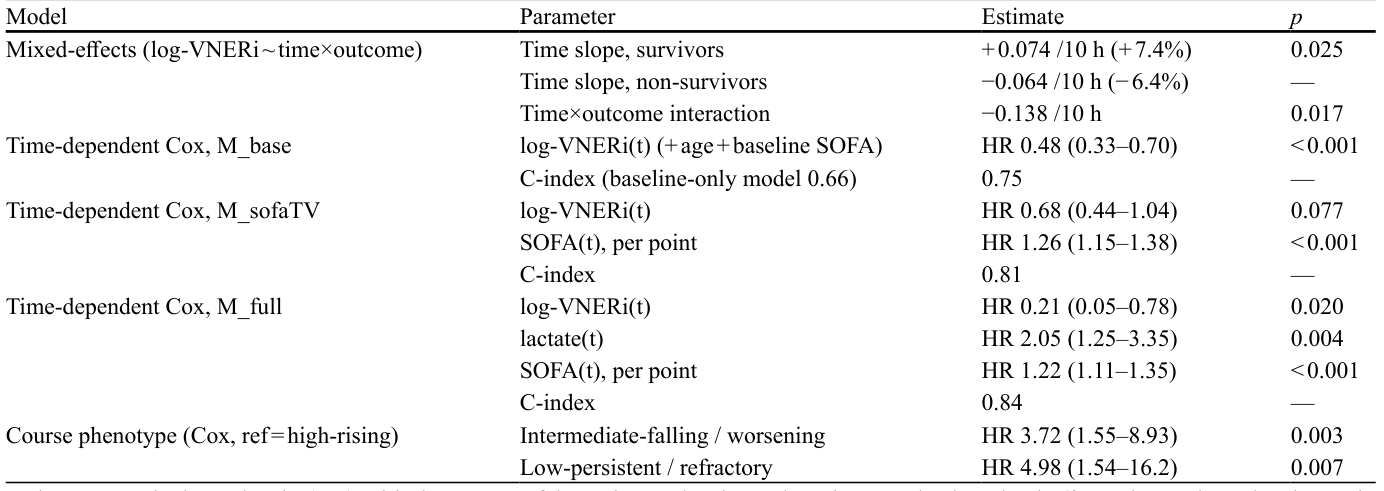
Table 3. Table 3 Longitudinal and time-dependent models of the VNERi course (mixed-effects model, time-dependent Cox regression, and phenotype Cox regression) Model Parameter Estimate p Mixed-effects (log-VNERi ~ time×outcome) Time slope, survivors + 0.074 /10 h (+ 7.4%) 0.025 Time slope, non-survivors −0.064 /10 h (− 6.4%) — Time×outcome interaction −0.138 /10 h 0.017 Time-dependent Cox, M_base log-VNERi(t) (+ age + baseline SOFA) HR 0.48 (0.33–0.70) < 0.001 C-index (baseline-only model 0.66) 0.75 — Time-dependent Cox, M_sofaTV log-VNERi(t) HR 0.68 (0.44–1.04) 0.077 SOFA(t), per point HR 1.26 (1.15–1.38) < 0.001 C-index 0.81 — Time-dependent Cox, M_full log-VNERi(t) HR 0.21 (0.05–0.78) 0.020 lactate(t) HR 2.05 (1.25–3.35) 0.004 SOFA(t), per point HR 1.22 (1.11–1.35) < 0.001 C-index 0.84 — Course phenotype (Cox, ref = high-rising) Intermediate-falling / worsening HR 3.72 (1.55–8.93) 0.003 Low-persistent / refractory HR 4.98 (1.54–16.2) 0.007 Estimates are the hazard ratio (HR) with the 95% confidence interval unless otherwise stated. The mixed-effects slopes show the change in log-VNERi per 10-hour increase. In the time-dependent Cox models the current VNERi was a time-varying covariate: M_base was adjusted for age and baseline SOFA(T0), M_sofaTV replaced this with the time-varying SOFA(t), and M_full further added the concurrent NE dose(t) and lactate(t). The proportional hazards assumption held in M_full (global Schoenfeld p = 0.15). C-index, Harrell concordance index; HR, hazard ratio; NE, norepinephrine; SOFA, Sequential Organ Failure Assessment; (t), time-varying covariate; VNERi, vascular norepinephrine response index解説: この表は、VNERiのコースに関する縦断的および時間依存性モデルの結果を示しています。混合効果モデルでは、生存者ではlog-VNERiが時間とともに上昇し、非生存者では低下しました。時間依存性Coxモデルでは、年齢とベースラインSOFAで調整したモデルではVNERi(t)が高いほど死亡リスクが低いと関連しましたが、時間変動SOFA(t)で調整すると非有意となりました。完全調整モデルでは再び有意な関連が見られました。コース表現型別のCox回帰では、中間から下降する群と低値で持続する群は、高値で上昇する群と比較して有意に高いハザード比を示しました。
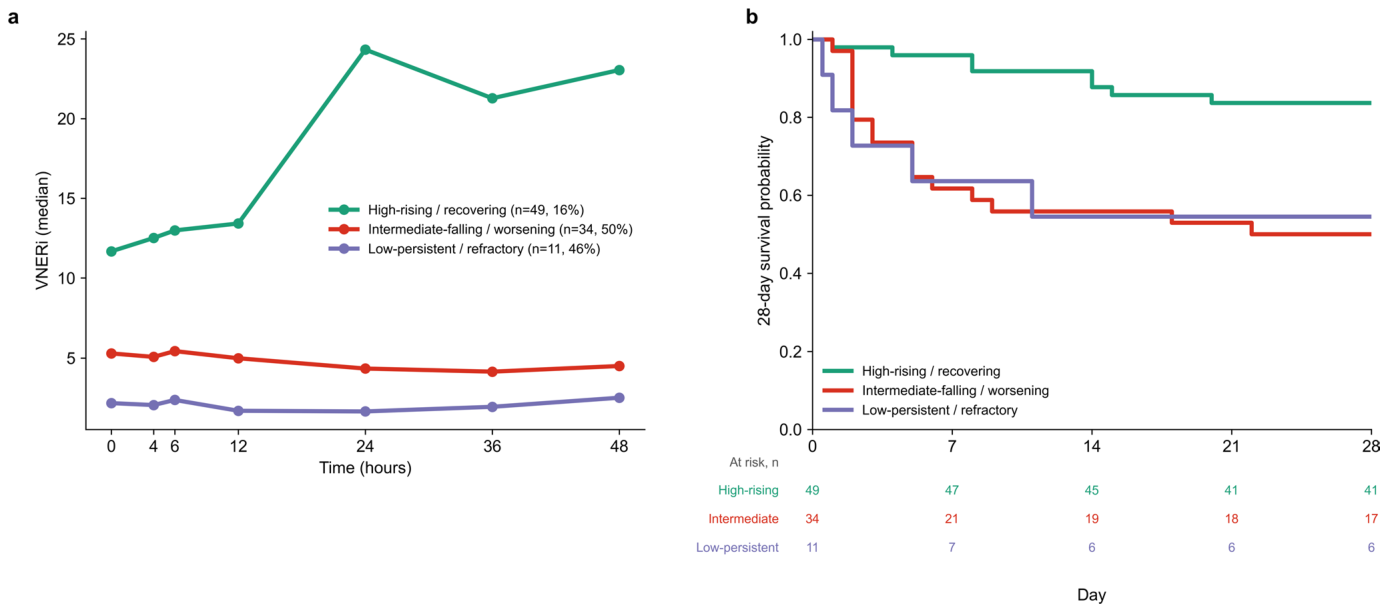
Figure 4. Fig. 4 VNERi course phenotypes and survival. (a) Median VNERi over the first 48 h for the three phenotypes from the latent class mixed model, each named by the direction of its course: high-rising or recovering (n = 49), intermediate-falling or worsening (n = 34), and解説: この図は、VNERiのコース表現型と生存率を示しています。(a)は潜在クラス混合モデルによって導出された3つの表現型(高値で上昇する群、中程度から下降する群、低値で持続する群)における最初の48時間のVNERi中央値の推移を示しています。それぞれの群には28日死亡率が記されています。(b)はこれらの表現型ごとの28日生存率のKaplan-Meier曲線で、表現型によって生存率が有意に分離されることを示しています(ログランク検定p=0.002)。

コメントを残す