どうも、Beyond the Pixelです。壊疽性胆嚢炎(GC)は、急性胆嚢炎の重篤な病型で、胆嚢壁の進行性虚血、壊死、さらには穿孔を特徴とします。これは全身性炎症反応症候群や敗血症を伴うことが多く、病状の進行が早く予後不良です。タイムリーな外科的介入がなければ、胆嚢穿孔、腹腔内感染、敗血症性ショックなどの深刻な結果を招く可能性があります。GCは急性胆嚢炎全体の約10%から40%を占めますが、術前の診断率は10%未満にとどまり、ほとんどの場合、術中の所見または術後の病理組織学的検査に依存しています。このような診断の遅れは、最適な治療機会の逸失だけでなく、手術の難易度や術後合併症のリスクを著しく増加させます。この未解決の臨床的課題に対処するため、この研究チームは、日常的に利用可能な術前変数を用いて、壊疽性胆嚢炎の早期予測を促進し、臨床意思決定を支援する解釈可能な機械学習(ML)モデルを開発しました。
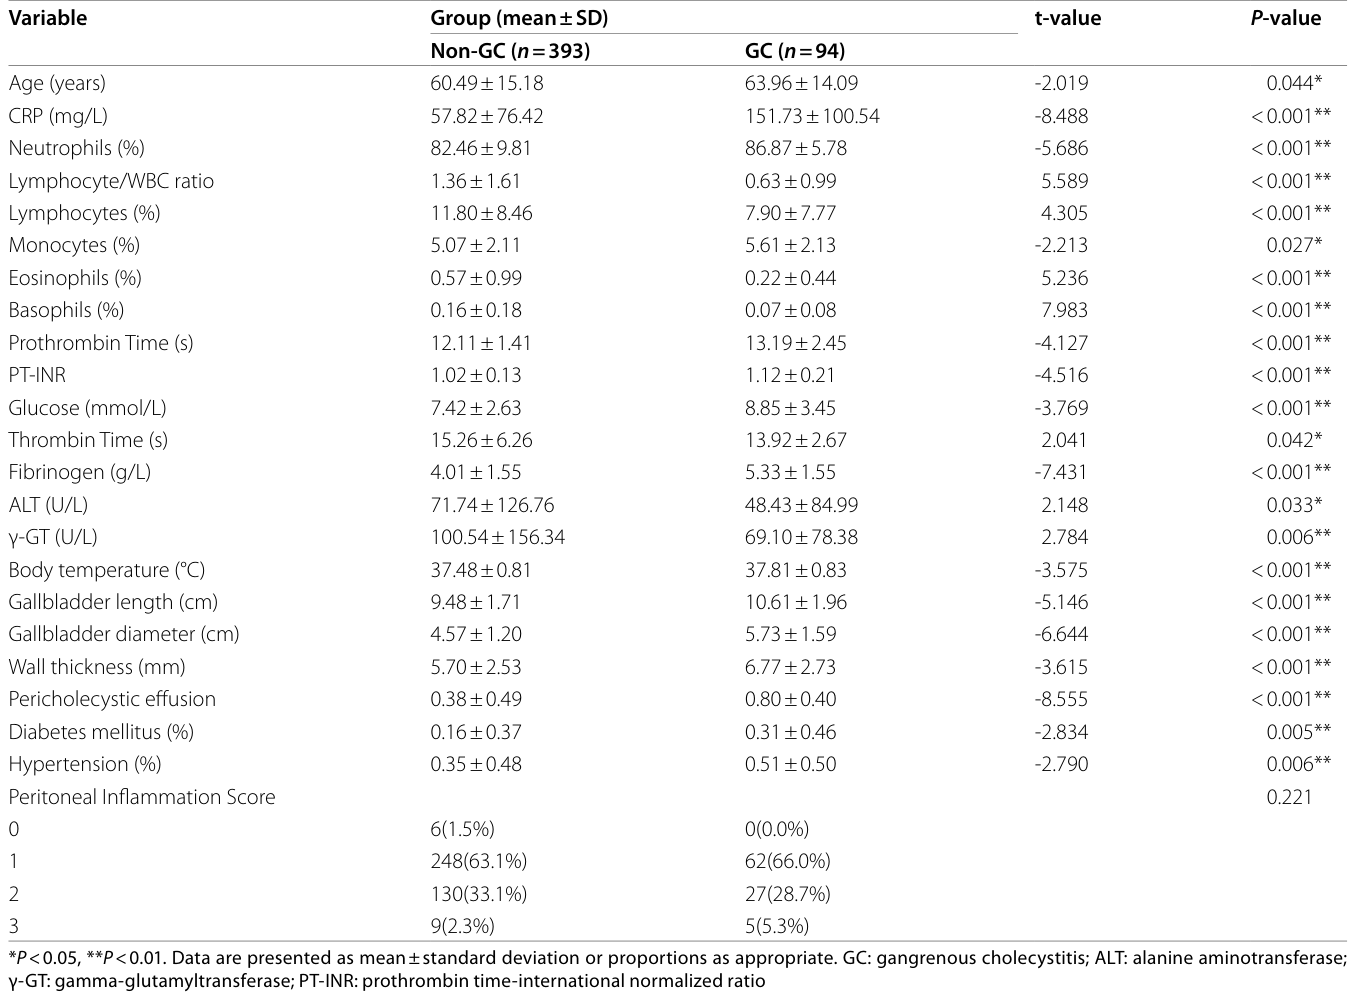
この研究は、上海交通大学医学院付属同仁病院で2020年2月から2023年7月にかけて腹腔鏡下胆嚢摘出術を受けた急性胆嚢炎の対象者487名を対象とした単一施設の後ろ向きコホート研究です。研究データは、術前の臨床特性、臨床検査、画像評価、術中記録、術後病理診断を含む包括的な臨床情報から収集されました。壊疽性胆嚢炎と病理学的に診断されたのは94症例(19.3%)でした。データの前処理、単変量解析、ロジスティック回帰に続き、LASSO回帰(Least Absolute Shrinkage and Selection Operator)という手法を用いて、重要な術前予測因子が選択されました。LASSO回帰は、L1正則化項を組み込むことで、自動的な変数選択を可能にし、多重共線性(複数の予測変数が互いに強く相関している状態)を効果的に処理し、過学習のリスクを軽減します。最終的に、術前のC反応性タンパク質(pre-CRP)、胆嚢径、胆嚢周囲滲出液、アルブミン(ALB)、好塩基球割合(BA)の5つの重要な術前予測因子が特定されました
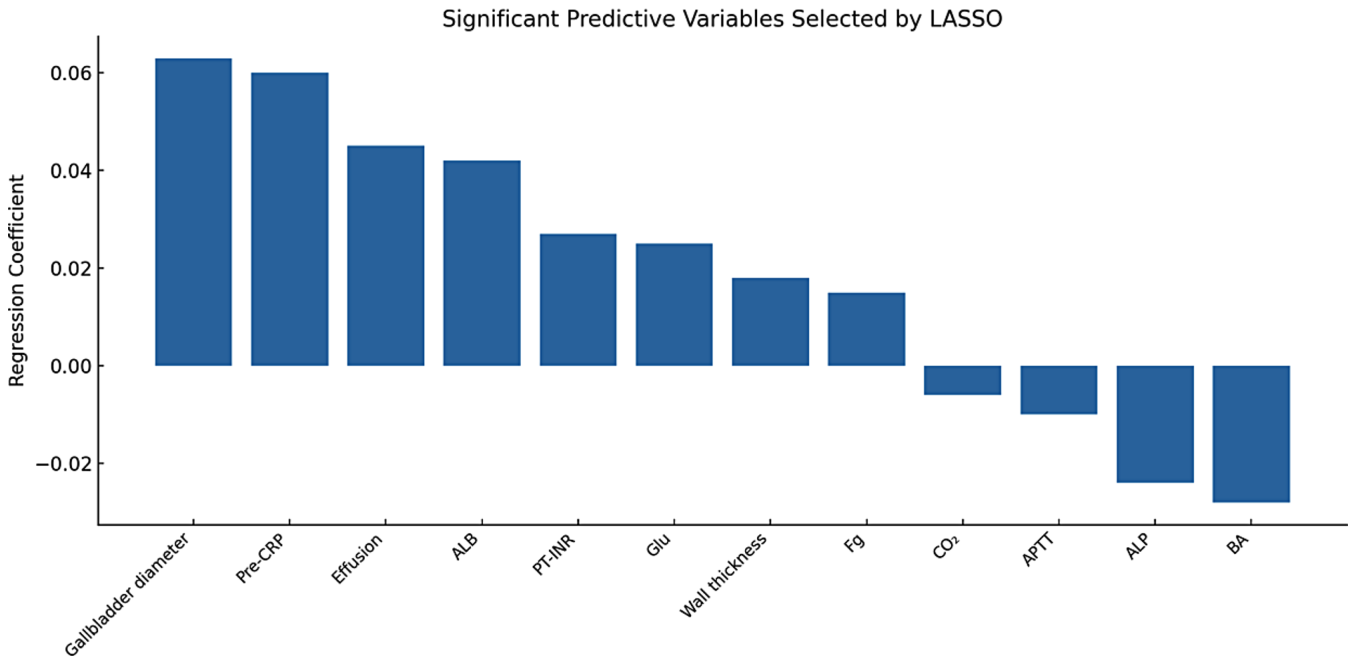
Figure 1. Fig. 1 Significant variables screened by LASSO regression analysis and distribution of their regression coefficients. The figure shows the standardised regression coefficients of each variable in the LASSO regression model. Variables with positive coefficients, such as gallbladder diameter, pre-CRP, and exudation, make a positive contribution to the model output, while variables with negative coefficients make a negative contribution解説: LASSO回帰分析によって選択された重要な予測因子とその回帰係数の分布を示します。胆嚢径、術前CRP、胆嚢周囲滲出液が正の係数を持つ最も影響力の大きい変数であり、壊疽性胆嚢炎のリスクとの強い正の関連を示しています。
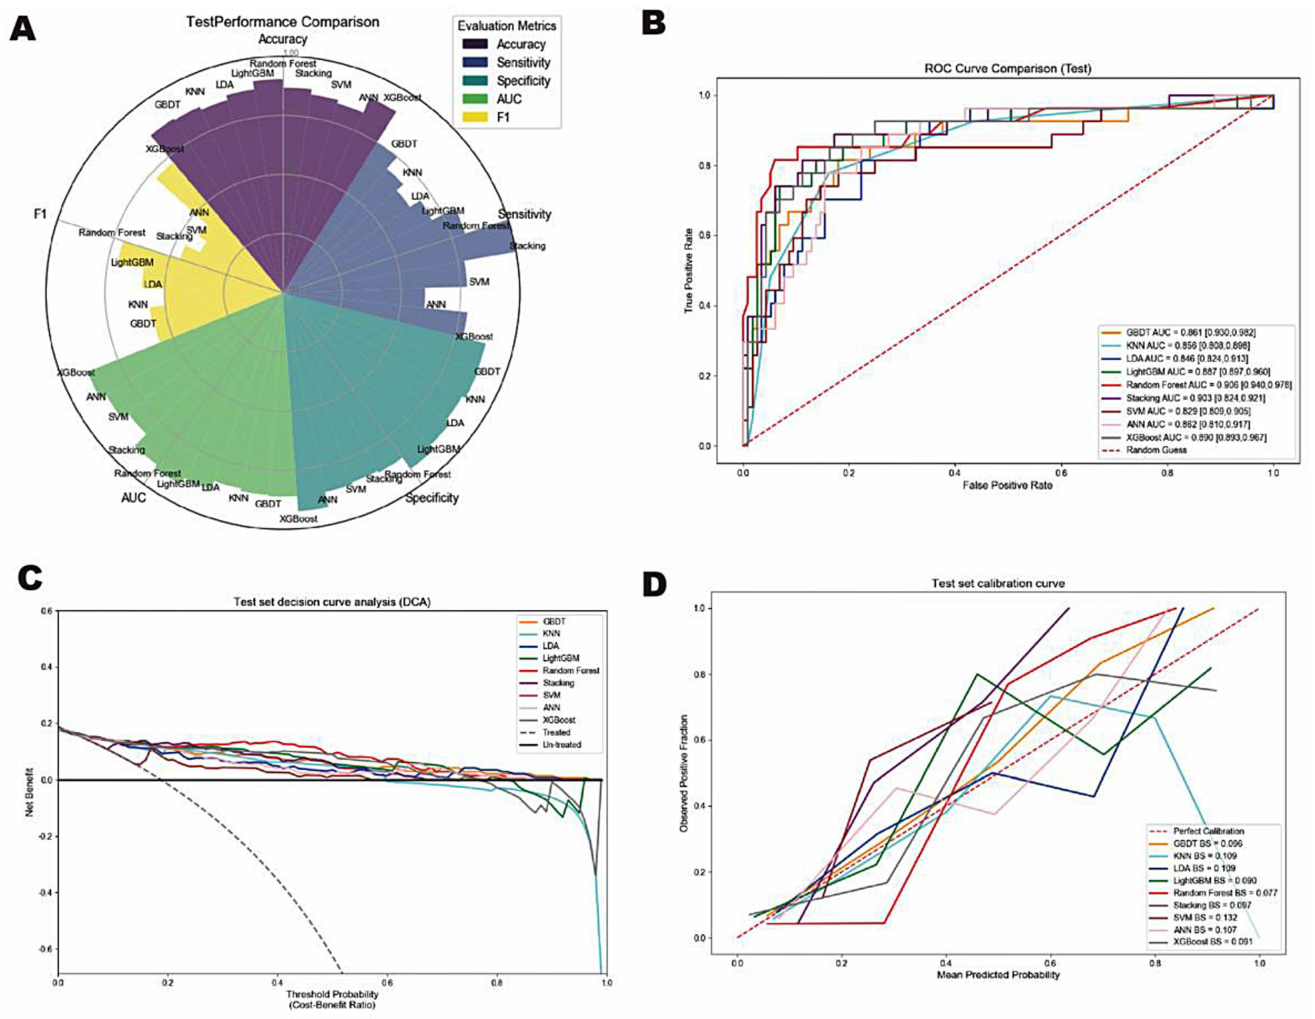
Figure 3. Fig. 3 Comparison of prediction results from nine models. A. Radar chart of different models under various performance metrics. The figure shows the performance of nine models in terms of accuracy, AUC, F1-score, and recall rate. The larger the area, the better the overall performance. B. Comparison of ROC curves of different models on the test set.A larger area under the curve (AUC) indicates stronger model recognition capability. C. Clinical decision curve (DCA) analysis for each model. The larger the net benefit shown within the threshold interval, the stronger the clinical utility. D. Comparison of calibration curves for each model. Lower values indicate that the predicted probability is highly consistent with the actual results, indicating high model prediction reliability解説: 9種類の機械学習モデルの予測結果を比較しています。Aは精度、AUC、F1スコア、リコール率(感度)に関する各モデルの性能をレーダーチャートで示し、面積が大きいほど全体的な性能が良好であることを意味します。Bはテストセットにおける異なるモデルのROC曲線を比較し、AUC値が大きいほどモデルの識別能力が高いことを示しています。Cは各モデルの臨床決定曲線分析(DCA)であり、閾値区間内で示される純利益が大きいほど臨床的有用性が高いことを示しています。Dは各モデルのキャリブレーション曲線で、予測確率と実際の発生率の一致度を示しています。
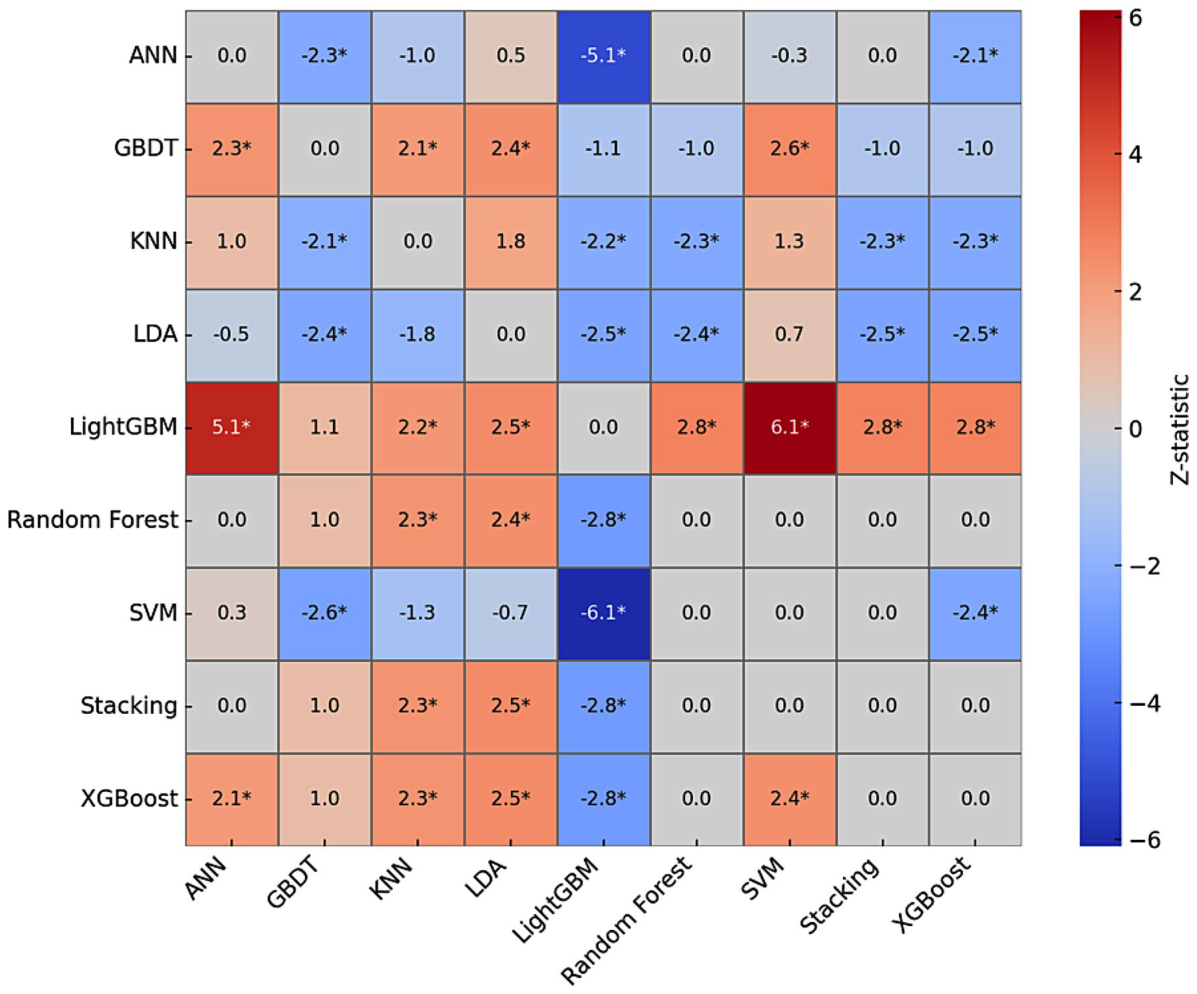
Figure 5. Fig. 5 Heat map of AUC differences between nine prediction models. Differences in Z-test values between models. Each cell in the figure represents the Z-test statistic between two models. The deeper the red, the more significant the left model is than the model below it, and the opposite is true for blue. The larger the Z-value, the more significant the difference. The diagonal line represents self-comparison解説: 9種類の予測モデル間のAUC値の差を示すヒートマップです。各セルは2つのモデル間のZ検定統計量を示し、色が濃い赤色であるほど、Y軸上のモデルがX軸上のモデルよりも有意に高いAUC値を示し、青色はその逆を示します。Z値が大きいほど、差はより有意であることを意味します。
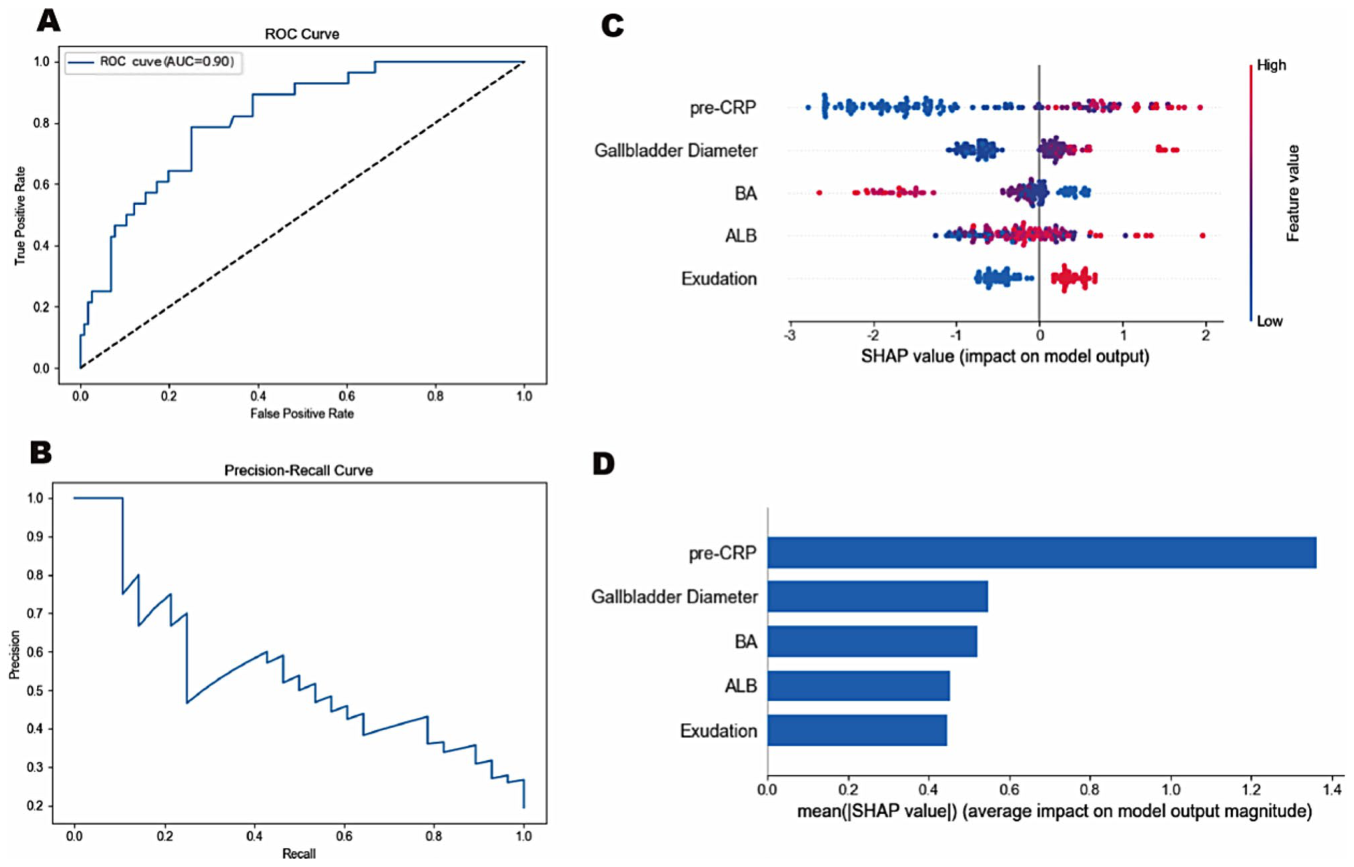
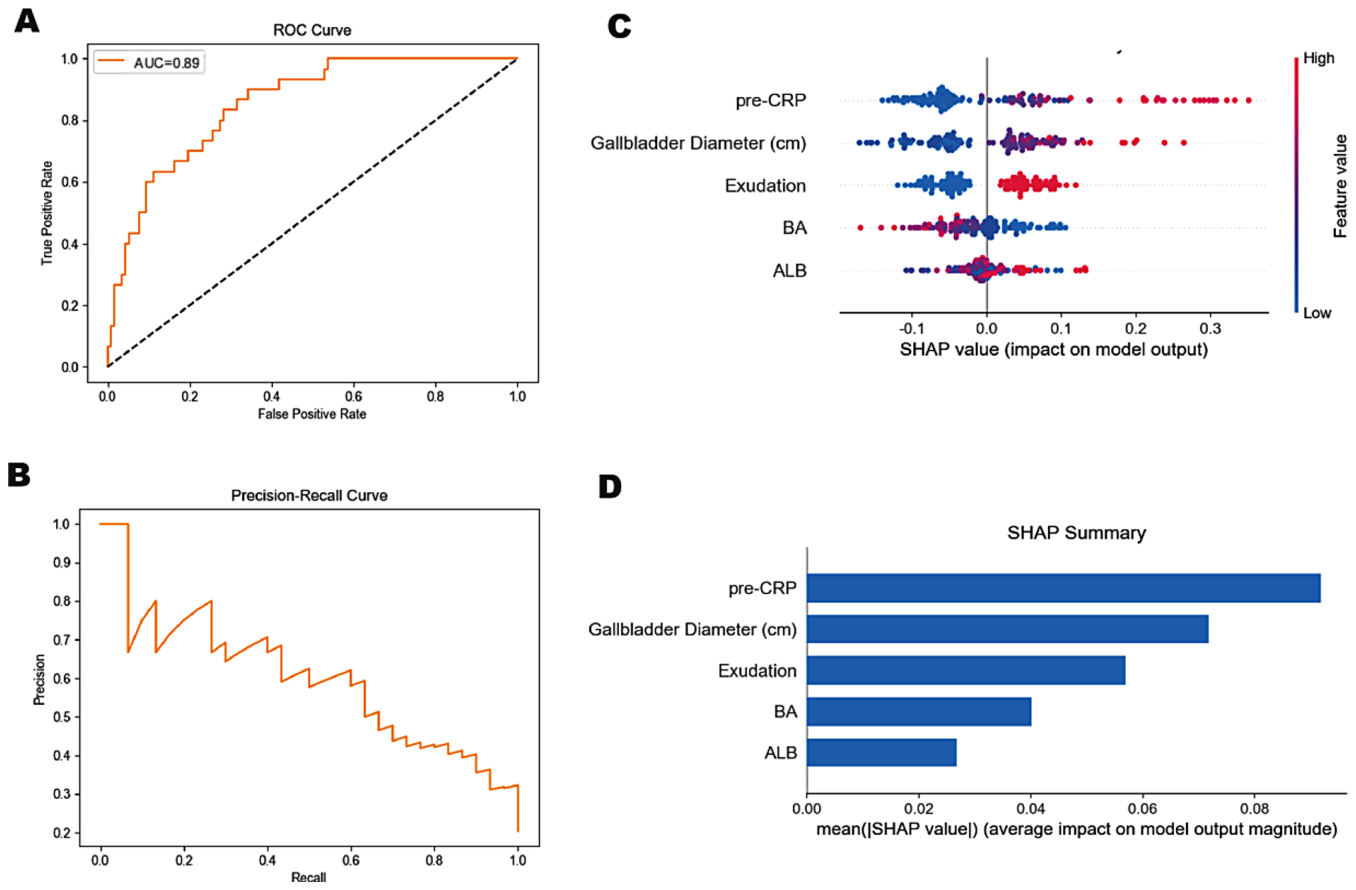
Figure 6. Fig. 6 Performance evaluation and interpretability analysis of the XGBoost model for predicting GC. A. ROC curve of the XGBoost model, showing an AUC of 0.90, indicating good discriminative performance in distinguishing GC from non-GC patients. B. PR curve demonstrating that the model maintains relatively high precision across low-to-moderate recall levels, which is desirable for clinical screening tasks. C SHAP summary plot illustrating the contri bution of each feature to the model’s output. Higher CRP and gallbladder diameter values were strongly associated with increased GC risk, while lower albumin levels and the presence of exudation also contributed positively to risk prediction. BA showed bidirectional effects, possibly reflecting underlying interactions. D Bar plot of mean absolute SHAP values, ranking feature importance in descending order. CRP emerged as the most influential predictor, followed by gallbladder diameter and BA解説: XGBoostモデルの性能評価と解釈可能性分析を示します。AはXGBoostモデルのROC曲線で、AUCは0.90であり、GCと非GCの識別において良好な性能を示しています。BはPR曲線で、モデルが低から中程度の再現率(リコール)レベルで比較的高精度の維持を示しており、臨床スクリーニングタスクに適しています。CはSHAPサマリープロットで、各特徴のモデル出力への寄与を示し、pre-CRPと胆嚢径の値が高いほどGCリスク増加と強く関連し、アルブミンレベルが低いことや滲出液の存在もリスク予測に寄与しています。Dは平均絶対SHAP値の棒グラフで、特徴の重要度を降順に示し、pre-CRPが最も影響力のある予測因子であることが示されています。Figure 7. Fig. 7 Performance evaluation and SHAP-based interpretability analysis of the Random Forest model. A. ROC curve of the Random Forest model showing an AUC of 0.89. B. PR curve demonstrating that the model maintains moderate to high precision (> 0.5) at recall levels up to 0.5. C. SHAP summary plot illustrating the contribution of each feature to the model’s output for individual predictions. D. SHAP bar chart showing the mean absolute SHAP values, quantifying the average importance of each feature解説: ランダムフォレストモデルの性能評価とSHAPに基づく解釈可能性分析を示します。AはランダムフォレストモデルのROC曲線で、AUCは0.89です。BはPR曲線で、再現率(リコール)が0.5までの範囲で中程度から高精度(0.5以上)を維持していることを示しています。CはSHAPサマリープロットで、各特徴が個々の予測にどのように寄与するかを示し、pre-CRPと胆嚢径が最も影響力のある陽性予測因子であることがわかります。DはSHAP棒グラフで、各特徴の平均的な重要度を定量化した平均絶対SHAP値を示しています。
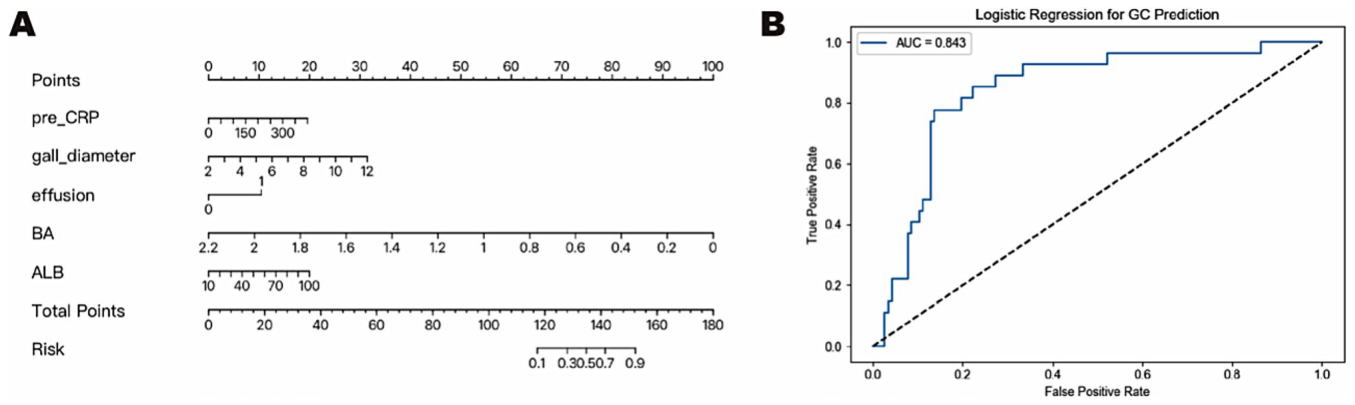
Figure 2. Fig. 2 Prediction results of the logistic regression model. A. Nomogram for predicting gangrenous cholecystitis constructed using the logistic regression model. The nomogram is based on CRP, gallbladder diameter, exudation, BA, and ALB.The upper axis represents the scores (Points) corresponding to each variable, the middle axis represents the range of each variable, and the lower axis represents the mapping relationship between the total score and the corresponding risk probability. B. ROC curve of the logistic model. The receiver operating characteristic curve shows an AUC of 0.84, with the false positive rate (specificity) on the horizontal axis and the true positive rate (sensitivity) on the vertical axis解説: ロジスティック回帰モデルによる予測結果を示します。Aは壊疽性胆嚢炎予測のためのノモグラムであり、CRP、胆嚢径、滲出液、BA、ALBの5つの予測変数が含まれています。各変数の値から点数を取得し、合計点数から壊疽性胆嚢炎の推定確率が導き出されます。BはロジスティックモデルのROC曲線で、AUC値は0.84であり、良好な全体的予測性能を示しています。
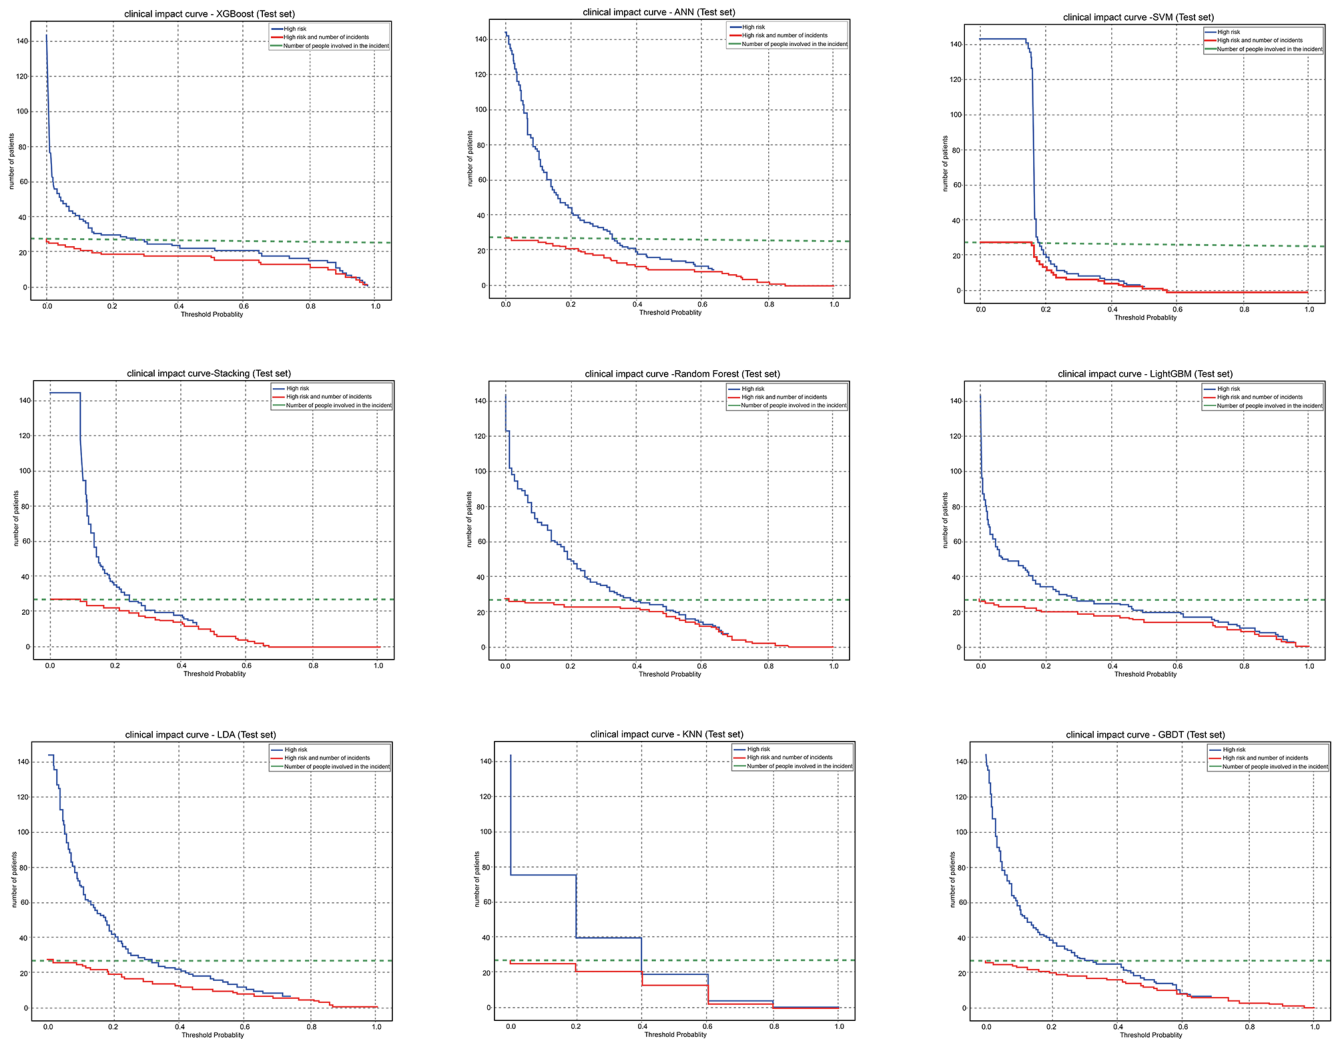
。臨床インパクト曲線も様々な閾値でモデルの有効性を示しています
Figure 4. Fig. 4 CIC of nine classification models on the test set. The horizontal axis represents the risk prediction probability threshold, and the vertical axis repre sents the number of samples. The blue curve indicates the number of patients predicted by the model as high-risk (positive), the red curve indicates the number of patients who were actually diagnosed with gangrenous cholecystitis (GC), and the green dashed line serves as the reference line for the total number of actual GC patients. The closer the red line is to the blue line, the lower the model’s false positive rate; the higher the overall position of the red line, the more effectively the model captures high-risk patients解説: テストセットにおける9種類の分類モデルの臨床インパクト曲線(CIC)を示します。横軸はリスク予測確率の閾値、縦軸は対象者数です。青い曲線はモデルが高リスク(陽性)と予測した対象者数、赤い曲線は実際に壊疽性胆嚢炎と診断された対象者数、緑色の破線は実際のGC対象者総数の参照線です。赤い線が青い線に近いほどモデルの偽陽性率が低く、赤い線が全体的に高い位置にあるほどモデルが高リスク対象者を効果的に捕捉していることを示します。

コメントを残す