どうも、Beyond the Pixelです。嚥下(えんげ)は、食べ物や飲み物を口から胃へ運ぶ複雑な機能であり、脳の広範なネットワークによって制御されています。このネットワークが機能不全に陥ると、嚥下障害(嚥下困難)が生じ、脳卒中などの神経疾患の一般的な合併症として、肺炎や栄養失調などの重篤な問題を引き起こし、対象者の生活の質と医療コストに大きな影響を与えます。
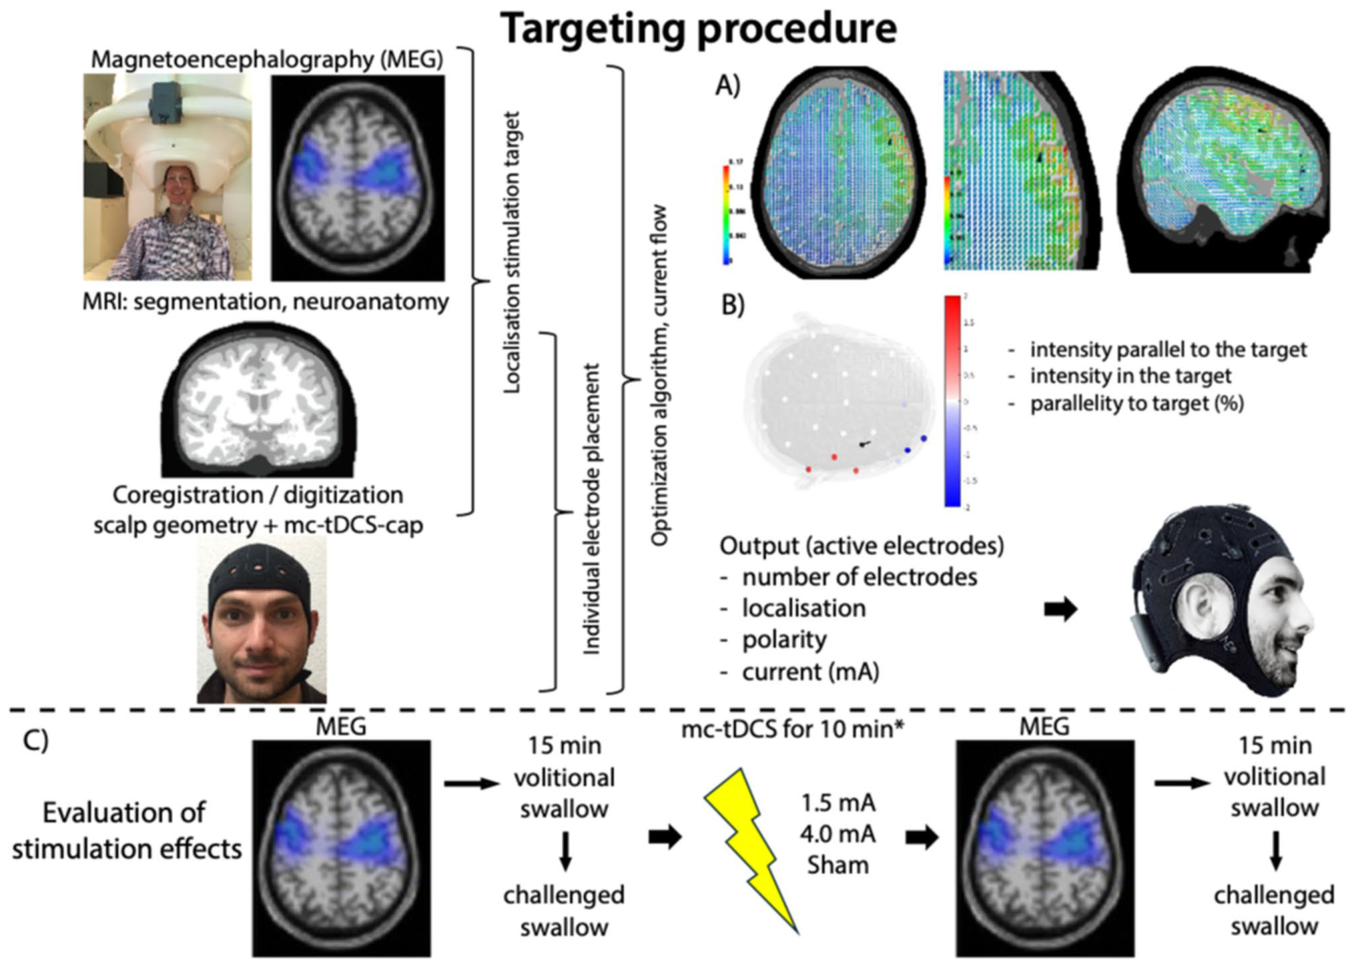
Figure 1. Fig. 1 Experimental workflow for individualized multichannel tDCS targeting and network-level assessment (A) Swallowing-related cortical activity was recorded using magnetoencephalography (MEG) during voluntary uncued swallowing. Source reconstruction was used to identify the individual cortical swallowing target. (B) Individualized multichannel tDCS (mc-tDCS) montages were optimized based on subject-specific anatomical MRI and finite ele ment modeling using a distributed constrained maximum intensity (D-CMI) approach. (C) Participants underwent three randomized stimulation sessions (low-intensity mc-tDCS, high-intensity mc-tDCS, sham). Swallowing-related cortical activity was assessed before and after stimulation using MEG during uncued and challenged swallowing tasks解説: (A) 嚥下関連の皮質活動がMEGで記録され、個別の皮質嚥下ターゲットを特定するためにソース再構成が使用されます。(B) 対象者固有のMRIと有限要素モデリングに基づき、D-CMIアプローチを使用して個別化されたmc-tDCS電極配置が最適化されます。(C) 参加者は無作為化された3つの刺激セッション(低強度mc-tDCS、高強度mc-tDCS、シャム)を受け、刺激前後にMEGを用いて嚥下関連の皮質活動が評価されます。この図は、個別化された多チャンネルtDCSのターゲット設定とネットワークレベルの評価のための実験ワークフローを示しています。
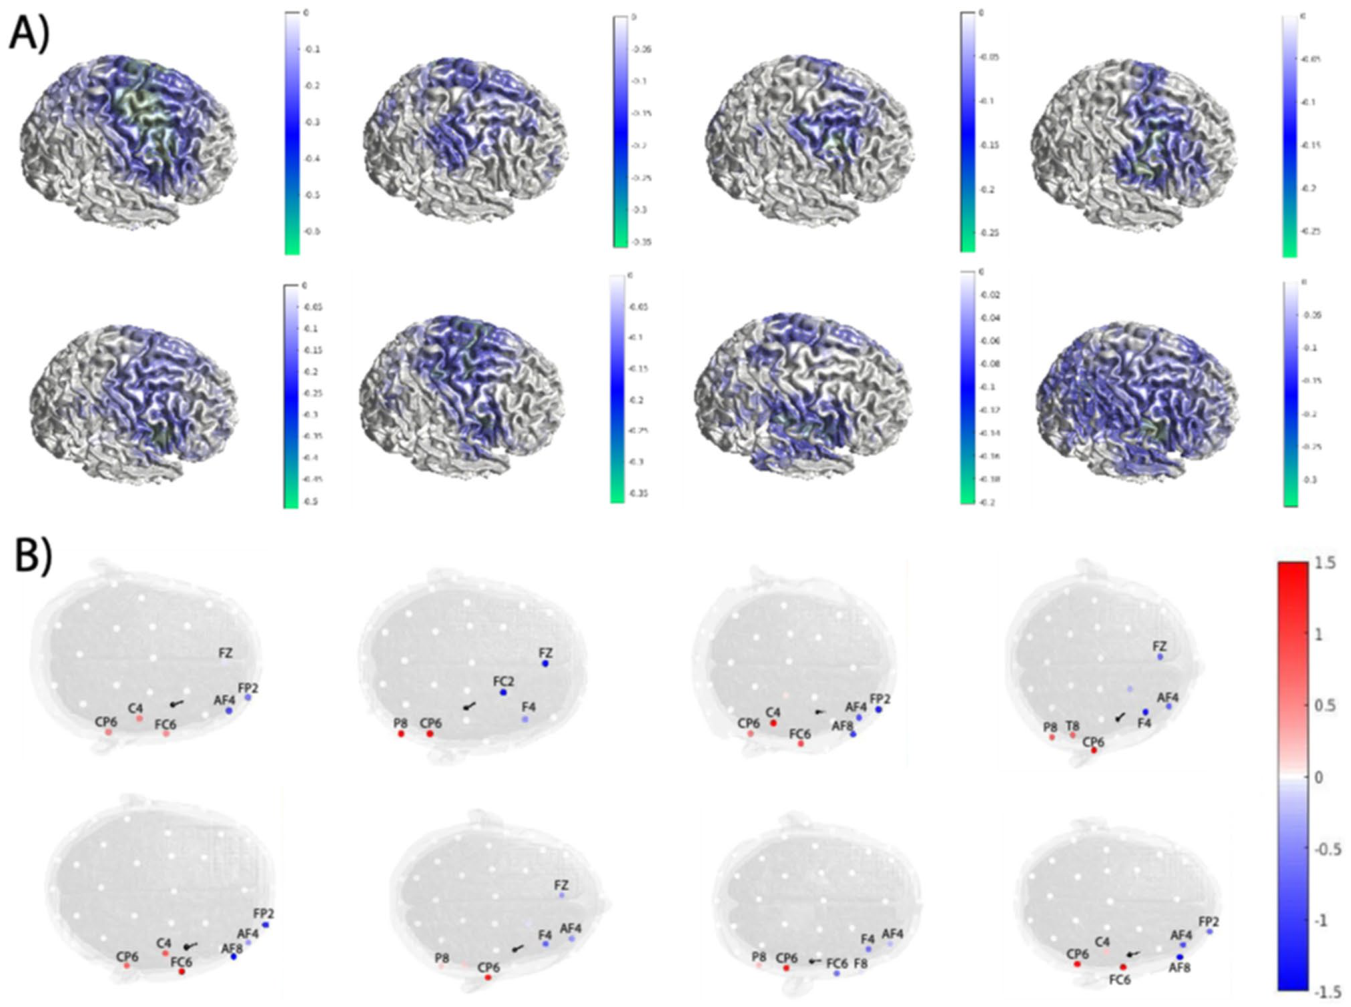
Figure 2. Fig. 2 Individualized targeting and multichannel tDCS montage optimization. (A) Individual MEG source reconstructions illustrating swallowing-related cortical activity during uncued swallowing (β frequency band) in the right hemisphere for each participant. These activity patterns were used to identify the individual target region within the cortical swallowing network. (B) Individually optimized multichannel tDCS electrode montages derived using the distributed constrained maximum intensity (D-CMI) approach for each participant. Electrode positions are shown on the stimulation cap. Colors indicate electrode polarity (anodal: red; cathodal: blue), and color intensity reflects the applied current strength (mA) at each electrode. The visualization illustrates the inter-individual variability of optimized montages while maintaining consistent targeting of the swallowing-related cortical region解説: (A) 各参加者の右半球におけるキューなし嚥下中の嚥下関連皮質活動(β周波数帯域)を示す個別のMEGソース再構成図。これらの活動パターンは、皮質の嚥下ネットワーク内の個別のターゲット領域を特定するために使用されました。(B) 各参加者について、D-CMIアプローチを用いて導き出された個別に最適化された多チャンネルtDCS電極配置。電極の位置は刺激キャップ上に表示され、色は電極の極性(陽極:赤、陰極:青)、色の濃さは各電極に印加された電流強度(mA)を示します。この図は、嚥下関連の皮質領域の一貫したターゲティングを維持しつつ、最適化された電極配置の個人差を示しています。
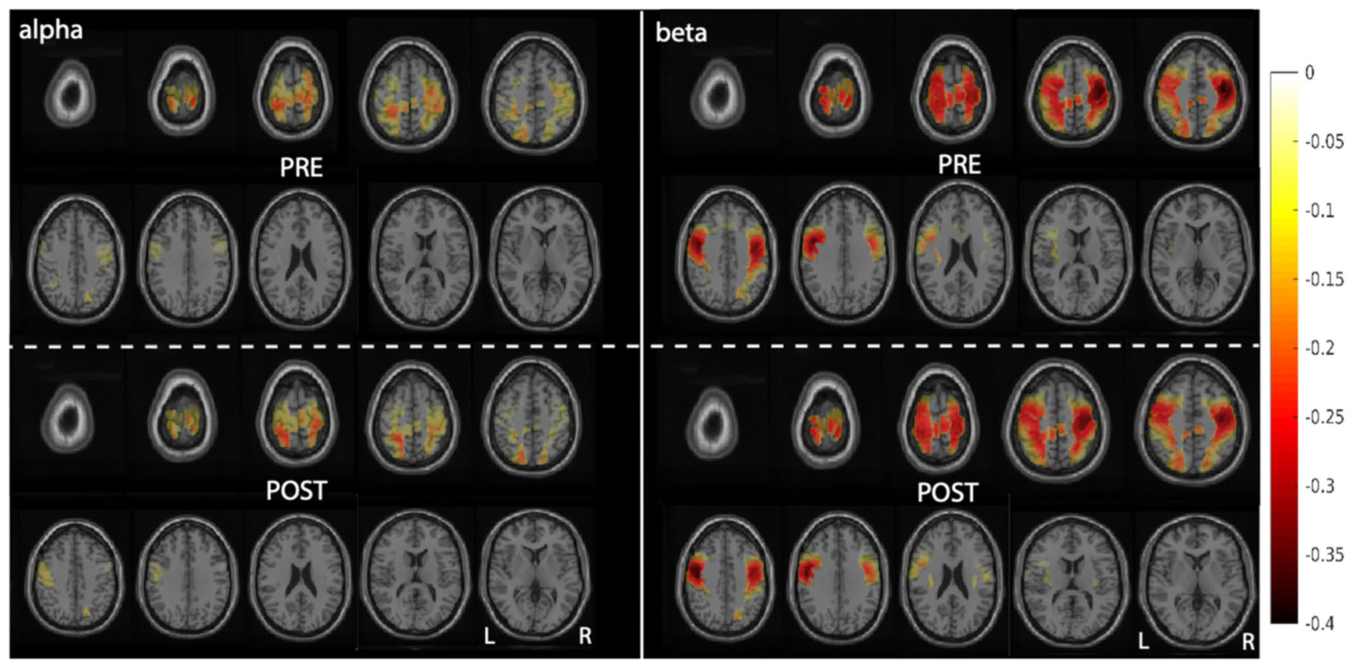
Figure 3. Fig. 3 Grand average swallowing-related ERD maps during challenged swallowing (α and β bands). Grand average MEG-derived event-related desyn chronization (ERD) maps are shown before (pre) and after (post) low-intensity mc-tDCS during the challenged swallowing task for the α (left) and β (right) frequency bands. The original 10-mm ROI analyses yielded significant clusters in both bands (α p = 0.025; βp = 0.048; cluster-based permutation testing within the predefined swallowing network). The maps demonstrate the spatial expression of these frequency-specific within-condition responses; the formal analysis did not confirm a difference between doses or tasks. Statistical cluster maps are shown in the Supplementary Material. Color coding indi cates ERD magnitude. L = left hemisphere; R = right hemisphere解説: 課題嚥下中のアルファ帯域(左)とベータ帯域(右)における、低強度mc-tDCS適用前(PRE)と適用後(POST)の平均MEG由来事象関連脱同期(ERD)マップ。ROI解析では、両帯域で有意なクラスターが検出されました(α p=0.025; β p=0.048)。このマップは、これらの周波数特異的な条件内応答の空間的分布を示していますが、正式な分析では刺激量や課題間の差は確認されていません。色分けはERDの大きさを表します。L=左半球、R=右半球。
コメントを残す