どうも、Beyond the Pixelです。脳の構造は加齢とともに複雑な変化を遂げ、脳の生物学的年齢は実年齢と異なる場合があります。この差は「脳年齢ギャップ(BAG)」と呼ばれ、神経保護および神経毒性プロセスの累積的な影響を定量化する、臨床的に意味のある指標となります。BAGの正確な推定は、軽度認知障害(MCI)や認知症のような神経変性疾患の早期リスク層別化、疾患進行の予後評価とモニタリング、治療効果の定量的評価、臨床試験における対象者の選定などに役立つ可能性があります。これまでの脳年齢推定モデルでは、畳み込みニューラルネットワーク(CNN)が一般的に利用されてきましたが、脳の微妙な局所的変化を見落とす可能性がありました。また、トランスフォーマーベースのモデルも導入されてきましたが、人口統計学的および撮像プロトコルの多様性に対する汎用性の不足が課題として残っていました。
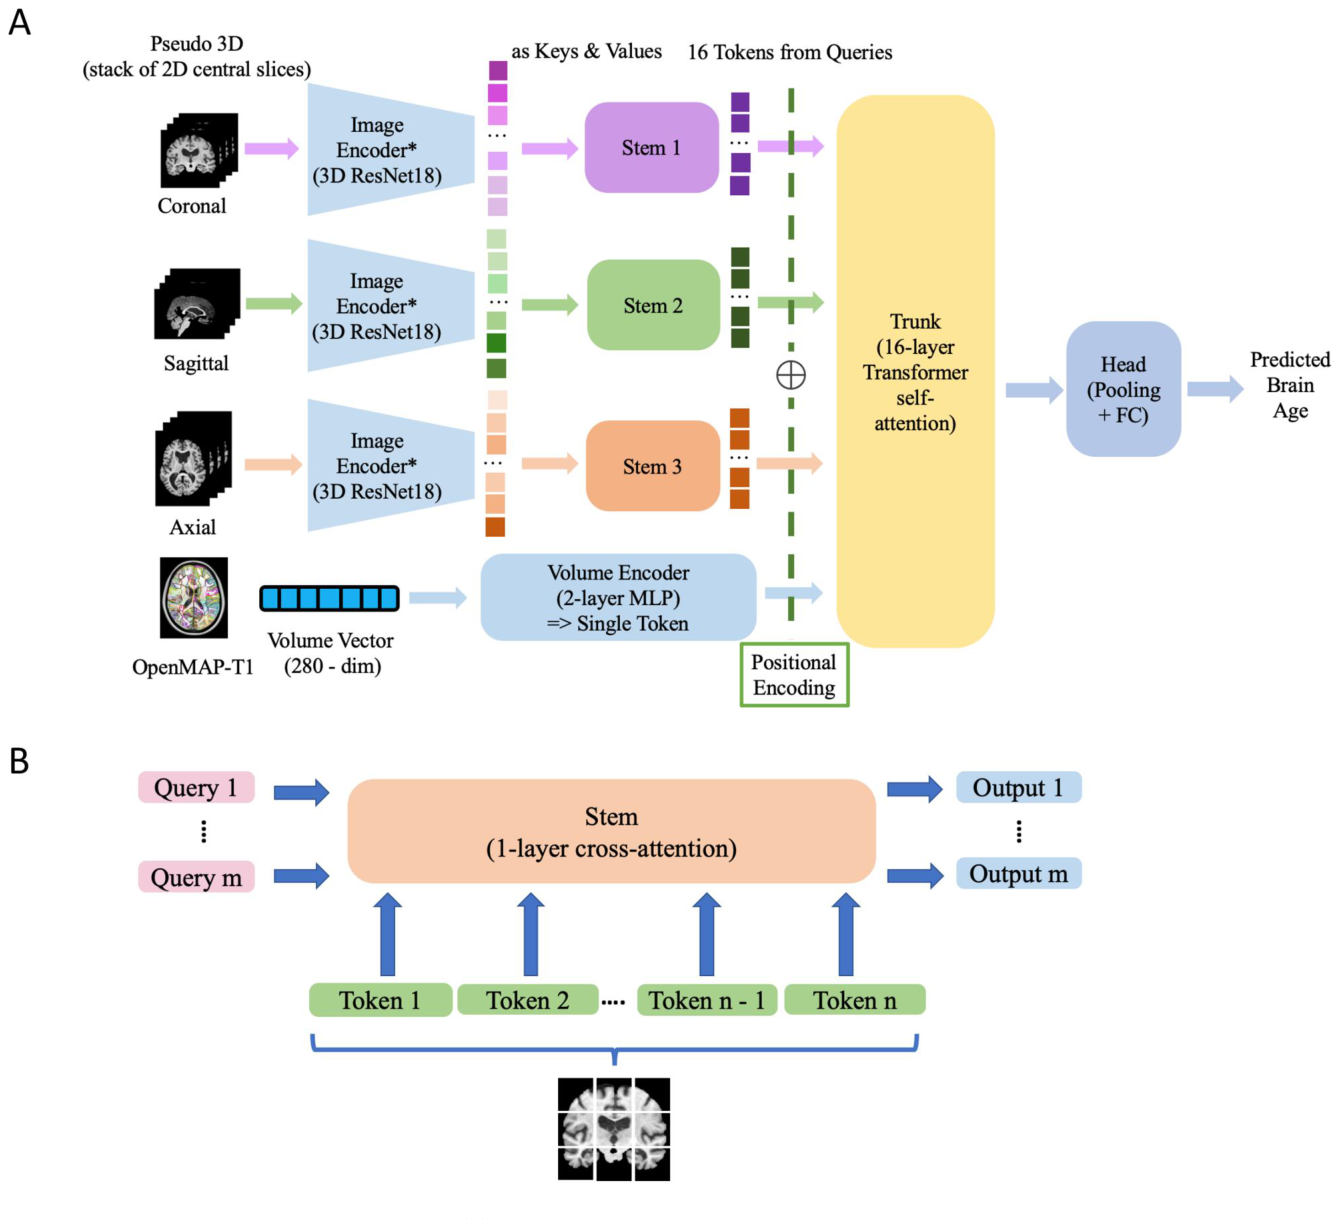
Figure 1. Figure 1 Architecture design of OpenMAP-BrainAge. (A) OpenMAP-BrainAge. The model takes pseudo 3D T1-weighted brain MRI representations constructed from central 30 slices in each of 3 anatomical views (image data) and quantitative 280 volumetric features extracted from whole-brain parcellation using OpenMAP-T114 (numerical data). A shared image encoder (*) extracts spatial features from each view, which are compressed by view-specific stem modules. A transformer trunk integrates embeddings across views and volumetric information, and the head predicts biological age. FC denotes a fully connected layer; MLP denotes multilayer perceptron. (B) Stem architecture. Stem module introduces a fixed number m of learnable queries (much fewer than the number n of tokens from the image input), as following Wang et al.13 Then, we capture the relationship between these learnable queries and the keys from the input through cross-attention to generate embeddings for the input. This design reduces the image input to a fixed dimensional representation and lowers computational complexity from quadratic to linear with respect to the size of input.解説: OpenMAP-BrainAgeのモデル構造を示しています。T1強調MRI画像から得られる3つの解剖学的視点(冠状断、矢状断、軸状断)の疑似3次元データと、OpenMAP-T1で280の脳領域に分割した体積データが入力として使われます。これらの情報はエンコーダーとステムモジュールを通り、トランスフォーマートランクで統合され、最終的に脳年齢が予測されます。ステムモジュールは、計算コストを削減しつつ、画像入力から固定次元の表現を生成する仕組みです。
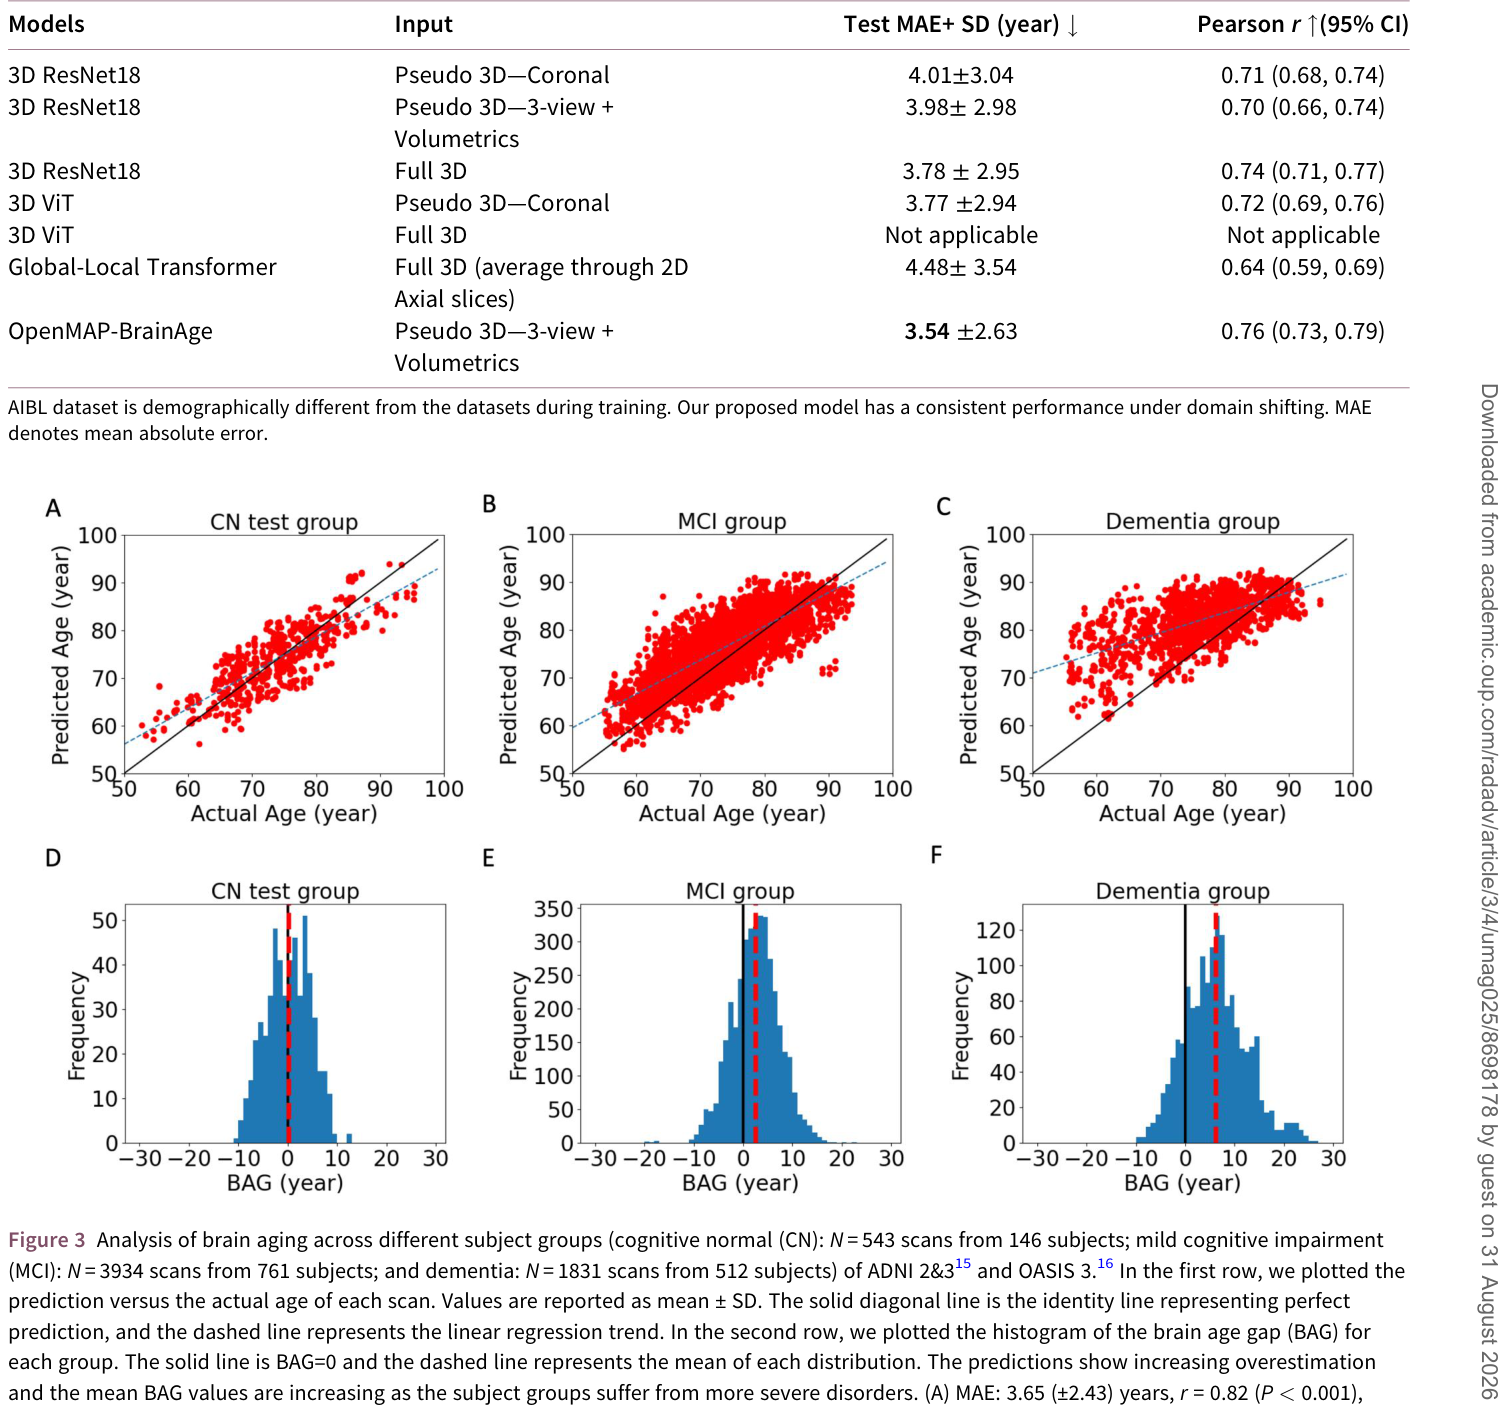
Table 3. Table 3 Model comparison on brain age prediction in cognitive normal (CN) group of the AIBL dataset (N = 648 scans from 275 subjects).17解説: AIBLデータセット(独立した外部コホート)における、様々なモデルの脳年齢予測性能の比較です。OpenMAP-BrainAgeは、平均絶対誤差(MAE)3.54年、ピアソン相関係数r=0.76と、トレーニング時に使用したデータセットと地理的に異なるデータセットにおいても、高い汎用性と一貫した性能を維持していることを示しています。
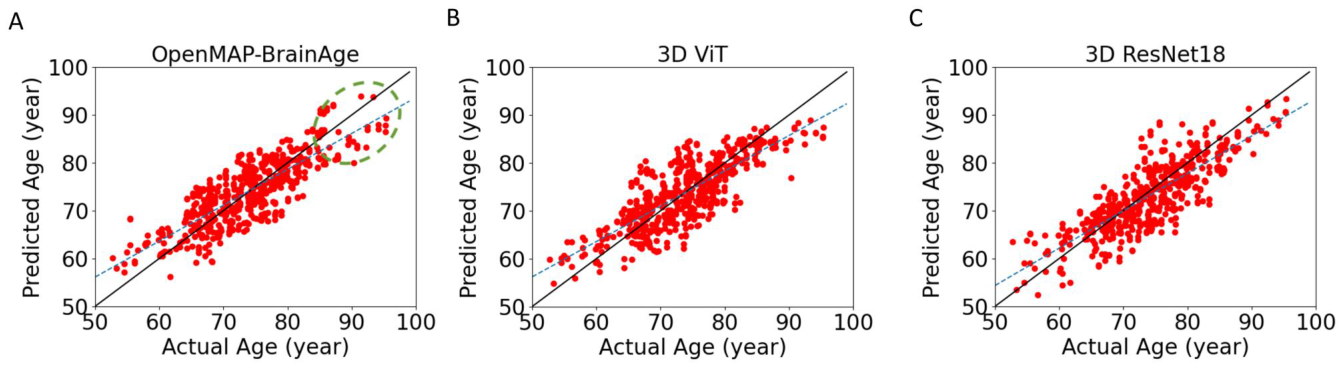
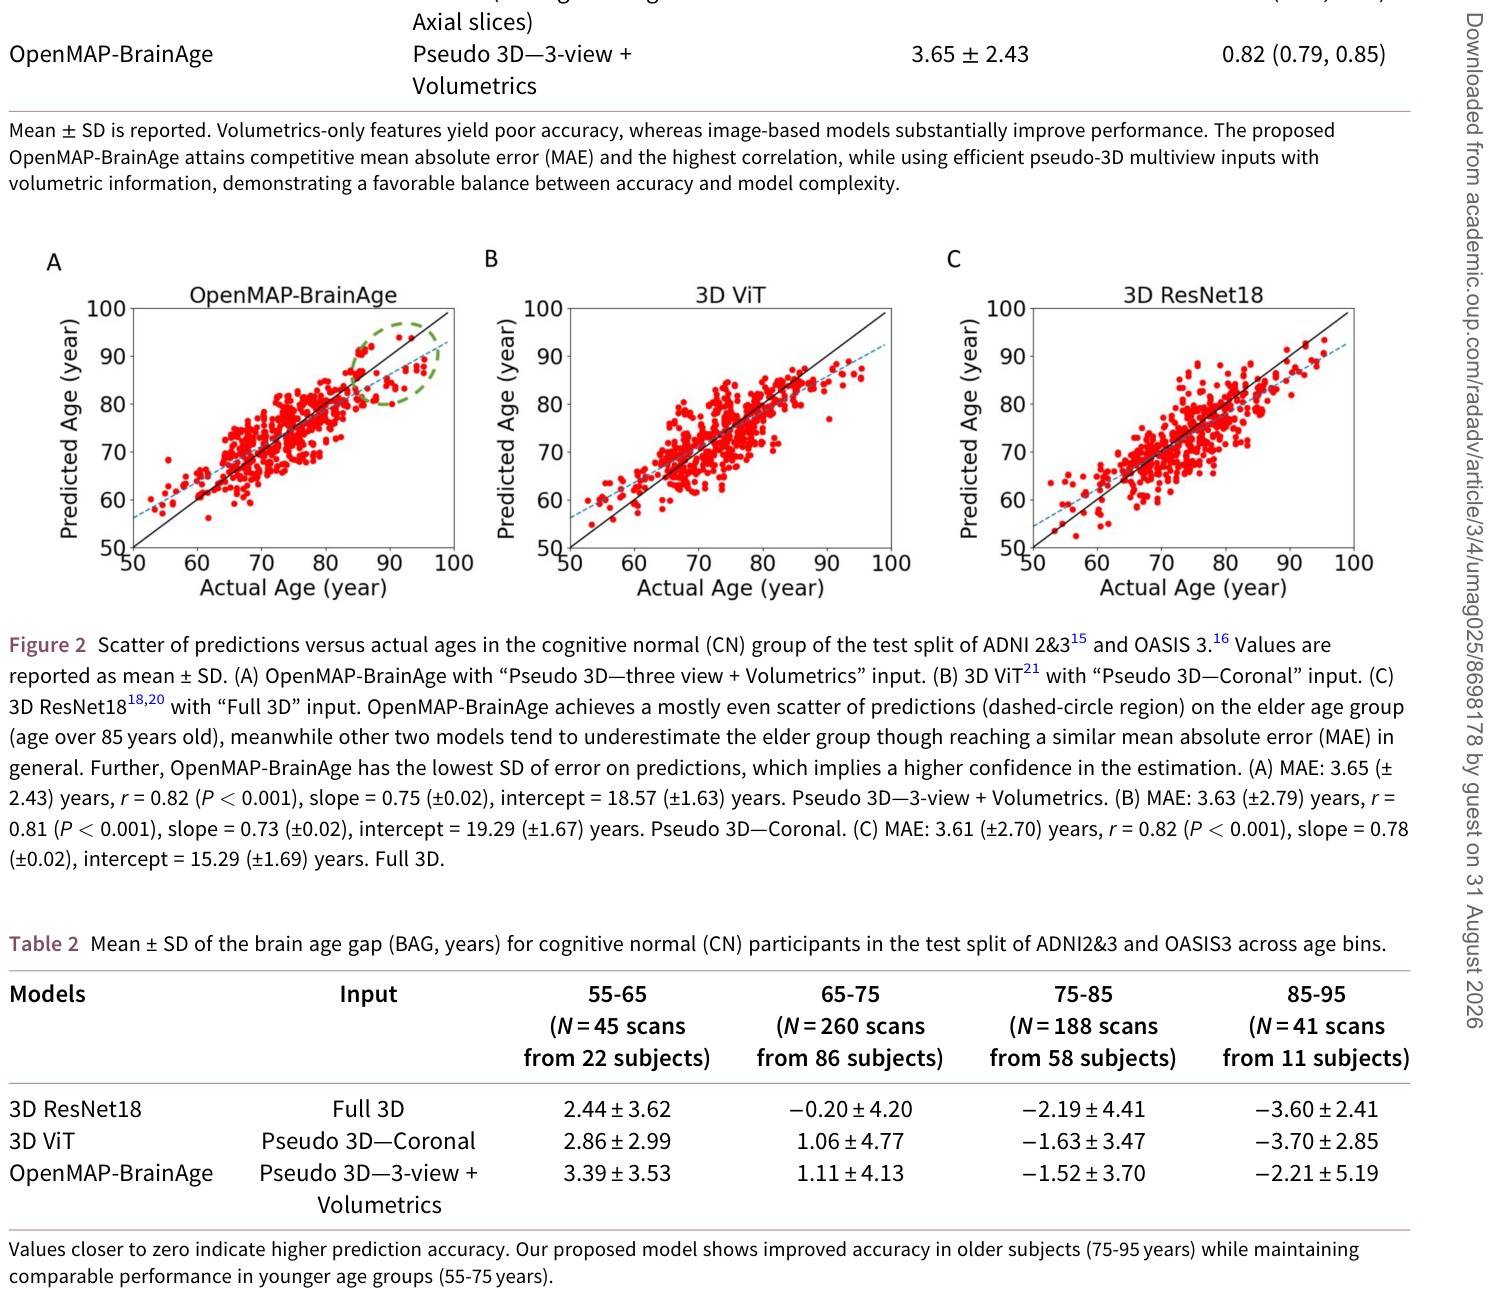
Figure 2. Figure 2 Scatter of predictions versus actual ages in the cognitive normal (CN) group of the test split of ADNI 2&315 and OASIS 3.16 Values are reported as mean ± SD. (A) OpenMAP-BrainAge with “Pseudo 3D—three view + Volumetrics” input. (B) 3D ViT21 with “Pseudo 3D—Coronal” input. (C) 3D ResNet1818,20 with “Full 3D” input. OpenMAP-BrainAge achieves a mostly even scatter of predictions (dashed-circle region) on the elder age group (age over 85 years old), meanwhile other two models tend to underestimate the elder group though reaching a similar mean absolute error (MAE) in general. Further, OpenMAP-BrainAge has the lowest SD of error on predictions, which implies a higher confidence in the estimation. (A) MAE: 3.65 (± 2.43) years, r = 0.82 (P < 0.001), slope = 0.75 (±0.02), intercept = 18.57 (±1.63) years. Pseudo 3D—3-view + Volumetrics. (B) MAE: 3.63 (±2.79) years, r = 0.81 (P < 0.001), slope = 0.73 (±0.02), intercept = 19.29 (±1.67) years. Pseudo 3D—Coronal. (C) MAE: 3.61 (±2.70) years, r = 0.82 (P < 0.001), slope = 0.78 (±0.02), intercept = 15.29 (±1.69) years. Full 3D.解説: 認知機能が正常な対象者の予測脳年齢と実年齢の散布図です。OpenMAP-BrainAge(A)は、他のモデル(B: 3D ViT、C: 3D ResNet18)と比較して、特に85歳以上の高齢者グループにおいて予測の偏りが少なく、実年齢に近い分布を示しています。OpenMAP-BrainAgeは、予測誤差の標準偏差が最も低く、より安定した年齢推定が可能であることが示唆されています。
Table 2. Table 2 Mean ± SD of the brain age gap (BAG, years) for cognitive normal (CN) participants in the test split of ADNI2&3 and OASIS3 across age bins.解説: 認知機能が正常な対象者における、年齢層ごとの脳年齢ギャップ(BAG)の平均値と標準偏差(SD)を示しています。OpenMAP-BrainAgeは、特に75歳から95歳の高齢者においてBAGがゼロに近い値を示しており、他のモデルと比較して高い予測精度を維持していることがわかります。
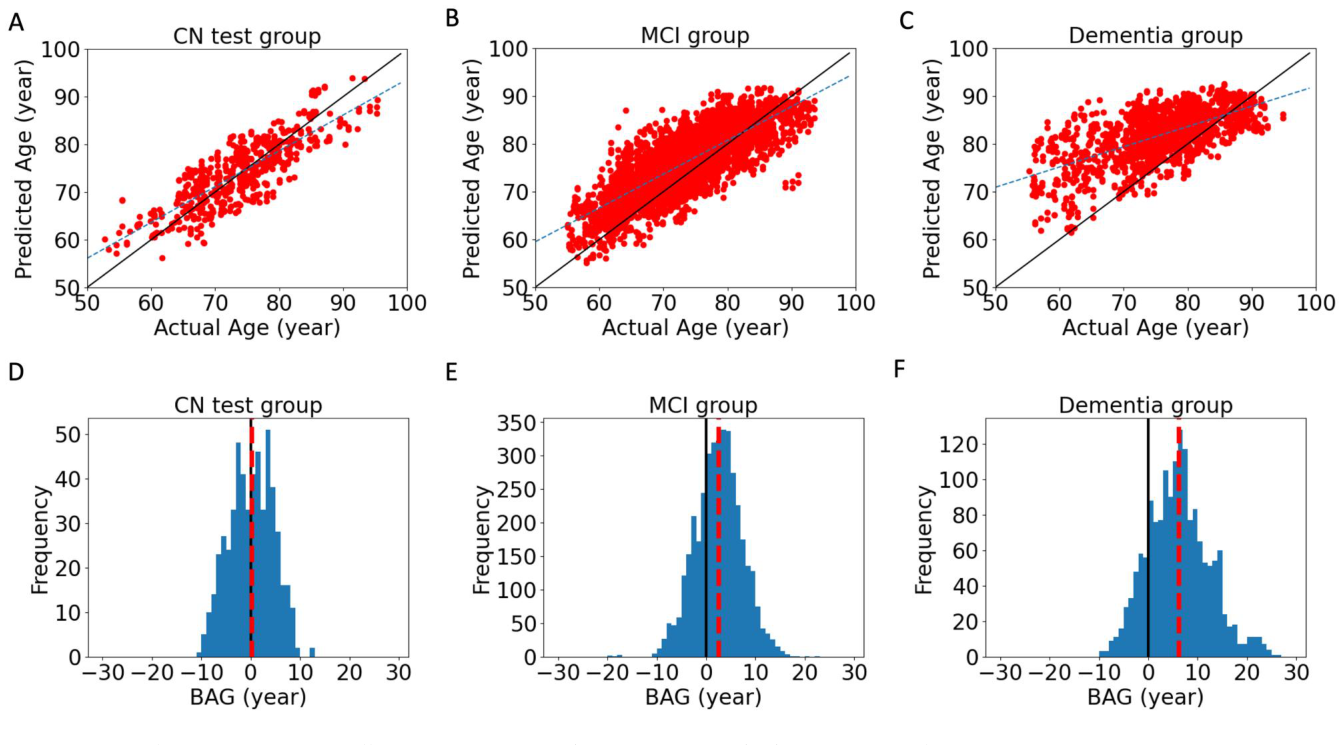
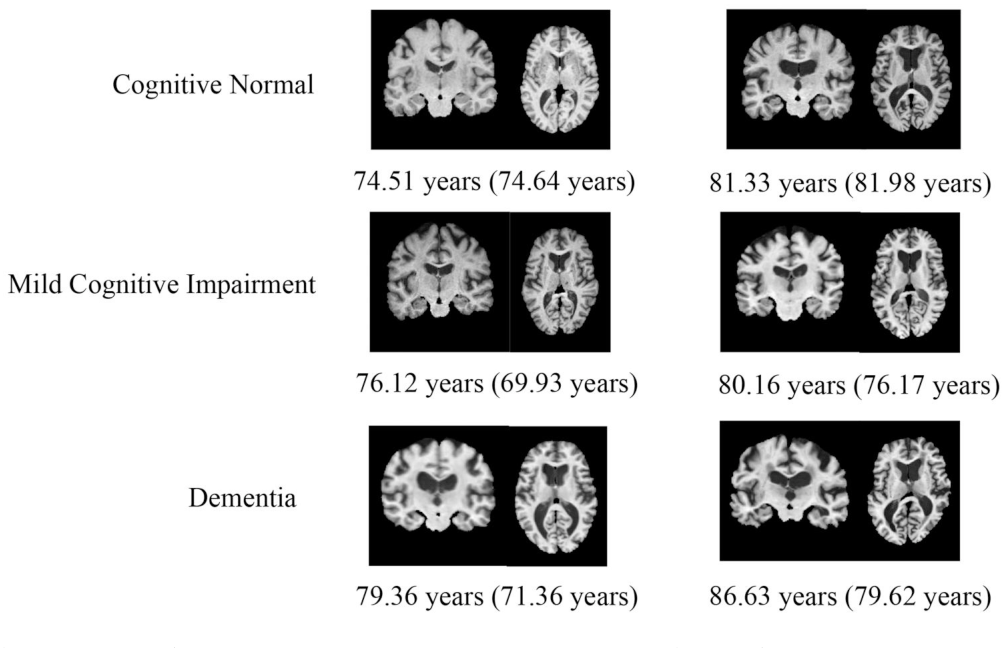
Figure 3. Figure 3 Analysis of brain aging across different subject groups (cognitive normal (CN): N = 543 scans from 146 subjects; mild cognitive impairment (MCI): N = 3934 scans from 761 subjects; and dementia: N = 1831 scans from 512 subjects) of ADNI 2&315 and OASIS 3.16 In the first row, we plotted the prediction versus the actual age of each scan. Values are reported as mean ± SD. The solid diagonal line is the identity line representing perfect prediction, and the dashed line represents the linear regression trend. In the second row, we plotted the histogram of the brain age gap (BAG) for each group. The solid line is BAG=0 and the dashed line represents the mean of each distribution. The predictions show increasing overestimation and the mean BAG values are increasing as the subject groups suffer from more severe disorders. (A) MAE: 3.65 (±2.43) years, r = 0.82 (P < 0.001), slope = 0.75 (±0.02), intercept = 18.57 (±1.63) years. (B) MAE: 4.33 (±3.20) years, r = 0.79 (P < 0.001), slope = 0.71 (±0.01), intercept = 24.12 (±0.64) years. (C) MAE: 7.05 (±5.16) years, r = 0.62 (P < 0.001), slope = 0.42 (±0.01), intercept = 49.75 (±1.02) years. (D) Mean: 0.15 years. 95% CI: (−0.22, 0.51) years. (E) Mean: 2.55 years. 95% CI: (2.40, 2.70) years. (F) Mean: 6.12 years. 95% CI: (5.82, 6.43) years.解説: 認知機能が正常な対象者(CN)、軽度認知障害(MCI)、認知症の各グループにおける脳年齢予測と脳年齢ギャップ(BAG)の分析結果です。予測脳年齢と実年齢の散布図(上段A-C)では、疾患が重度になるにつれて予測が実年齢を上回る傾向が強まります。BAGのヒストグラム(下段D-F)では、CNグループのBAGが0年付近に集中しているのに対し、MCIおよび認知症グループではBAGが徐々に増加し、より高い値を示しています。これは、疾患の重症度に応じて脳の老化が加速していることを示唆しています。Figure 4. Figure 4 Examples of brain MRI inputs (T1-weighted coronal and axial images respectively left to right) and corresponding predicted brain ages; chronological ages are reported in parentheses.解説: 脳MRI画像(T1強調冠状断および軸状断)の例と、それに対応する予測脳年齢(実年齢は括弧内)を示しています。認知機能が正常な対象者、軽度認知障害の対象者、認知症の対象者それぞれの画像が示されており、疾患の進行に伴い脳室の拡大など構造的な変化が見られます。予測脳年齢と実年齢の差(脳年齢ギャップ)も示されています。
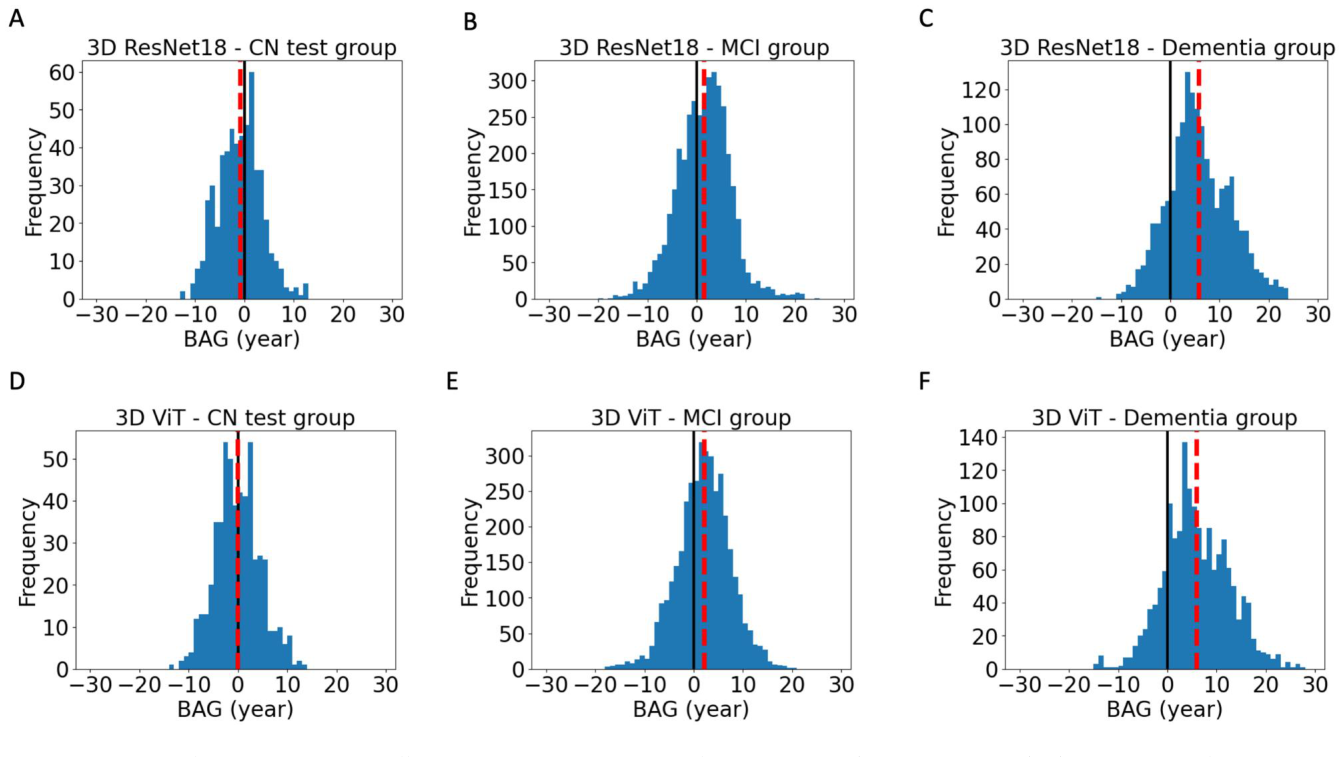
Figure 5. Figure 5 Comparison of brain aging across different subject groups in state-of-the-art models (cognitive normal (CN): N = 543 scans from 146 subjects; mild cognitive impairment (MCI): N = 3934 scans from 761 subjects; and dementia: N = 1831 scans from 512 subjects on ADNI 2&315 and OASIS 316). In the first row, we plotted the histogram of the brain age gap (BAG) for 3D ResNet18 model with “Full 3D” as input and the second row for 3D ViT model with “Pseudo 3D—Coronal” as input. In both rows, the solid line is BAG=0 and the dashed line represents the mean of each distribution. The larger the predicted BAG value increases across different disorder groups, the better the model performs in terms of differentiating brain disorders. Specifically, our proposed method showed a better separation between CN and MCI groups, and a comparable separation between the CN and dementia group as the 3D ResNet18 and 3D ViT models. (A) Mean: −0.89 years. 95% CI: (−1.26, −0.51) years. (B) Mean: 1.46 years. 95% CI: (1.29, 1.63) years. (C) Mean: 5.83 years. 95% CI: (5.51, 6.14) years. (D) Mean: −0.08 years. 95% CI: (−0.46, 0.30) years. (E) Mean: 2.06 years. 95% CI: (1.89, 2.23) years. (F) Mean: 5.94 years. 95% CI: (5.62, 6.26) years.解説: 既存の最先端モデル(3D ResNet18と3D ViT)における、認知機能が正常な対象者(CN)、軽度認知障害(MCI)、認知症の各グループの脳年齢ギャップ(BAG)のヒストグラムの比較です。BAGの平均値が疾患グループ間で大きく異なるほど、脳疾患の鑑別性能が高いことを示します。OpenMAP-BrainAgeは、CNとMCIグループ間の分離においてより優れた性能を示しました。
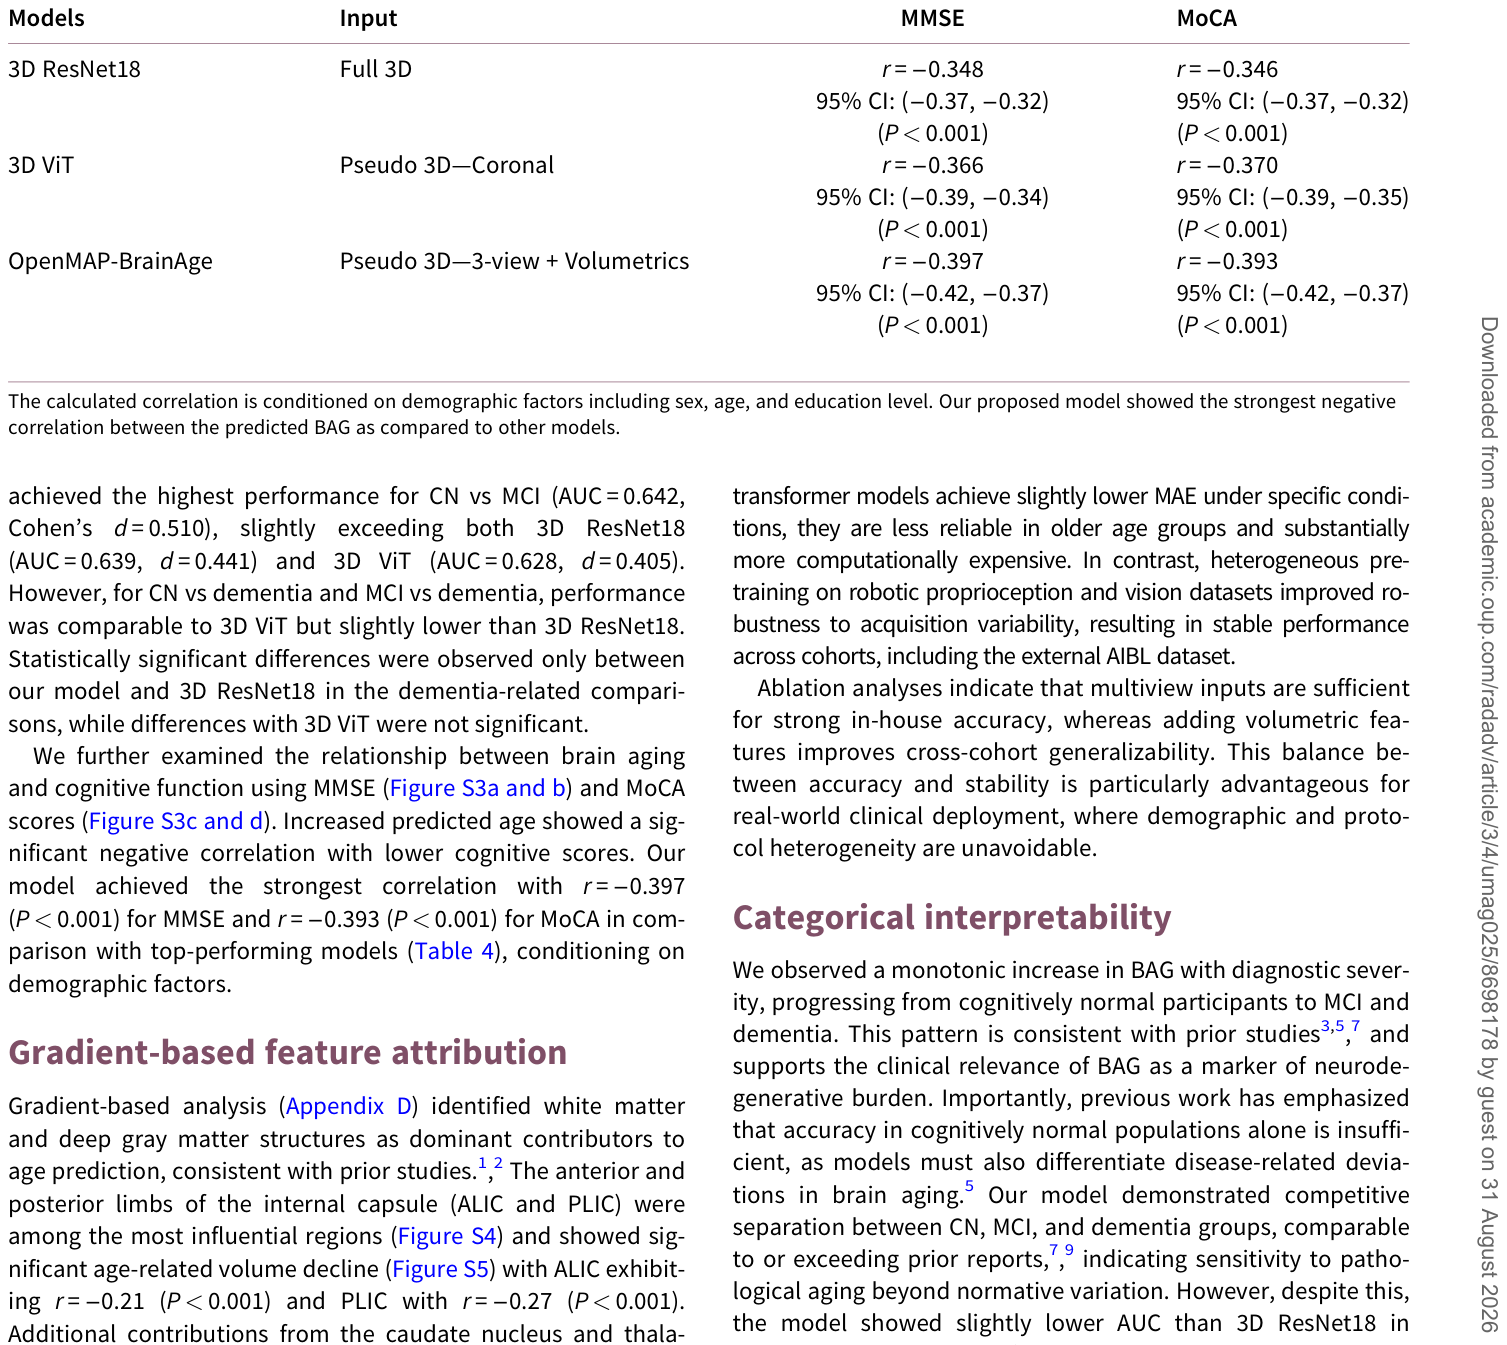
Table 4. Table 4 Comparison of correlation between predicted BAG and cognitive scores (Mini-Mental State Examination (MMSE) and Montreal Cognitive Assessment (MoCA); N = 5811 scans from 971 subjects, with cognitive normal (CN) test split, mild cognitive impairment (MCI) and dementia group from ADNI2&3 and OASIS3) across different state-of-the-art models.解説: 脳年齢ギャップ(BAG)と認知機能スコア(MMSEおよびMoCA)との相関関係を、複数の最先端モデルと比較した表です。OpenMAP-BrainAgeは、MMSEおよびMoCAスコアの両方において、他のモデルよりも強い負の相関(r = -0.397およびr = -0.393)を示しており、加速された脳老化と認知機能低下との関連が最も強く捉えられていることを示しています。
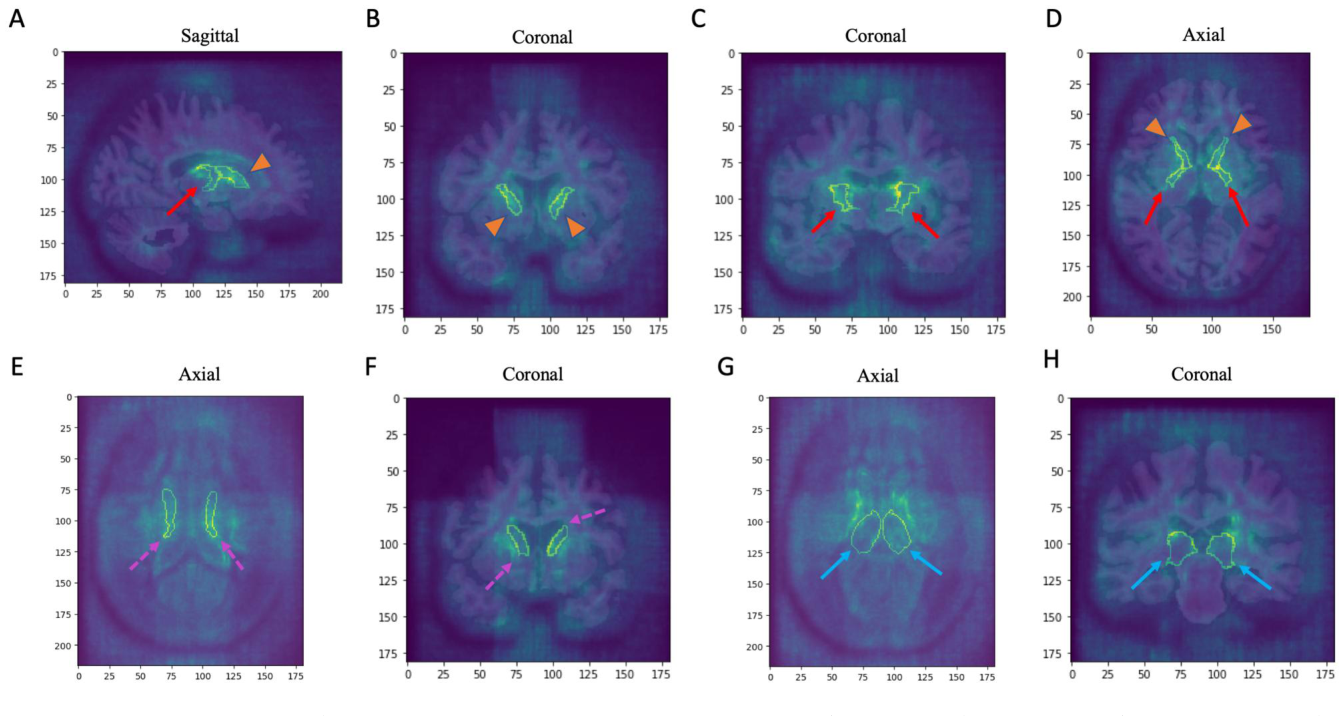
Figure 6. Figure 6 Average gradient mapping of input with respect to training loss across the test split (N =543 scans from 146 subjects). The anterior limb of the internal capsule (ALIC; orange arrowhead) and posterior limb of the internal capsule (PLIC; red arrow) are the top critical regions, determining our proposed model’s estimation (A–D). Caudate nuclei (pink dashed arrow) and thalami (blue arrow) are also highlighted as top 15 critical regions (E–H). (A) PLIC-R and ALIC-R. (B) AILC-R and ALIC-L. (C) PLIC-R and PLIC-L. (D) ALIC and PLIC. (E) Caudate-L and -R. (F) Caudate-L and -R. (G) Thalamus-L and -R. (H) Thalamus-L and -R.解説: モデルの学習損失に対する入力の平均勾配マッピングを示しており、脳年齢予測に特に寄与した脳領域を可視化しています。内包前脚(ALIC、オレンジ色の矢じり)と内包後脚(PLIC、赤い矢印)が最も重要な領域として強調されています(A-D)。また、尾状核(ピンクの破線矢印)と視床(青い矢印)も上位15位の重要領域として示されています(E-H)。

コメントを残す