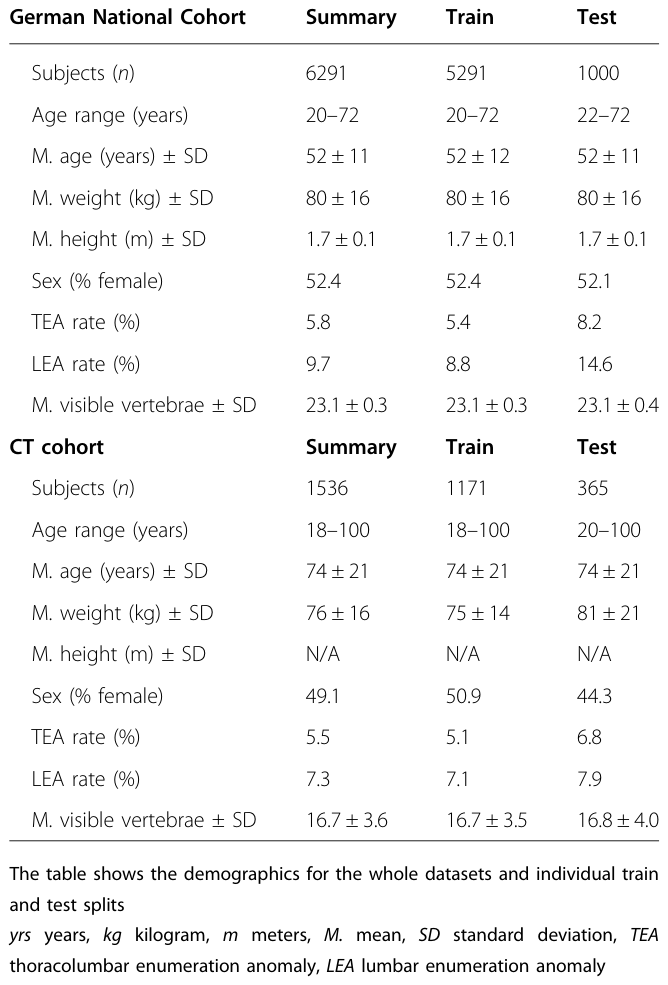
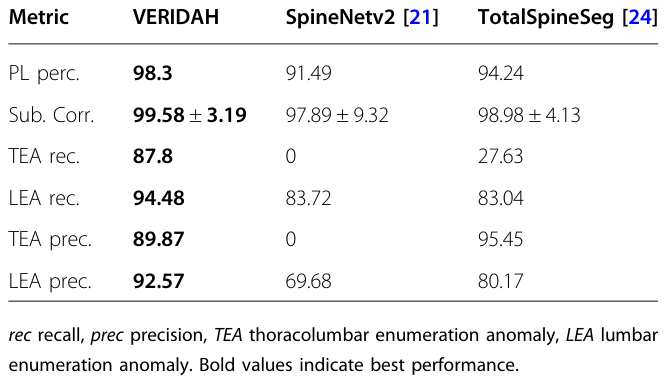
どうも、Beyond the Pixelです。医療画像診断において、脊椎(背骨)の各椎骨に正確なラベルを付与することは、様々な臨床的評価、例えば骨折の予測において不可欠です。通常、ヒトの脊椎は7個の頸椎、12個の胸椎、5個の腰椎で構成されています。しかし、一部の対象者では、胸椎や腰椎の数が1つ増減する「数え間違い(enumeration anomaly)」と呼ばれる異常が存在します。これには胸椎の数え間違い(TEA: Thoracic Enumeration Anomaly)と腰椎の数え間違い(LEA: Lumbar Enumeration Anomaly)があり、慢性的な腰痛や変性性変化と関連があることが研究で示されています。
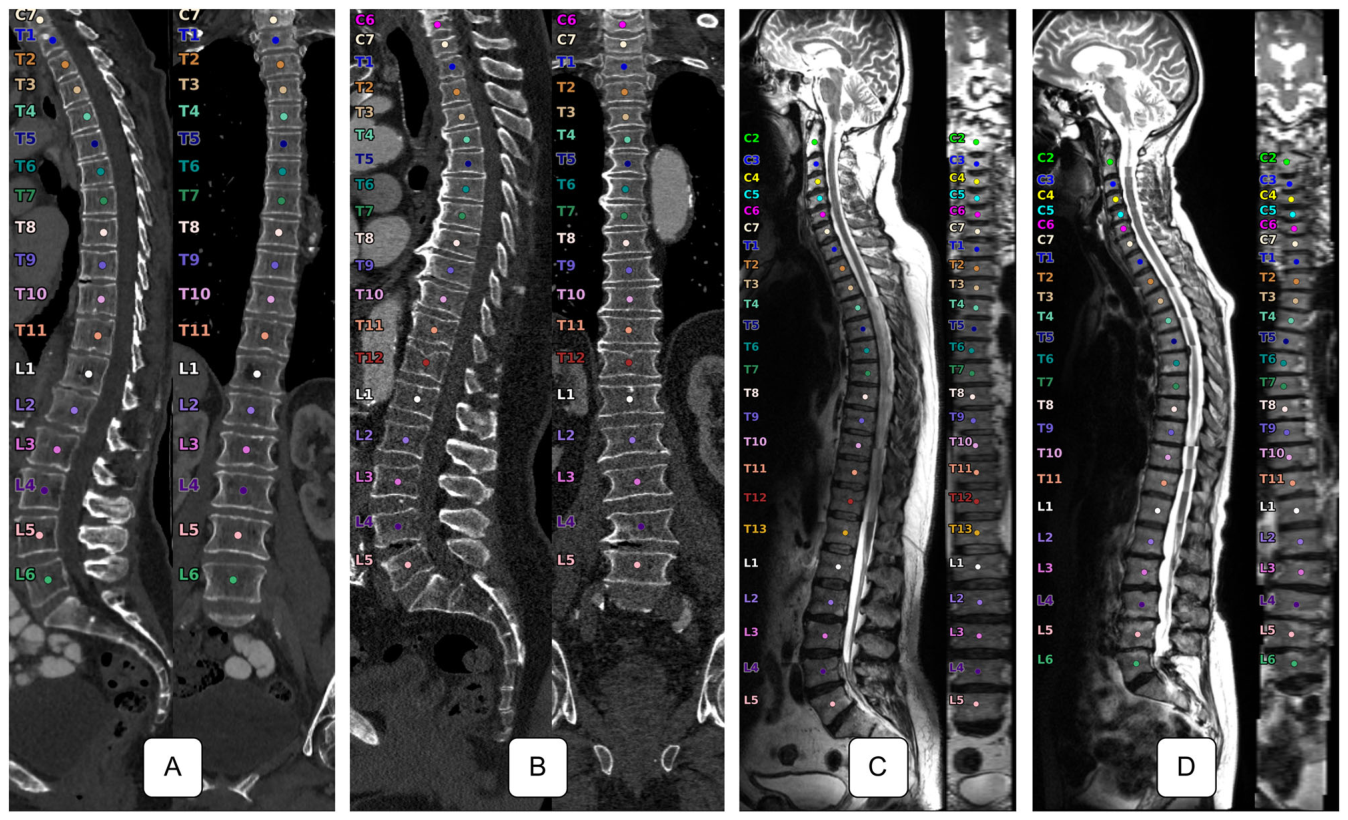
Figure 1. Fig. 1 Example data samples from our CT (A, B) and MRI (C, D) datasets. For each sample, it shows a sagittal and coronal projection along the spine as well as the corpus centroids with vertebra labels associated with each. While the CT images contain various field-of-views, the NAKO T2w sagittal MRI images always cover the whole spine. A Spine with eleven thoracic vertebrae, B normal spine with twelve thoracic and five lumbar vertebrae, C has an additional thoracic vertebra, and D a subject with only eleven thoracic vertebrae but six lumbar ones解説: CT (A, B) およびMRI (C, D) データセットからのサンプル画像を示しています。各サンプルには、脊椎に沿った矢状投影と冠状投影、および対応する椎体中心と椎骨ラベルが示されています。CT画像は様々な視野を含みますが、NAKO T2強調矢状MRI画像は常に全脊椎をカバーしています。Aは胸椎が11個、Bは胸椎が12個と腰椎が5個の正常な脊椎です。Cは追加の胸椎があり、Dは胸椎が11個だが腰椎が6個の対象者を示しています。
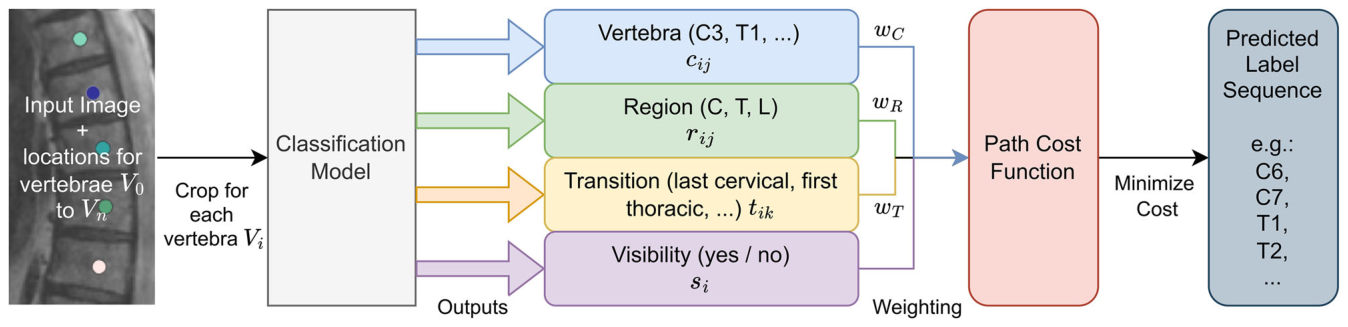
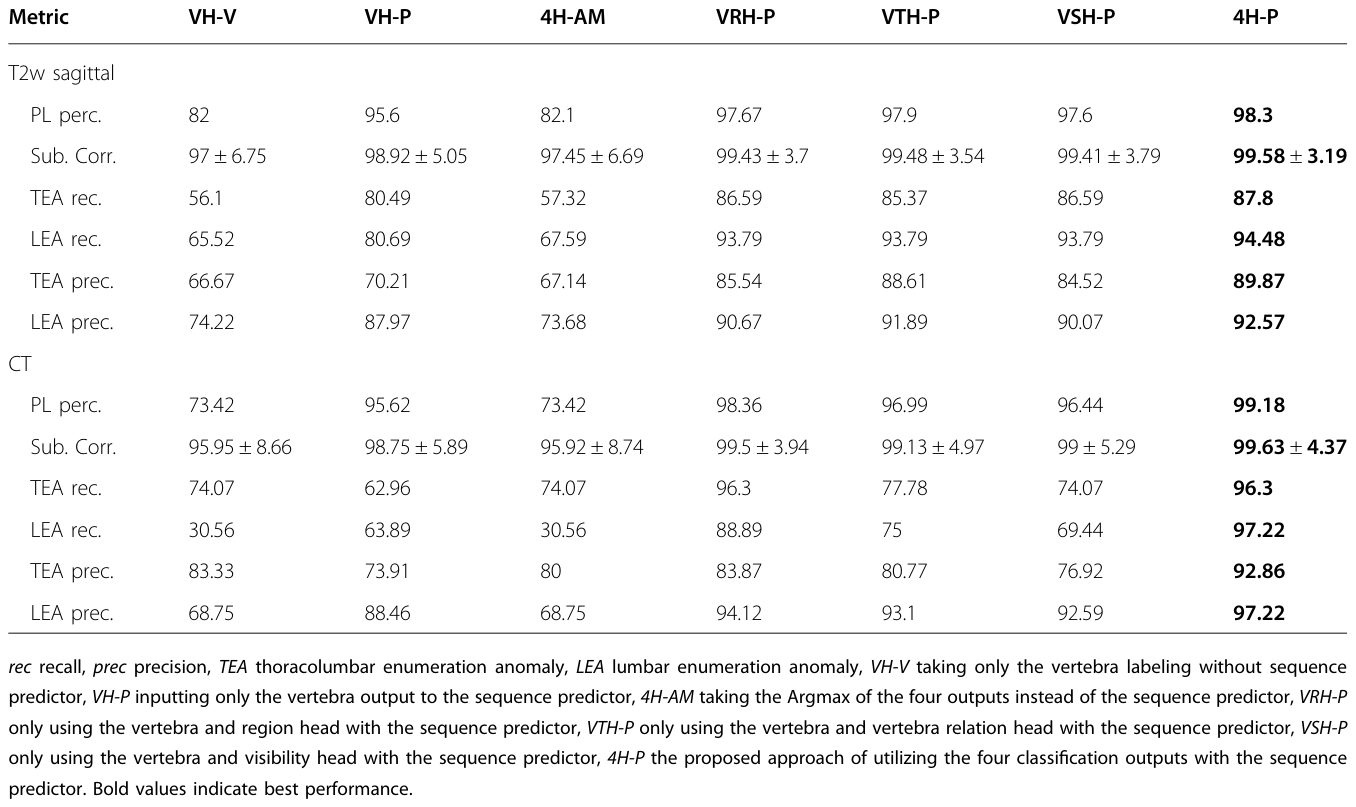
VERIDAH(Vertebra Identification with Anomaly Handling)は、数え間違いに対応可能な椎骨ラベリングを目的とした新しいアルゴリズムです。このアプローチは、複数の分類ヘッドと重み付き椎骨シーケンス予測アルゴリズムを組み合わせることで、従来のモデルが持つ課題を解決します。
Figure 2. Fig. 2 Overview of the VERIDAH approach. We take an input image and the vertebra localizations to crop around each vertebra. We then input these 3D cropped images separately into our classification model. The classification model has four output heads. We weigh their predictions based on our calibration and combine them into a cost matrix. Finally, an algorithm finds the optimal label sequence path that minimizes this cost, making our final sequence prediction解説: VERIDAHのアプローチの概要です。入力画像と椎骨の位置情報から、各椎骨の周囲を切り抜きます。これらの3D切り抜き画像はそれぞれ分類モデルに入力され、このモデルには4つの出力ヘッドがあります。それぞれの予測はキャリブレーションに基づいて重み付けされ、コスト行列に統合されます。最後に、アルゴリズムがこのコストを最小化する最適なラベルシーケンスパスを見つけ、最終的なシーケンス予測を行います。
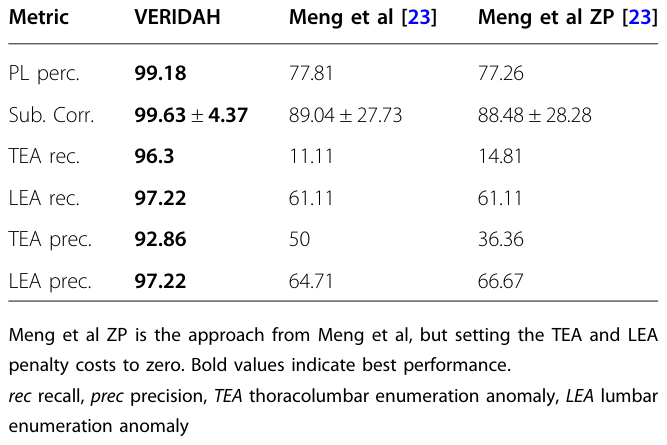
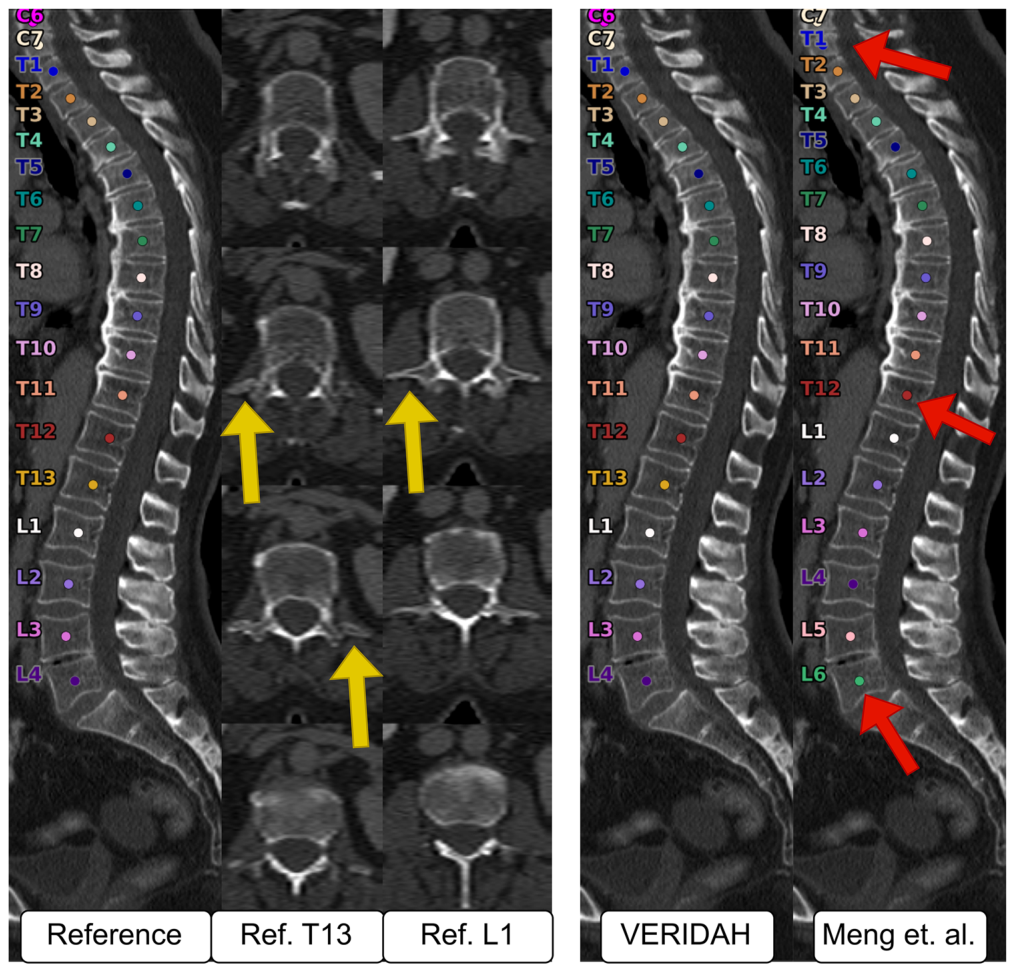
Figure 4. Fig. 4 Example of a CT test subject with a T13 and only four lumbar vertebrae. The axial slices of the reference data (left) show that the T13 has a rib on either side (yellow arrows). While VERIDAH (right) correctly classifies the whole sequence of labels, the prediction of Meng et al made two major errors, leading to six lumbar vertebrae instead of four (red arrows)解説: T13(胸椎13番)と4個の腰椎を持つCTテスト対象者の例です。参照データ(左)の軸方向スライスは、T13が両側に肋骨を持っていることを示しています(黄色の矢印)。VERIDAH(右)はラベルのシーケンス全体を正しく分類していますが、Mengらの予測は2つの大きな誤りを犯し、腰椎が4個ではなく6個になっています(赤矢印)。
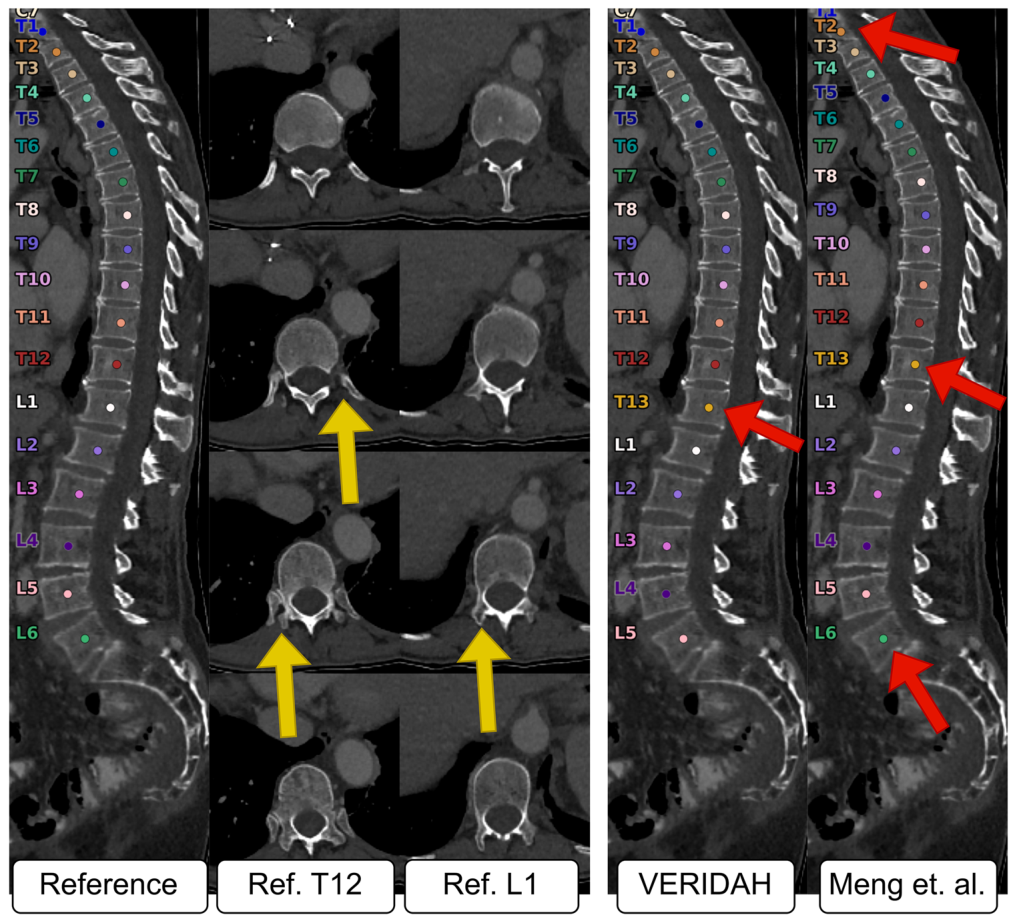
Figure 3. Fig. 3 Example of a CT test subject where all models failed. The reference data (left) shows an L6 LEA case with an ordinary number of twelve thoracic vertebrae. VERIDAH (right) mistakes the L1 for a thoracic vertebra, resulting in thirteen thoracic and five lumbar vertebrae (red arrows). The prediction of Meng et al has a shift error by one, but correctly labels the L1. The center shows the reference T12 and L1 in multiple axial slices (top to bottom). While the T12 has clear ribs on both sides (yellow arrows), the L1 has thoracic-looking facets while having no ribs, making this a TLTV解説: すべてのモデルが失敗したCTテスト対象者の例です。参照データ(左)は、通常の胸椎数12個とL6(腰椎6番)のLEA(腰椎の数え間違い)ケースを示しています。VERIDAH(右)はL1を胸椎と間違え、13個の胸椎と5個の腰椎という結果になっています(赤矢印)。Mengらの予測は1つずれたエラーがありますが、L1は正しくラベリングしています。中央は参照データのT12とL1の複数の軸方向スライスを示しており、T12には両側に明確な肋骨(黄色の矢印)がありますが、L1は肋骨がないにもかかわらず胸椎のような関節面を持っています。
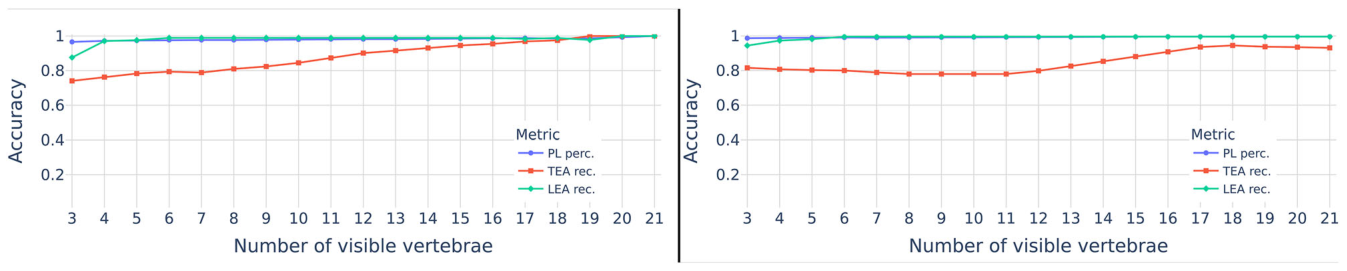
Figure 5. Fig. 5 The behavior of three metrics over different FOVs of the test data. The x-axis shows the number of visible vertebrae fed into VERIDAH, while the y-axis showcases the different metric values解説: テストデータの異なる視野(FOV)における3つの指標の挙動を示しています。X軸はVERIDAHに入力された可視椎骨の数を示し、Y軸は異なる指標の値を示しています。PL perc.(完璧なラベルの割合)とLEA rec.(腰椎の数え間違いの再現率)は、可視椎骨の数が少ない場合でも一貫して高い精度を維持していますが、TEA rec.(胸椎の数え間違いの再現率)は、FOVが狭い場合にわずかに低下する傾向があります。

コメントを残す