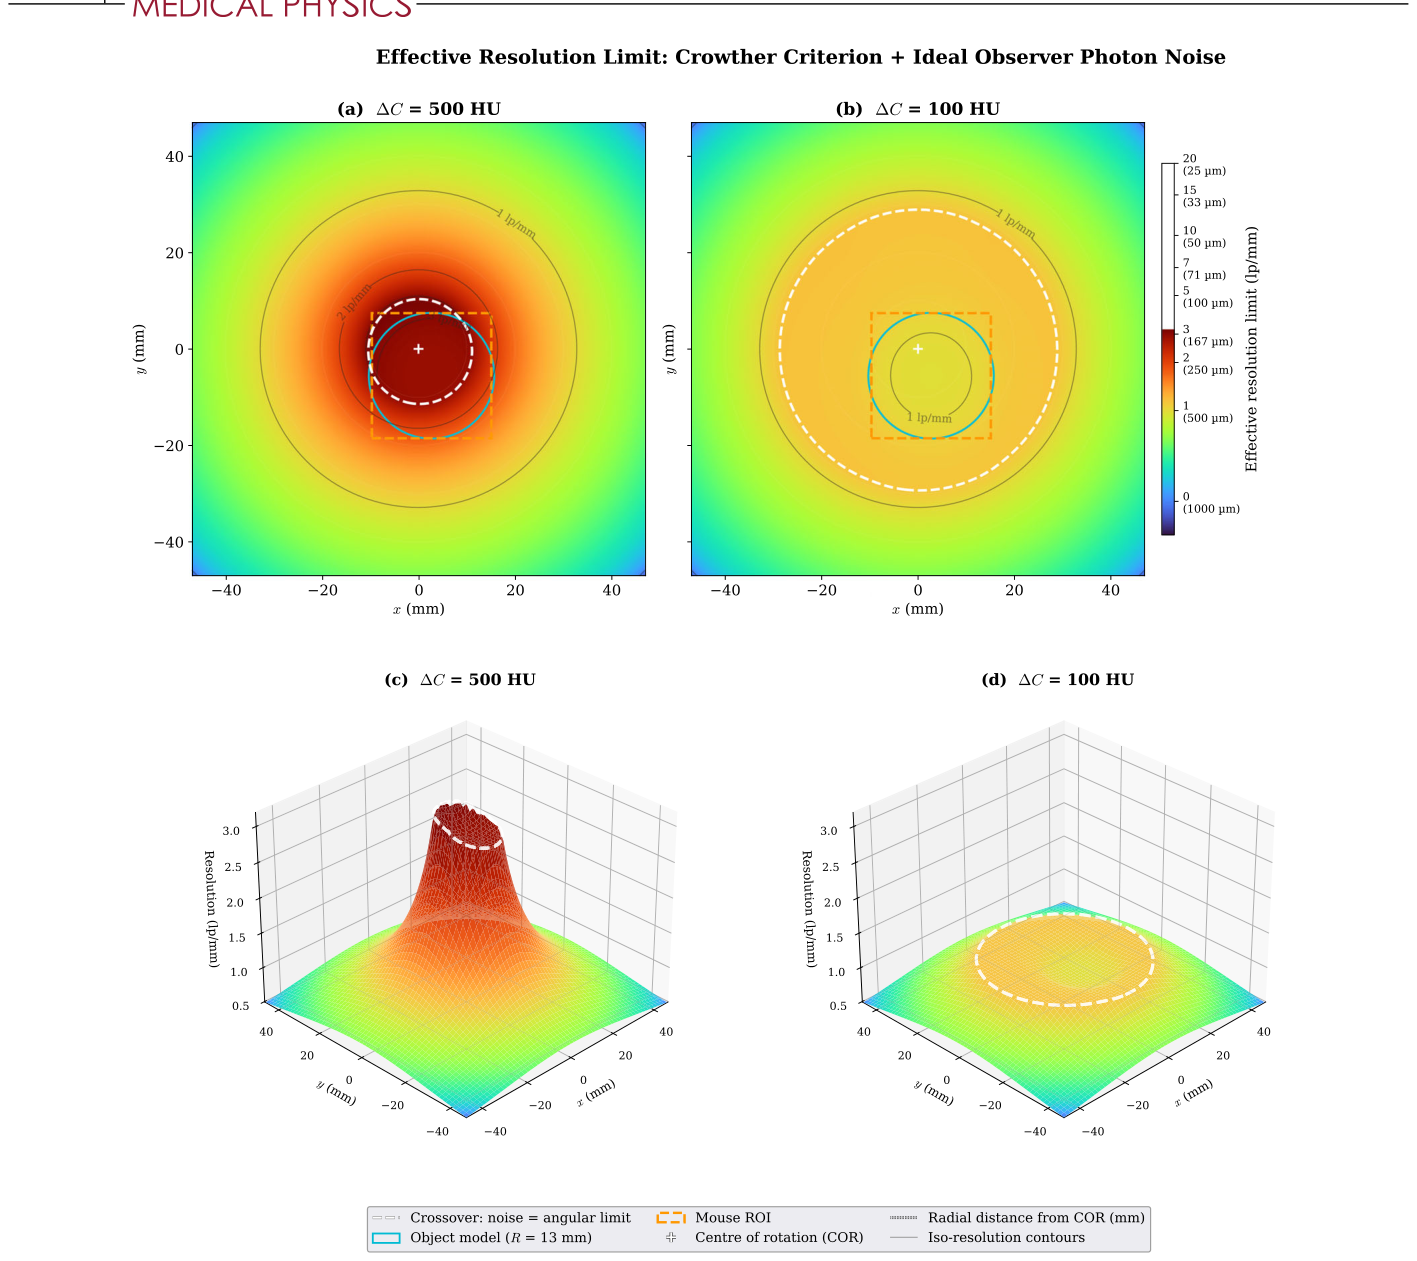
どうも、Beyond the Pixelです。医療画像診断において、コーンビームmicro-CT(CBCT)は、前臨床研究などで広く利用されています。その空間分解能は、微細な構造を可視化するために極めて重要です。しかし、従来の空間分解能の評価方法には課題がありました。例えば、画像領域で測定される変調伝達関数(MTF)のような指標は、データに起因する分解能の損失(フォトンノイズ、画角アンダーサンプリング)と、再構成アルゴリズムに起因する損失(アポダイゼーション、正則化、ボクセルグリッド)とを混同してしまいます。このため、「与えられたデータセットに対して、どこまで改善の余地があるのか」という根本的な問いに答えることができませんでした。本研究は、この課題を解決するため、再構成アルゴリズムに依存しない2つの分解能限界を導出し、それらを組み合わせることで、スキャン設計の指針を提供するものです。
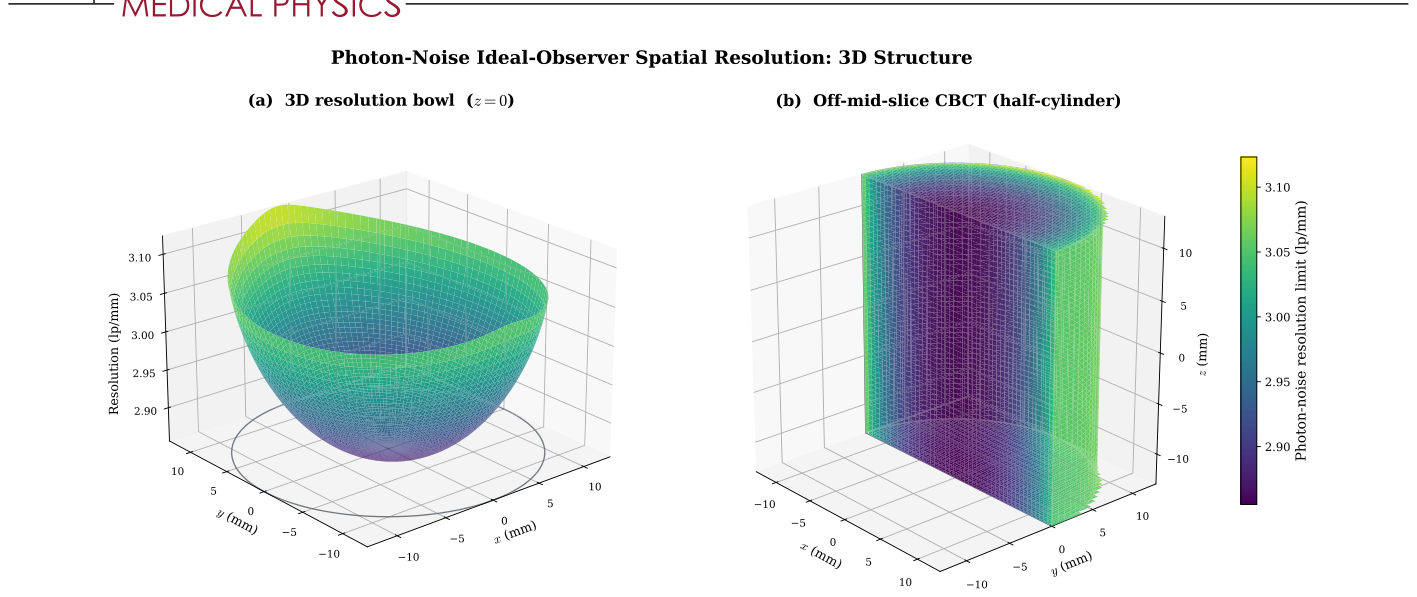
Figure 1. FIGURE 1 Three-dimensional structure of the photon-noise ideal-observer resolution limit, at ΔC = 500 HU inside a centred cylindrical specimen model (R = 13 mm, half-height Z = 13 mm). The Crowther angular-sampling limit is not included here. The combined limit including it is shown later in Figure 5. (a) 3D resolution bowl on the mid-plane z = 0. Surface height encodes fnoise (lp/mm). The specimen rim is outlined at the floor of the plot. (b) Off-mid-slice half-cylinder rendering: cut plane at y = 0 (front face), curved cylinder wall on the y ≥0 half (behind), and top and bottom caps at z = ±Z. For this scanner’s 4◦cone half-angle the surface is effectively z-invariant, so the mid-plane bowl applies throughout the reconstruction volume.解説: この図は、フォトンノイズによる理想観測者の空間分解能限界の3D構造を示しています。(a)は中心面(z=0)での3D分解能のボウル形状を示し、表面の高さがf_noise (lp/mm)を表しています。(b)はハーフシリンダーのオフミッドスライスレンダリングで、コーンビームの半角が小さいため、分解能はz軸方向でほぼ一定であることが示されています。
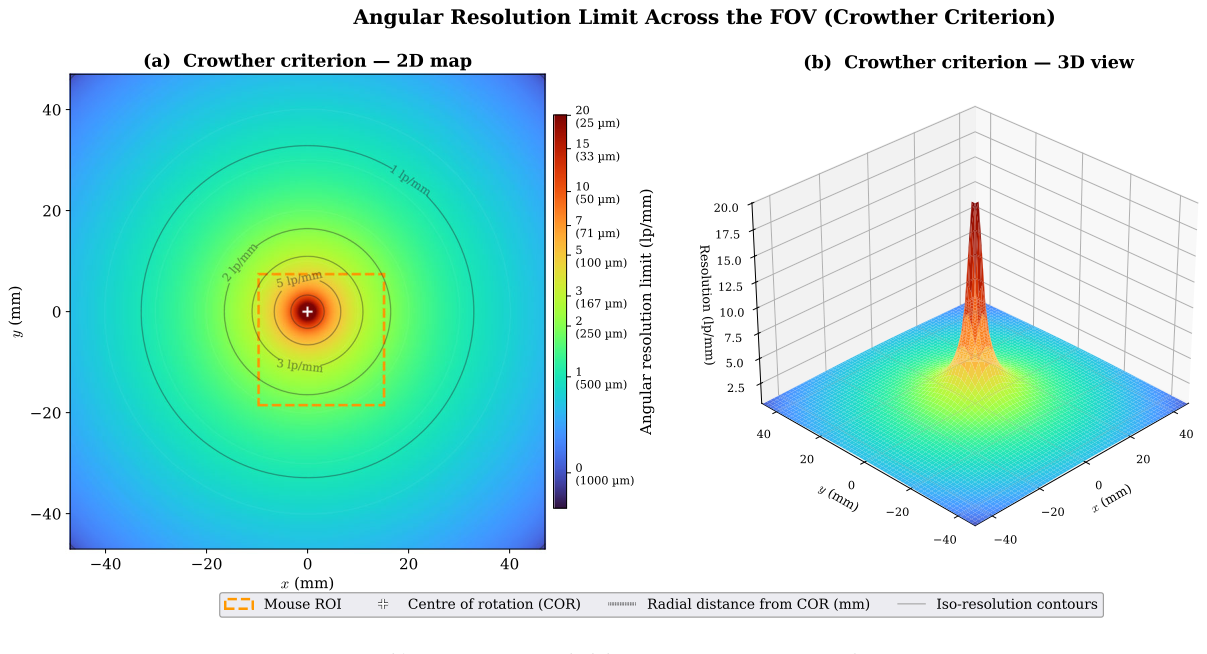
Figure 4. FIGURE 4 Angular sampling resolution limit (Crowther criterion). (a) 2D heatmap over the FOV, with iso-resolution contours overlaid in black. (b) Matching 3D surface. The limit is capped at the detector Nyquist (20.1 lp∕mm). Dashed-orange box: representative off-axis mouse ROI. White plus: centre of rotation.解説: この図は、画角サンプリング分解能限界(クラウザー基準)をFOV全体にわたって示しています。(a)は、FOV上の2Dヒートマップで、等分解能等高線が重ねられています。(b)は、対応する3D表面を示しており、回転軸(中心)で限界が発散し、外側に向かって1/rで低下する様子が視覚化されています。この限界は検出器のナイキスト周波数で上限が設けられています。
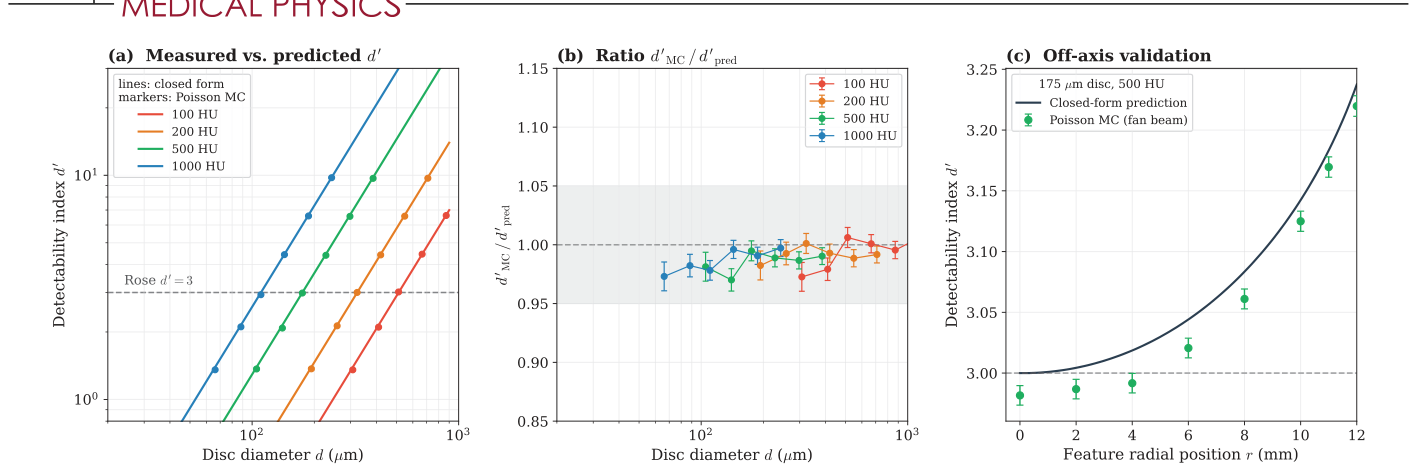
Figure 2. FIGURE 2 Poisson Monte Carlo validation of the closed-form ideal-observer bound on the R = 13 mm water cylinder at N0 = 4203 photons/pixel, 220 views over 192◦. (a, b) On-axis detectability versus disc diameter at four contrasts, simulation (markers, 10 000 realizations per hypothesis. Error bars are the Monte Carlo standard error) against the closed form (lines). The shaded band in (b) is ±5%. (c) Off-axis validation of Equation 8 for a disc of 175 𝜇m diameter at 500 HU (100 000 realizations per hypothesis): simulated-to-predicted d′解説: この図は、閉形式の理想観測者限界とポアソンモンテカルロシミュレーションの検証結果を比較しています。(a,b)では、4つの異なるコントラストにおける検出能指標d'とディスク直径の関係が示され、シミュレーション結果(マーカー)が閉形式(線)とよく一致しています。(c)では、オフアクシスでの閉形式予測とシミュレーション結果の比較が行われており、閉形式がシミュレーション結果と1%以内で一致することが確認されています。
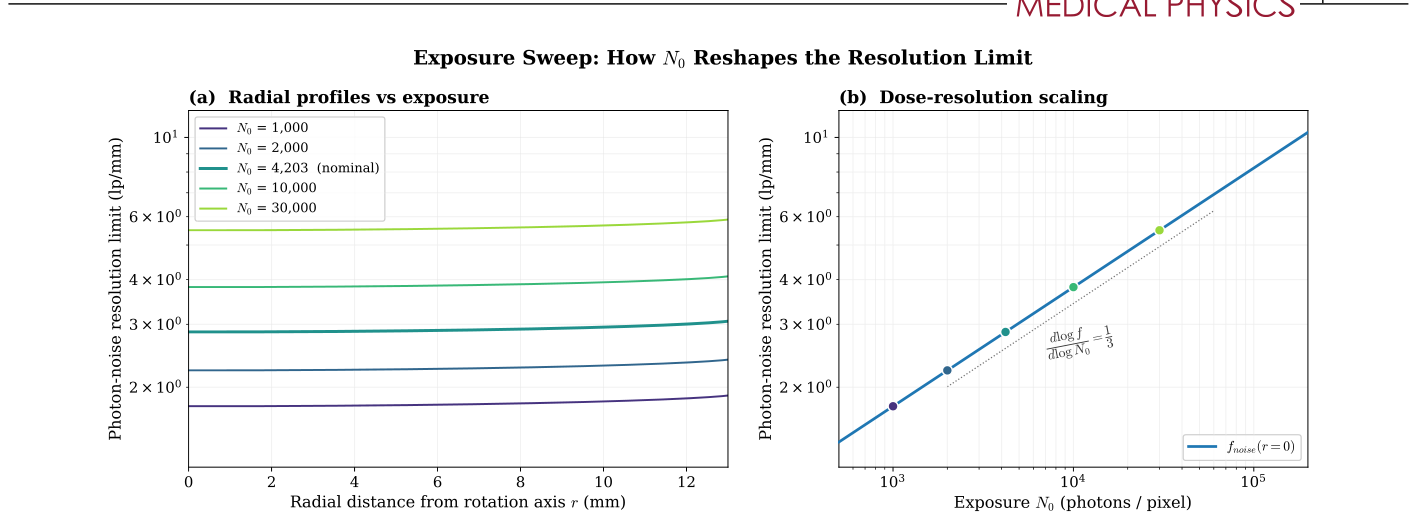
Figure 3. FIGURE 3 Effect of exposure N0 on the photon-noise resolution limit at ΔC = 500 HU. (a) Radial profile fnoise(r) at five log-spaced exposures. Increasing N0 raises every curve by the predicted N1∕3解説: この図は、露光量N0がフォトンノイズ分解能限界に与える影響を分析しています。(a)は、5つの異なる露光量におけるf_noise(r)の半径方向プロファイルを示しており、N0が増加するとすべての曲線が予測されたN0の1/3乗の係数で上昇し、形状は変化しないことがわかります。(b)は、回転軸における線量分解能スケールをログ-ログ軸でプロットしており、予測された1/3の傾きを持つべき乗則にf_noiseが従っていることを示しています。
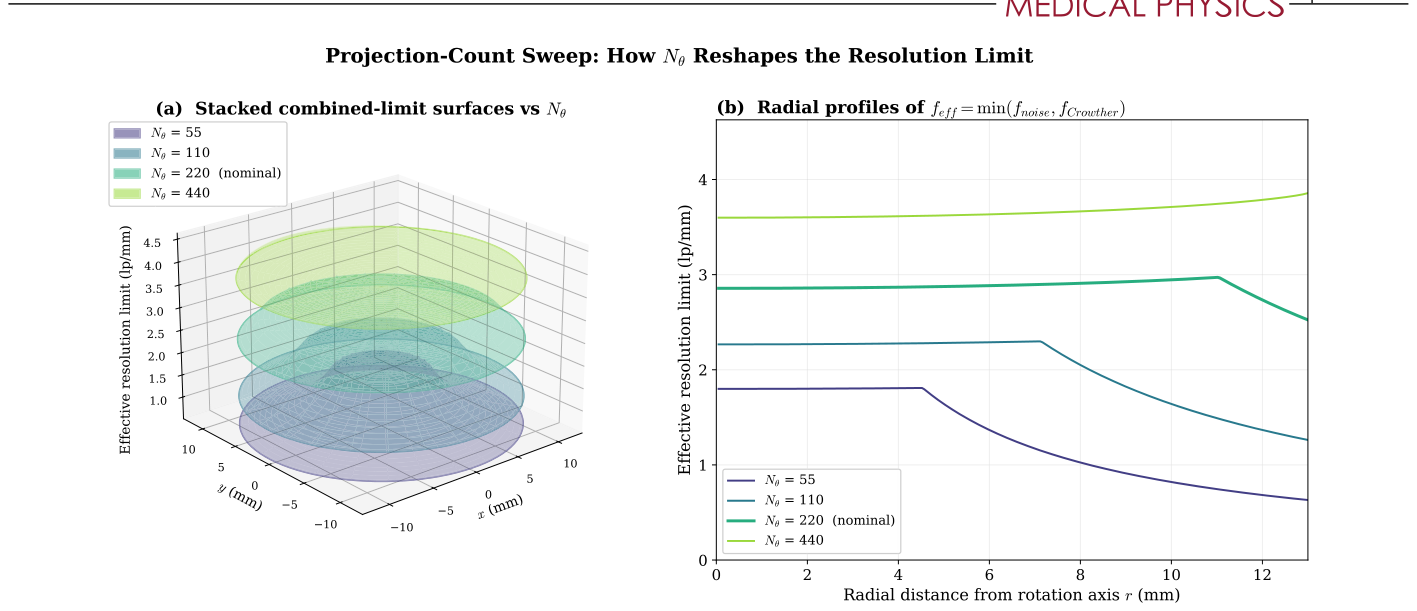
Figure 6. FIGURE 6 Effect of projection count N𝜃on the combined-limit resolution surface at ΔC = 500 HU. (a) Stacked 3D surfaces of feff(x, y) = min(fnoise, fCrowther) at four projection counts. Surfaces are drawn semi-transparent so the nesting is visible; lower N𝜃(darker) sits inside higher N𝜃(lighter). The floor lifts as N1∕3解説: この図は、投影数Nθが結合された分解能限界表面に与える影響を示しています。(a)は、4つの投影数におけるfeff(x, y)の積み重ねられた3D表面で、低いNθ(暗い色)がより高いNθ(明るい色)の内側に位置しており、中心部と外側の縁が異なるレートで上昇する様子が視覚化されています。(b)は、同じ投影数におけるfeff(r)の半径方向プロファイルで、ノイズに制約された中央のプラトーとクラウザーに制約された1/rのテールが示されています。
Table 3. TABLE 3 Combined-limit summary across the projection-count sweep at ΔC = 500 HU, R = 13 mm. “Crossover r” is the radius at which fnoise = fCrowther. The dash for N𝜃= 440 indicates the crossover lies outside the specimen, so the entire interior is noise-bound.解説: この表は、投影数Nθを変化させた場合の結合された分解能限界の要約を示しています。回転軸上でのf_noise(r=0)、ノイズとクラウザーのクロスオーバー半径r、標本リムでのfeff(r=R)、そしてリムでどちらの限界が支配的であるかが示されています。
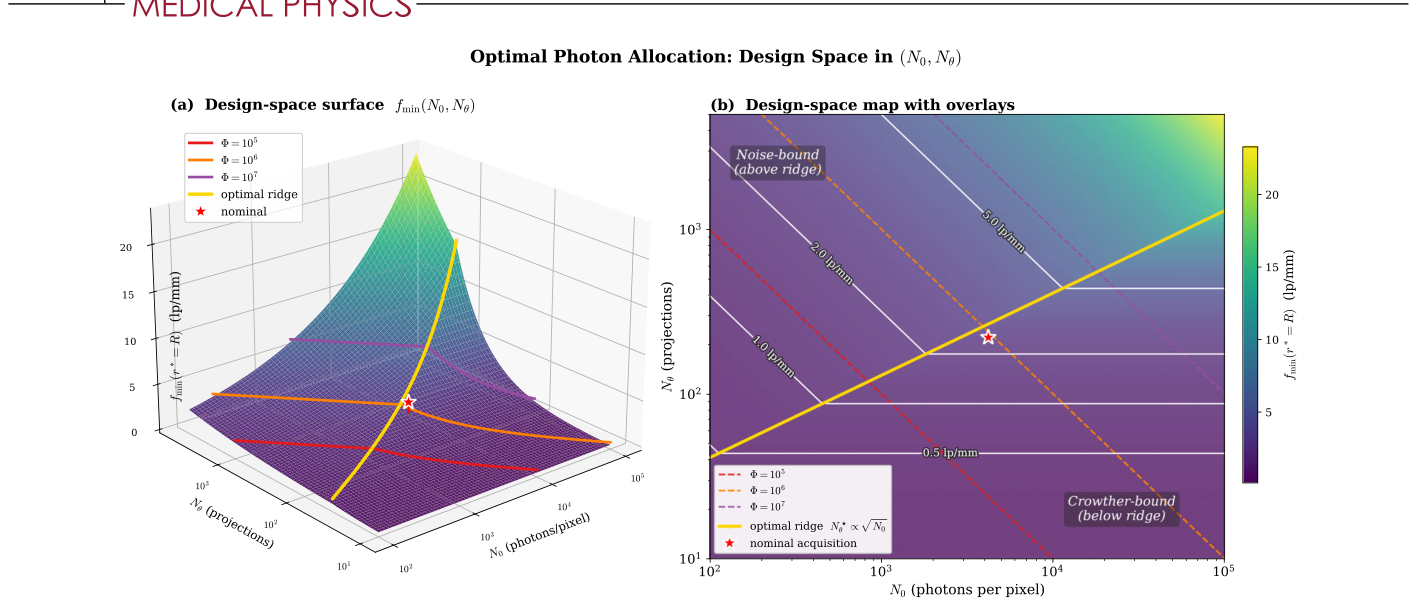
Figure 7. FIGURE 7 Dose-allocation design space at ΔC = 500 HU, r∗= R = 13 mm. (a) 3D surface fmin(N0, N𝜃) with both axes log-spaced. Three iso-Φ trajectories (red, orange, purple for Φ = 105, 106, 107) climb the Crowther ramp and plateau in the noise-bound regime. The red star is our nominal acquisition. (b) 2D heatmap of the same surface with design overlays: iso-Φ lines (dashed, slope −1), the optimal-allocation ridge N⋆解説: この図は、固定された線量予算下での最適なフォトン配分設計空間を示しています。(a)は、N0とNθの両軸がログスケールである3D表面fmin(N0, Nθ)で、3つの等線量軌跡が描かれています。(b)は、同じ表面の2Dヒートマップで、等線量線、最適な配分リッジN*_θ ∝ √N0、および等fmin等高線がオーバーレイされており、ノイズ支配領域とクラウザー支配領域が識別されています。
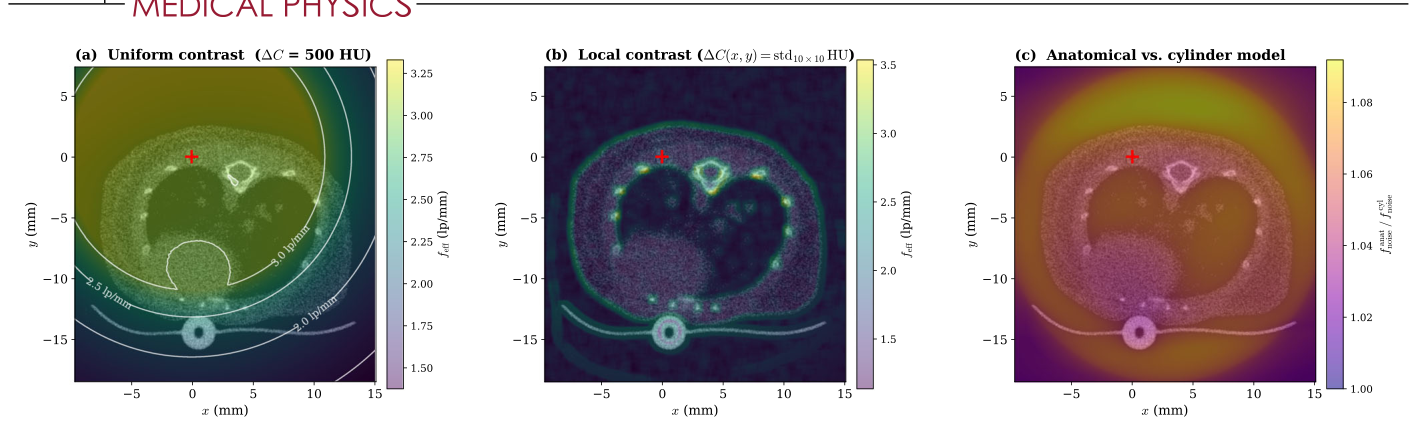
Figure 8. FIGURE 8 The combined limit feff evaluated at every pixel of an FDK mouse reconstruction (75.2 𝜇m pixels), with photon counts taken from the forward-projected anatomical 𝜇-map (Section 3.6). (a) Fixed contrast ΔC = 500 HU everywhere, with iso-resolution contours. feff spans 1.38–3.33 lp/mm. (b) Local contrast, ΔC(x, y) being the HU standard deviation over a 10 × 10 pixel window (floor 5 HU). Bone, lung–air interfaces, and tubing reach high feff. (c) Anatomical over uniform-cylinder photon-noise limit, 1.03–1.08 over tissue, so the cylinder model is conservative everywhere. Red cross marks the rotation axis. N𝜃= 220 over 192◦.解説: この図は、FDK再構成されたマウスのピクセルごとに評価された結合された限界f_effを示しています。フォトンカウントは、順投影された解剖学的μマップから取得されています。(a)は、一様なコントラストΔC = 500 HUの場合のfeffを等分解能等高線と共に示しています。(b)は、局所的なコントラストΔC(x, y)が10×10ピクセルウィンドウ内のHU標準偏差である場合のマップで、骨や肺-空気界面などの高コントラスト領域で高いfeffが示されています。(c)は、解剖学的モデルと一様なシリンダーモデルによるフォトンノイズ限界の比率を示しており、シリンダーモデルが常に保守的であることが示されています。
Table 2. TABLE 2 Minimum detectable disc diameter and spatial-frequency limit at the rotation axis from the projection-domain ideal observer (Equation 4, d′解説: この表は、投影領域理想観測者(ローズ基準d'=3)から導出された回転軸上での最小検出可能ディスク直径d_minと空間周波数限界f_noiseを、4つの異なるコントラスト(ΔC)について示しています。また、ポアソンモンテカルロシミュレーションによるd_minの値も併記されており、両者の偏差が1%未満であることが示されています。



コメントを残す