どうも、Beyond the Pixelです。機能的電気刺激(FES)は、外部から電流を流すことで筋肉を収縮させ、歩行やサイクリングのような意図的な動きを促す強力なリハビリテーション技術です。特に脊髄損傷(SCI)により下肢が麻痺した人々にとって、FESは筋量増加、心血管機能の改善、生活の質の向上など、多くの恩恵をもたらすことが知られています。現在利用できる支援技術の中で、FESは麻痺した四肢で自発的な筋肉収縮を生み出す唯一の技術でもあります。FESを用いたサイクリングは、臨床現場やCybathlonのような国際大会でも注目されており、心血管および神経筋のコンディショニングを安全に促進し、対称的な下肢運動を繰り返し行う手段を提供します。しかし、FESは生理的な随意収縮とは異なる筋動員パターンを生み出します。表面電極による電気刺激は、複数の運動単位を非選択的に活性化するため、力の段階的な調整が難しく、疲労しやすいという課題があります。FESサイクリングで最も一般的に採用されている刺激戦略は「バングバン(BB)制御」と呼ばれ、大筋群が定義された間隔で完全に活性化または完全に非活性化されます。これはシンプルで堅牢な方法ですが、段階的な活性化パターンではなく、突然の全か無かの収縮を強制するため、生理的な筋動員からさらに逸脱し、疲労を悪化させ、機械的効率を低下させる可能性があります。これらの課題を克服するため、これまでの研究では、経験則や健常者の筋電図(sEMG)データを用いてBB刺激のタイミングやパラメーターを最適化してきました。しかし、経験則的な調整は感覚フィードバックが制限された対象者にとってはリスクを伴い、sEMGデータは完全な脊髄損傷を持つ対象者には適用できないという問題がありました。また、筋骨格モデリングとシミュレーションが、生理学に基づいた刺激パラダイムへと橋渡しする強力なツールとして登場していますが、その多くは実験的な運動データや健常者のEMGデータに依存しており、脊髄損傷を持つ集団への応用は限定的でした。この研究は、これらの既存戦略と生理学に基づいた、実験的に検証可能な刺激パラダイムとの間のギャップを埋めることを目指しています。
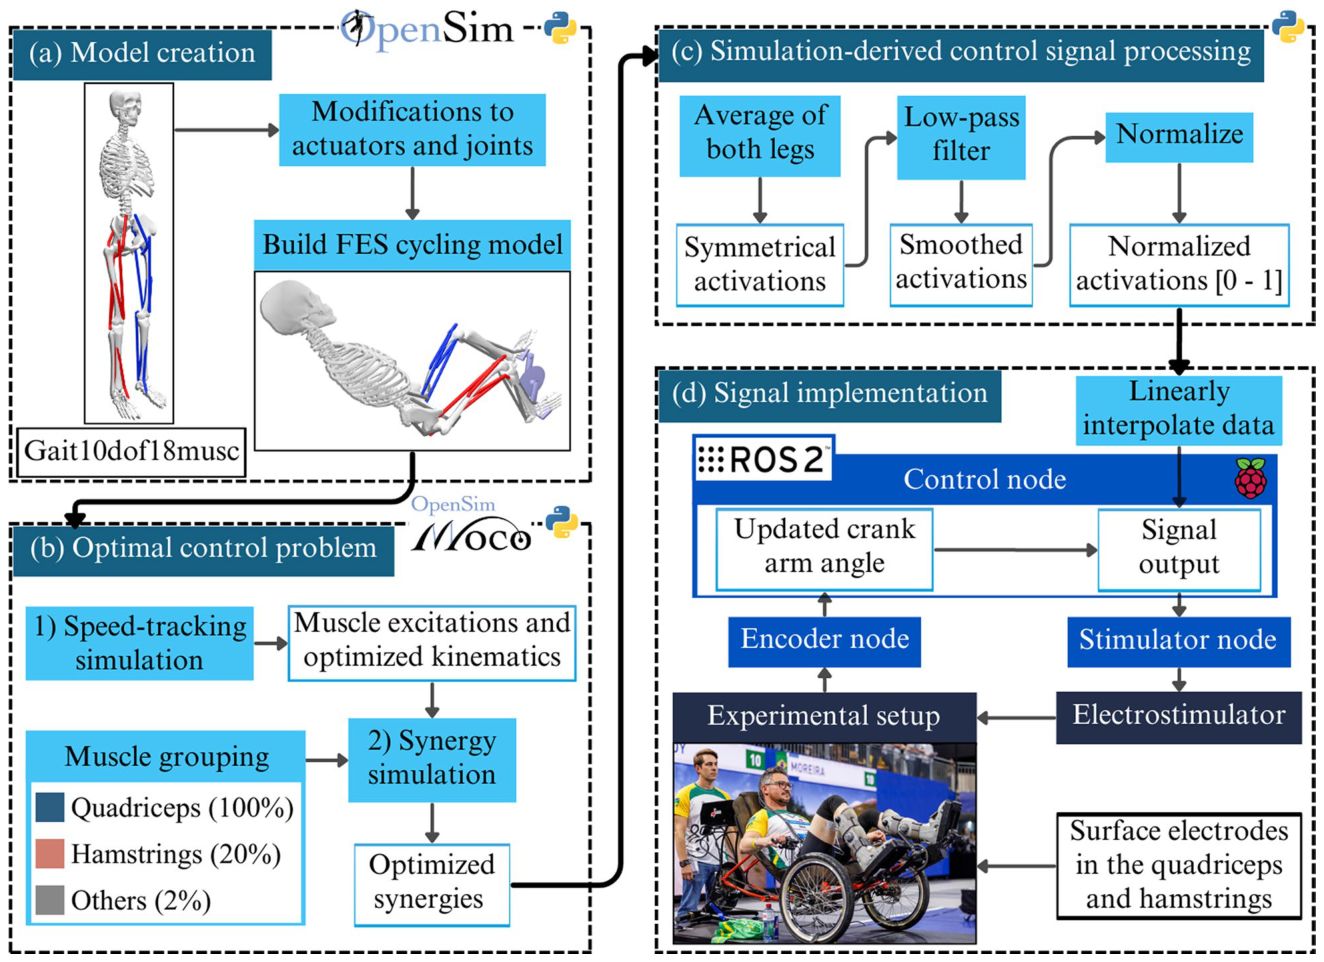
Figure 1. Fig. 1 Overview of the simulation-to-stimulation framework used to generate and experimentally implement a synergy-based FES cycling control signal. (a) Model creation, including modifications to actuators and joints of the base model and the construction of the FES cycling model in OpenSim. (b) Optimal control problem formulation in OpenSim Moco, consisting of a speed-tracking simulation followed by a synergy-based optimization to obtain coordinated and optimized synergies of the quadriceps and hamstrings muscle groups. (c) Post-processing of simulation-derived activations, including bilateral averaging, low-pass filtering, and normalization to obtain smooth, bounded stimulation profiles. (d) Real-time signal implementation using ROS2, where crank angle measurements are used to index the stimulation lookup table and drive the electrical stimulator during experimental cycling. Pilot and investigator image rights: (ETH Zurich / CYBATHLON / Alessandro Della Bella)解説: 筋骨格モデルの作成からFESサイクリングの制御信号(CS)の実験的な実装までのプロセス概要図。モデル作成、最適制御問題の定式化、シミュレーション由来の活性化信号の処理、そしてリアルタイムでの信号実装の各ステップが示されている。
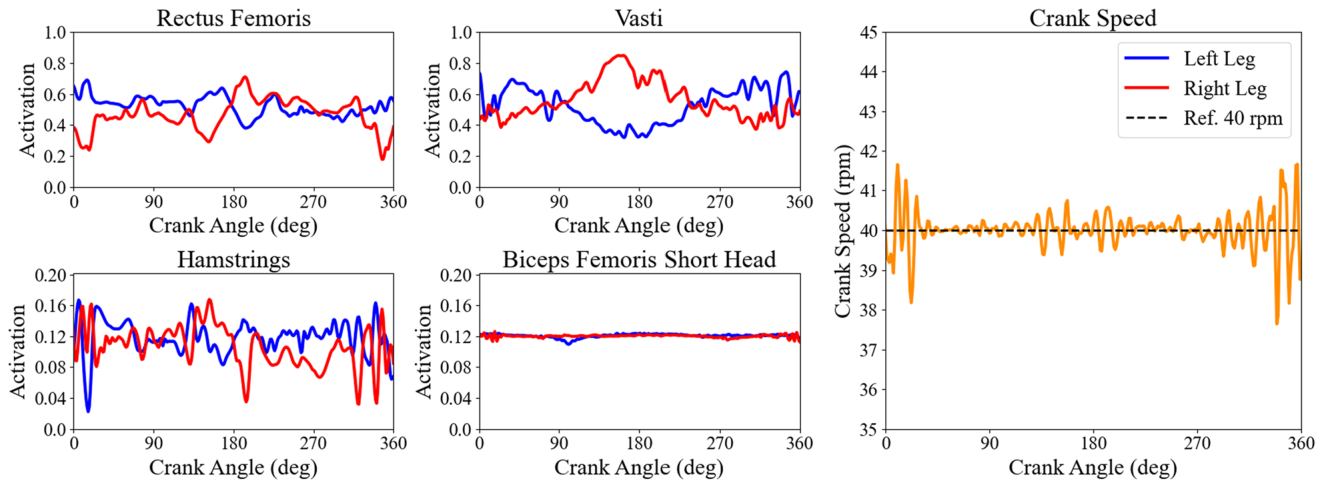
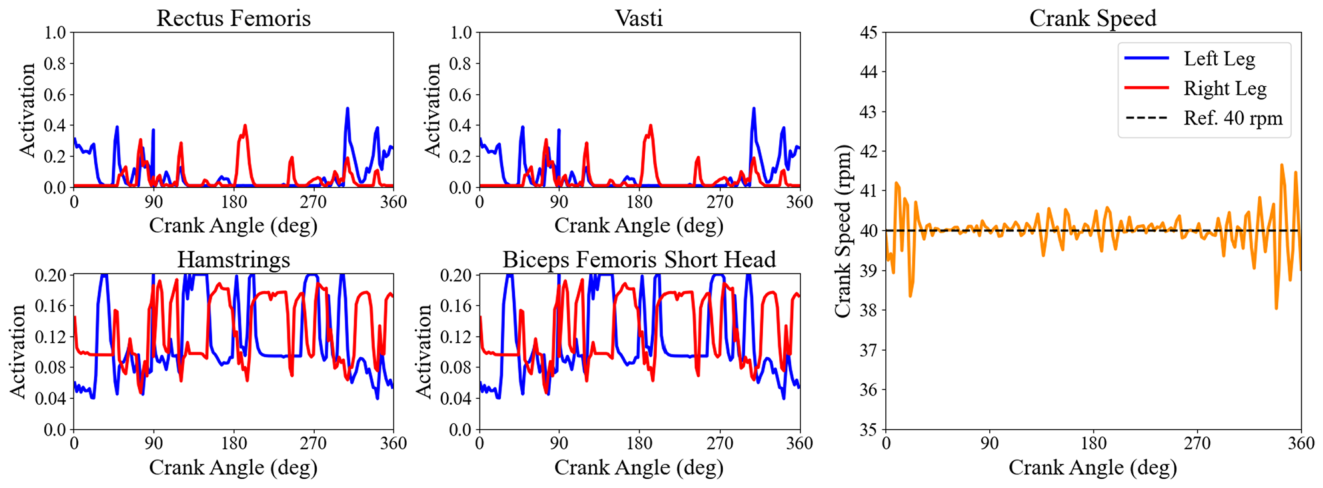
Figure 4. Fig. 4 Muscle activations and optimized kinematics. Muscle activations obtained from the speed-tracking simulation for rectus femoris, vasti, hamstrings, and biceps femoris short head over a full 360inline-eq-IEq46 crank cycle starting from the left crank at top dead center position. Blue lines represent the left leg and red lines the right leg. The quadriceps muscles display the expected cyclic activation pattern aligned with the knee extension phases, while the hamstrings re main close to their imposed 20% activation limit. The yellow line shows the instantaneous crank cadence, which tracks the constant reference speed of 40 rpm during the simulated revolution. These muscle activations and kinematics were the basis for the subsequent synergy-based optimal control problem解説: 速度追跡シミュレーションから得られた大腿直筋、広筋、ハムストリング筋、大腿二頭筋短頭の筋活性化と最適化された運動学を示す図。左脚(青)と右脚(赤)の筋活性化パターンが360度のクランクサイクルにわたって示され、黄色の線は40 rpmの目標ケイデンスを追跡していることを示している。
Figure 5. Fig. 5 Optimized synergies. Synergy muscle activations after solving the second optimal control problem, following the reference kinematics from the speed-tracking problem, and minimizing muscle excitations. Blue and red curves represent the left and right leg activations, respectively. Rectus femoris and vasti activate under one quadriceps synergy, while the hamstrings and biceps femoris short act under one hamstrings synergy with the same 20% activation limitation. The yellow cadence curve confirms that the synergy-based results preserved the optimized kinematics from the speed-tracking simulation within the prescribed tolerances解説: 筋シナジー最適制御問題の解決後に得られた最適化されたシナジー筋活性化の図。大腿直筋と広筋が一つの大腿四頭筋シナジーの下で、ハムストリング筋と大腿二頭筋短頭が一つのハムストリング筋シナジーの下で活性化する様子が示されている。黄色のケイデンス曲線は、速度追跡シミュレーションから得られた運動学が保持されていることを示している。
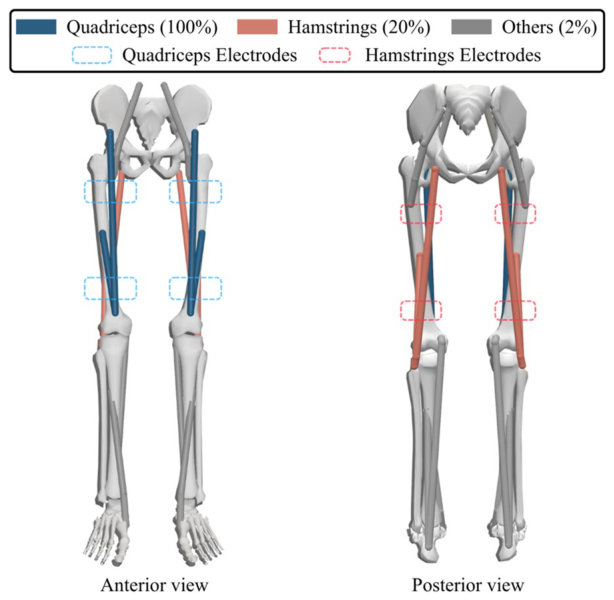
Figure 2. Fig. 2 Muscle grouping and electrode placement used for synergy-based FES cycling control. Muscles in the cycling model are grouped accord ing to anatomical function and surface stimulation feasibility, forming six muscle groups per leg: iliopsoas, quadriceps, tibialis anterior, gluteus maximus, hamstrings, and triceps surae. Anterior and posterior views il lustrate the muscles included in each group and the corresponding sur face electrode placements for the quadriceps and hamstrings, which were the only groups actively stimulated in this study. Dashed outlines indicate electrode placement, highlighting the correspondence between simu lated muscle groups and experimentally available stimulation channels解説: 筋シナジーベースのFESサイクリング制御に用いられる筋群のグループ化と電極配置を示した図。大腿四頭筋(青)とハムストリング筋(赤)が、それぞれ対応する表面電極(点線)によって刺激される様子が示されている。
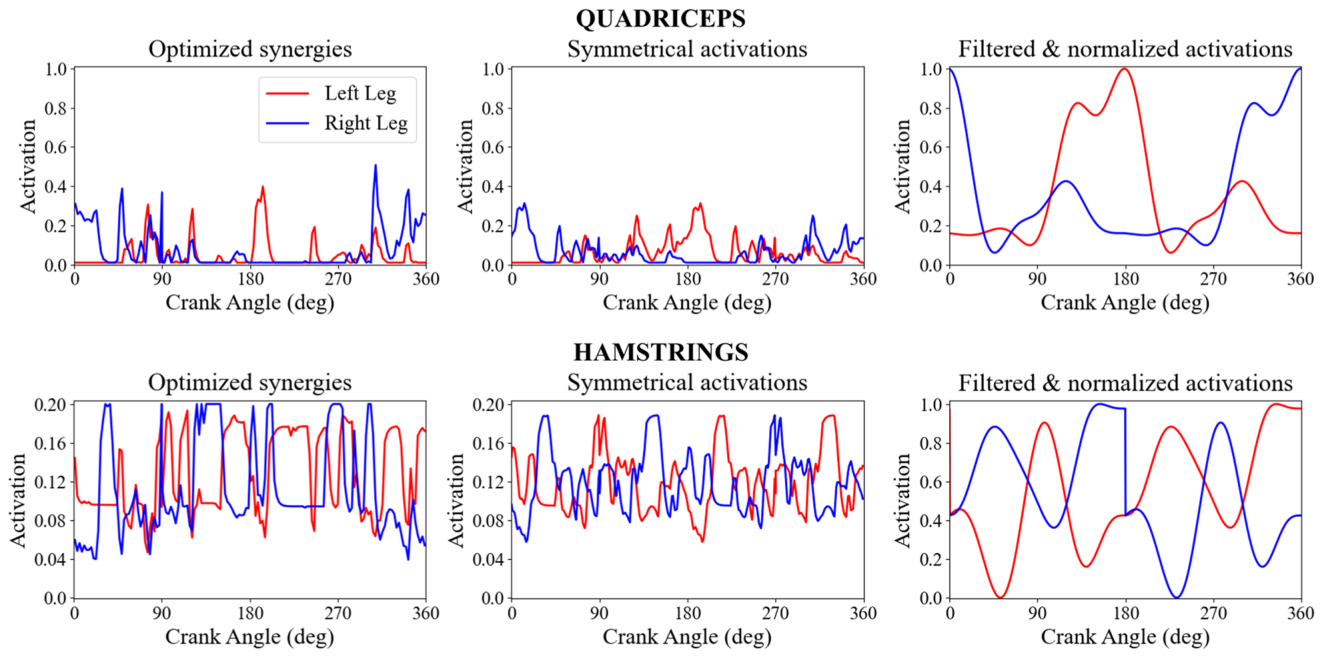
Figure 3. Fig. 3 Post-processing of the synergy-derived activation signals for the quadriceps and hamstrings muscle groups. Left-leg (blue) and right-leg (red) activations were averaged to generate a symmetrical pattern, filtered to remove sudden activation transitions, and normalized from 0 to 1 to compensate for the doubled isometric force from the model, reserve actuators, and the less efficient surface stimulation. Before normalization, the hamstrings ranged from 0 to 0.2, reflecting the constrained activation range in this muscle group. The filtered and normalized signals represent the final stimulation profile for the quadriceps and hamstrings muscle groups implemented in real time during the experimental trials解説: 筋シナジーから導出された大腿四頭筋およびハムストリング筋群の活性化信号の後処理を示した図。左右の脚の活性化を平均化し、フィルター処理と正規化を施して、滑らかで境界のある最終的な刺激プロファイルを得る過程が示されている。
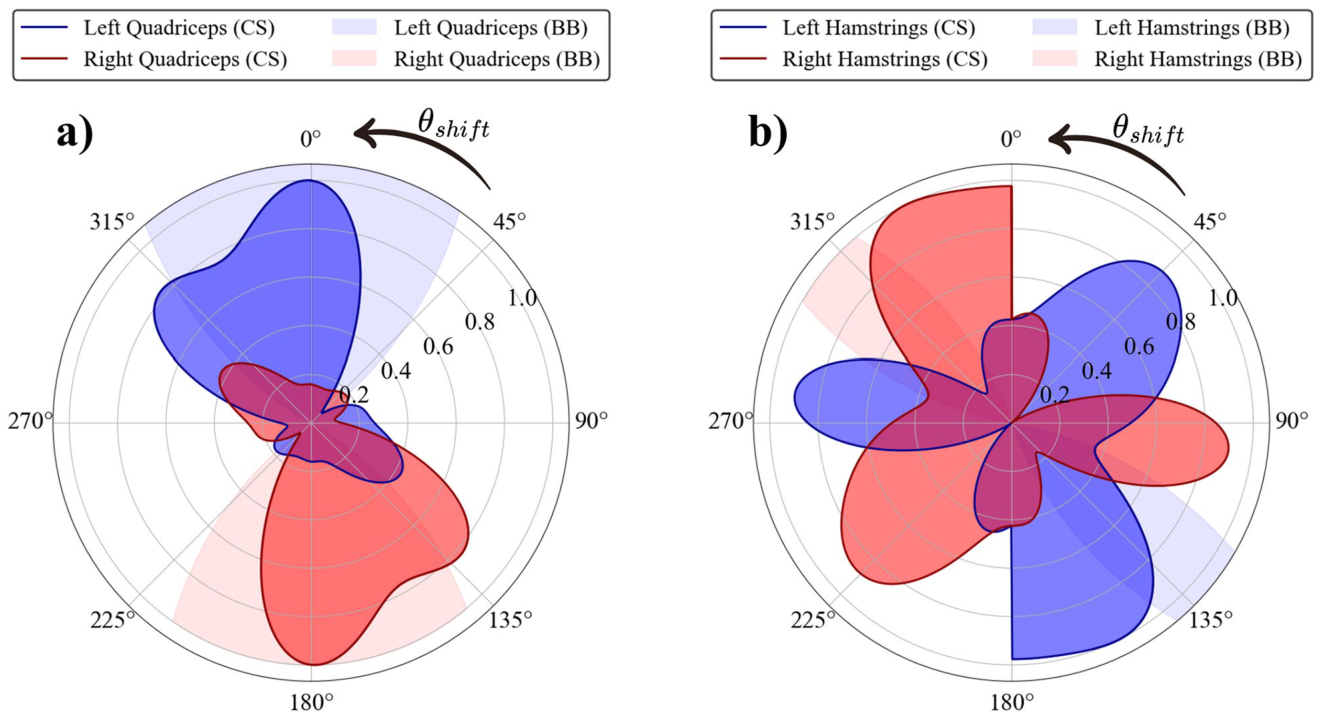
Figure 6. Fig. 6 Polar representations of the two stimulation profiles used in the experimental protocol at maximum activation. Both panels illustrate the signals at 40 rpm as indicated by inline-eq-IEq47. The simulation-derived control signal (CS), is presented in the darker blue and red colors, and the empirically tuned bang- bang (BB) protocol, used during the Cybathlon 2024 edition, in the shaded blue and red areas. Blue curves represent left-leg activation and red curves represent right-leg activation across the 360inline-eq-IEq48 crank cycle. The left crank at top dead center marks the 0inline-eq-IEq49 and 360inline-eq-IEq50 angles. CS exhibits smooth, graded activation, while BB displays discrete activation windows, combined with linear 20inline-eq-IEq51 ramp-up and ramp-down transitions at the onset and offset of each window. Panel a) illustrates the normalized quadriceps activations according to the crank angle. Meanwhile, panel b) depicts the hamstrings activations. The BB stimulation was intentionally asymmetric, effectively resulting in higher activations in the left leg during this protocol解説: 実験プロトコルで使用された最大活性化時の2つの刺激プロファイルを極座標で示した図。シミュレーション由来の制御信号(CS)と、経験的に調整されたバングバン(BB)プロトコルの左右の脚の活性化パターンをクランク角度に対して示しており、CSは滑らかで段階的な活性化を、BBは離散的な活性化ウィンドウを示している。
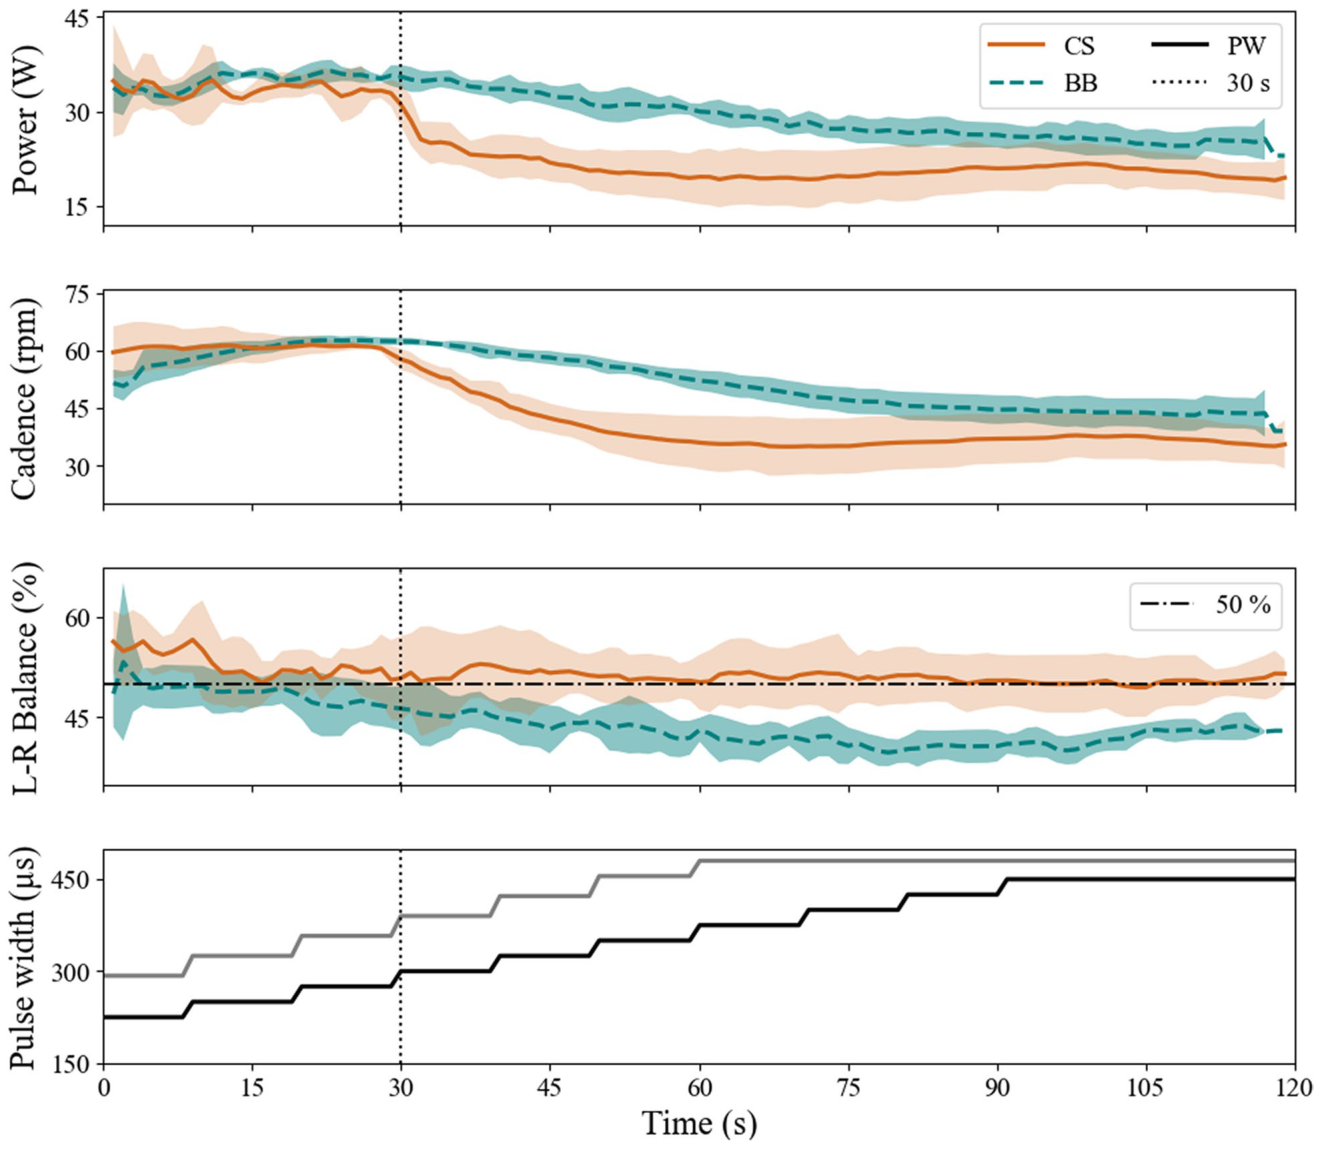
Figure 7. Fig. 7 Experimental comparison of the averaged 4 sessions cycling metrics between the empirical bang-bang signal (BB), in dashed teal curves, and the simulation-derived control signal (CS), in solid orange curves, with their respective deviations for 120 s. From top to bottom, the metrics are: power output (W), crank cadence (rpm), left-right balance (%), and the automated increasing pulse width (inline-eq-IEq52s), in a solid black curve for the CS and BB in the right leg, and in a solid gray curve for the asymmetric BB stimulation in the left leg. The black dotted vertical lines at the 30-second mark indicate the start of unassisted FES cycling解説: 経験的なバングバン信号(BB)とシミュレーション由来の制御信号(CS)を比較した、平均4セッションのサイクリング指標の実験結果を示す図。パワー出力、クランクケイデンス、左右バランス、および自動的に増加するパルス幅が120秒間にわたって示されている。
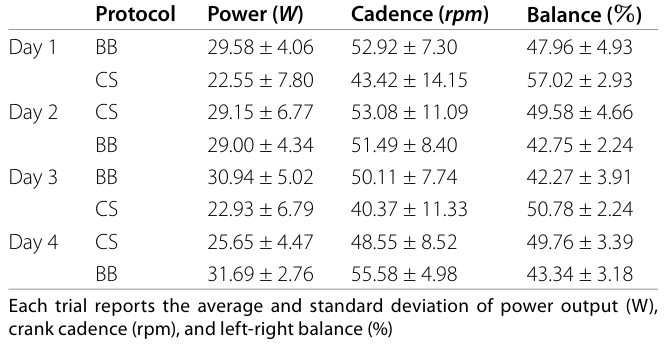
Table 1. Table 1 Summary of cycling performance metrics collected on non-consecutive days with alternating protocol order, simulation-derived control signal (CS), and bang-bang control (BB)解説: シミュレーション由来の制御信号(CS)とバングバン(BB)制御を交互に実施した非連続的な日々に収集されたサイクリングパフォーマンス指標の要約表。各試験のパワー出力、クランクケイデンス、左右バランスの平均値と標準偏差が示されている。
コメントを残す