どうも、Beyond the Pixelです。近年、デジタル病理学において、大量のデータから学習する財団モデル(Foundation Model)の活用が急速に進んでいます。これらのモデルは、診断支援やインタラクティブなAIツールなど、さまざまな場面で利用されています。しかし、この財団モデルが病理組織像の異なる倍率間でどれほどの性能を発揮するのか、また、学習時の倍率サンプリング戦略が表現の質にどのような影響を与えるのかについては、これまで十分に解明されていませんでした。本記事では、この課題に焦点を当てた画期的な研究論文「Mind the Gap: Continuous Magnification Sampling for Pathology Foundation Models」を紹介します。
従来の倍率サンプリングの課題
病理専門家は、広範囲な組織構造を低倍率で観察する一方で、細胞の微細な形態を高倍率で詳細に分析します。しかし、従来の病理学における財団モデルの事前学習では、通常、0.25、0.5、1.0、2.0 mpp(microns per pixel)といった限られた離散的な倍率(スキャナーの解像度)から均一に画像をサンプリングする手法が広く採用されてきました。このアプローチは多くのベンチマークで性能向上を報告していますが、その理論的根拠は不明確でした。この研究では、このような離散的なサンプリングが、中間的な倍率での性能低下を引き起こす可能性を指摘しています。つまり、財団モデルの性能は、倍率によって大きく変動する可能性があるのです。
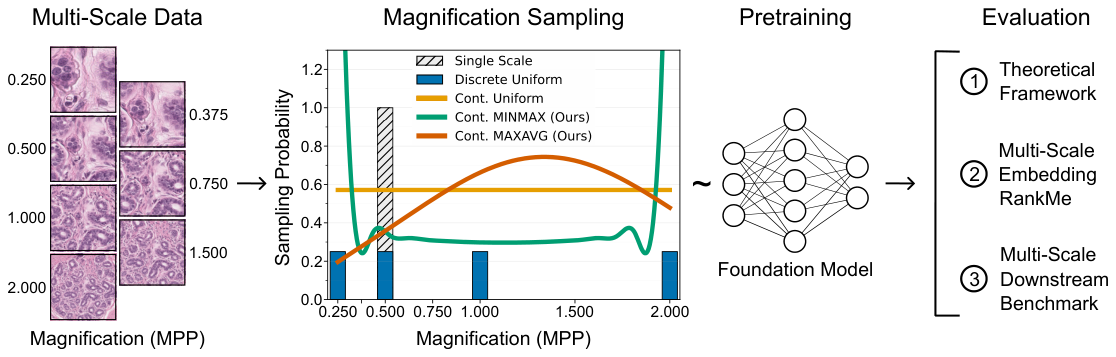
Figure 1. Figure 1: Overview of our approach. We derive novel, principled magnification sampling strategies to pretrain vision foundation models (FMs) from multi-scale histopathology data and compare them to established discrete magnification sampling protocols (MPP = microns per pixel). For evaluation, we introduce three techniques to measure FM embedding quality across magnifications: (1) a data-free theoretical domain adaptation framework for magnification sampling, (2) a RankMe score to quantify the information richness of a model’s embedding space, and (3) a multi-scale predictive performance benchmark for FM-derived downstream models. Together, these evaluations provide a comprehensive view of the magnification performance profile of new and established pathology foundation models.解説: 本アプローチの概要を示しています。マルチスケール病理データから、新しい原理に基づいた倍率サンプリング戦略を導出し、財団モデルの事前学習に適用します。評価は、理論的枠組み、RankMeスコア、およびマルチスケールダウンストリームベンチマークの3つの手法で行われます。
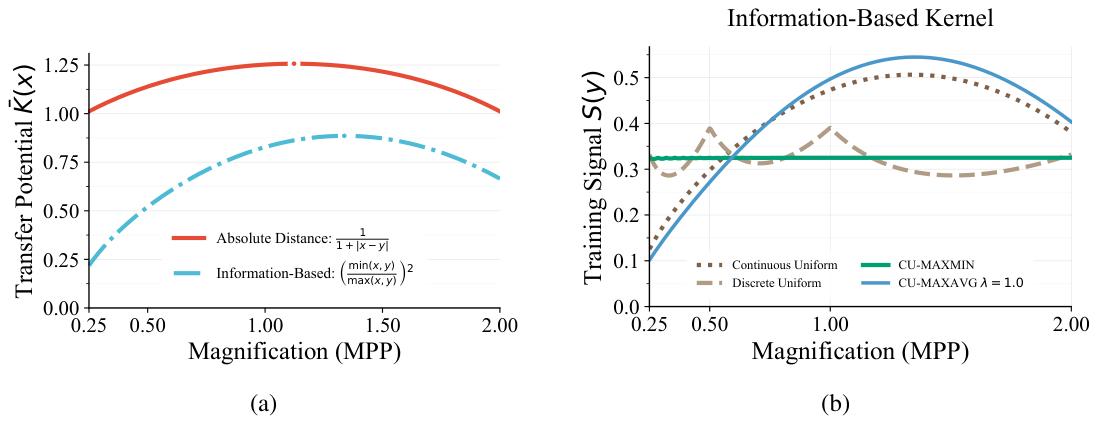
Figure 2. Figure 2: Properties of the domain adaptation framework. (a) Transfer potential ¯K(x) for three similarity kernels across the magnification range. Central magnifications exhibit higher transfer potential due to shared visual features with neighboring scales, while boundary magnifications show reduced potential. (b) Accumulated Training Signal S(y) for the “Information-Based Kernel” for the continuous uniform and discrete sampling distributions. Continuous uniform sampling leads to systematic degradation at boundaries (Proposition 1), while discrete sampling creates gaps at intermediate magnifications.解説: (a) 3つの類似度カーネルに対する転送ポテンシャルK(x)を示しています。中央の倍率がより高い転送ポテンシャルを示す一方、両端の倍率では低下しています。(b) 「情報ベースカーネル」に対する連続均一サンプリングおよび離散サンプリング分布の蓄積された学習信号S(y)を示しています。連続均一サンプリングは端部での体系的な性能低下を引き起こし、離散サンプリングは中間倍率にギャップを生じさせます。
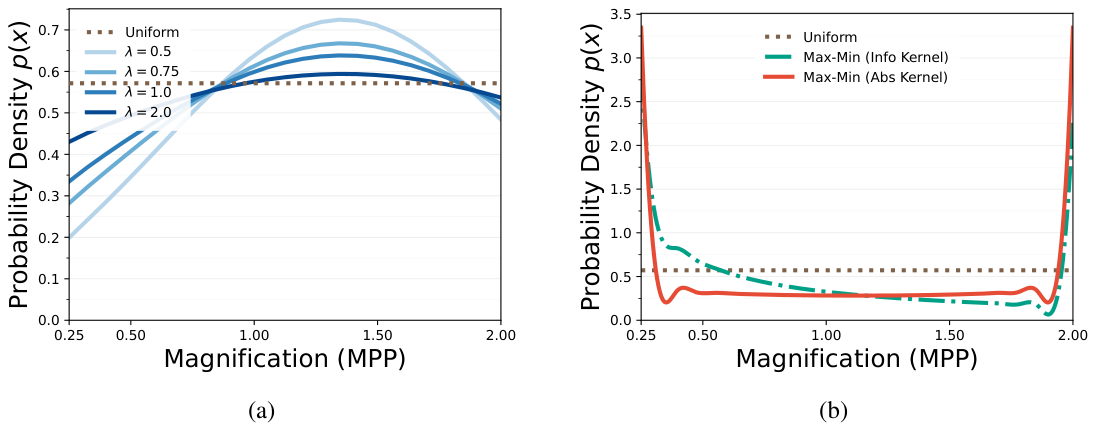
Figure 3. Figure 3: Optimized magnification sampling distributions. (a) Sampling distributions from max- average optimization with entropy regularization for the information-based kernel. As the regu- larization parameter λ increases, the optimal distribution shifts from sampling more prototypical magnifications near the center to near-uniform. (b) Max-min optimization oversamples boundary magnifications for both kernels.解説: (a) 情報ベースカーネルに対するエントロピー正則化を伴う最大平均最適化からのサンプリング分布を示しています。正則化パラメータλが増加するにつれて、最適な分布は中央に近いプロトタイプ倍率のサンプリングから、ほぼ均一なサンプリングへとシフトします。(b) 両方のカーネルに対する最大最小最適化は、端部倍率をオーバーサンプリングします。
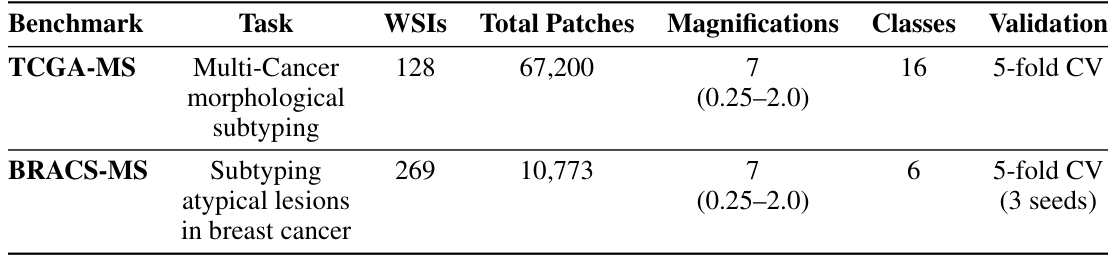
Table 1. Table 1: Statistics of TCGA-MS and BRACS-MS, two new multi-scale benchmarks introduced in this work. Both datasets enable evaluation across seven magnifications (0.25, 0.375, 0.5, 0.75, 1.0, 1.5, 2.0 mpp), filling a gap in the current benchmark landscape. Benchmark Task WSIs Total Patches Magnifications Classes Validation解説: 本研究で導入された2つの新しいマルチスケールベンチマーク、TCGA-MSとBRACS-MSの統計情報です。両データセットは、7つの倍率(0.25~2.0 mpp)にわたる評価を可能にし、既存のベンチマークにはなかったギャップを埋めます。
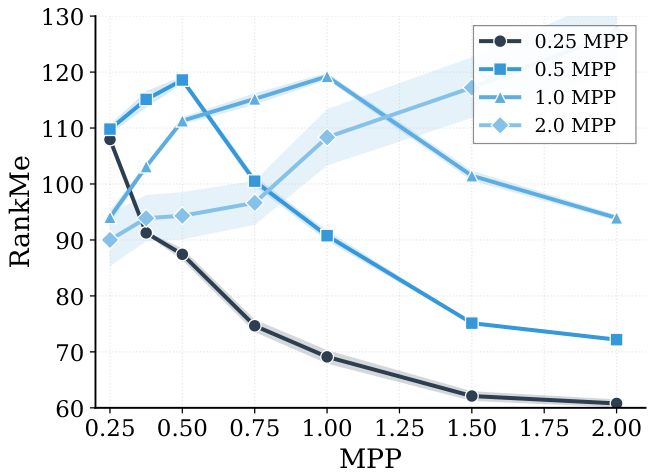
Figure 4. Figure 4: Representation quality across magnifications for single-scale models trained on different magnifications. Each line represents a model trained at the magnification indicated in the legend. Models exhibit smooth degradation in RankMe scores as evaluation magnification moves away from training magnification.解説: 異なる倍率で学習された単一倍率モデルの倍率全体にわたる表現品質を示しています。各線は凡例に示された倍率で学習されたモデルを表します。評価倍率が学習倍率から離れるにつれて、モデルのRankMeスコアは滑らかに低下する傾向を示します。
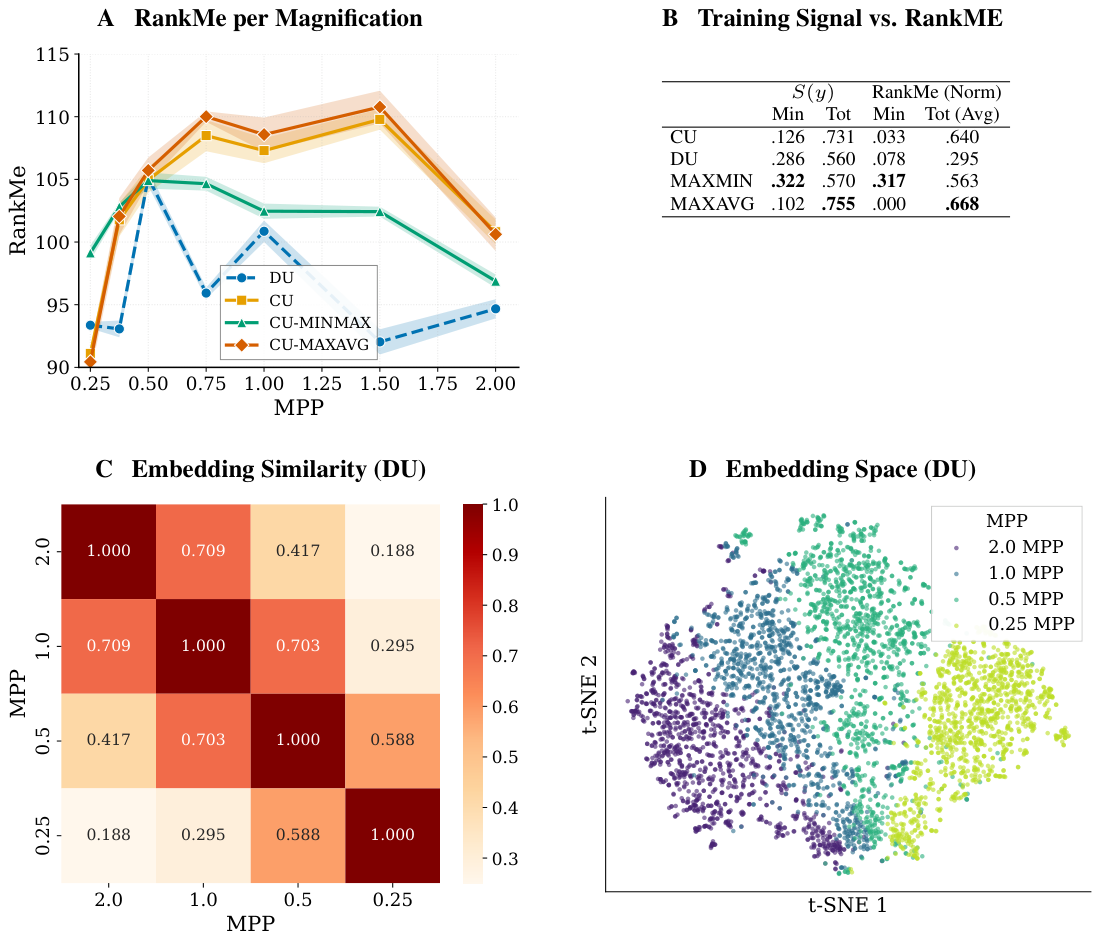
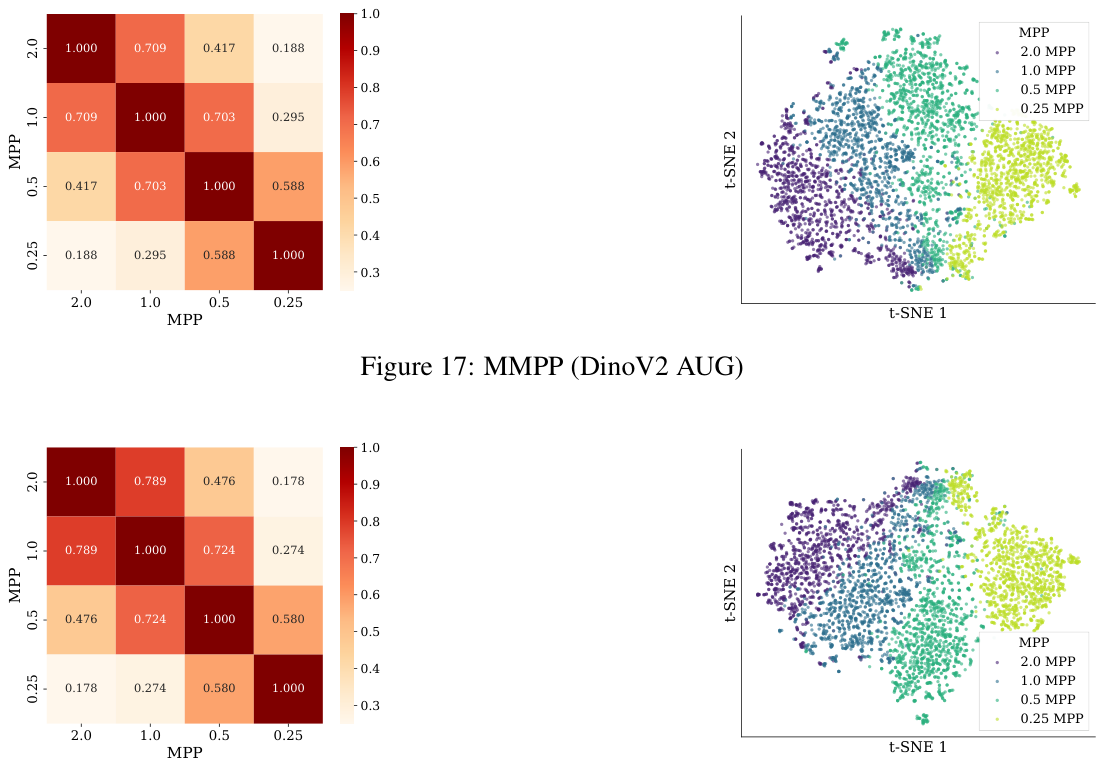
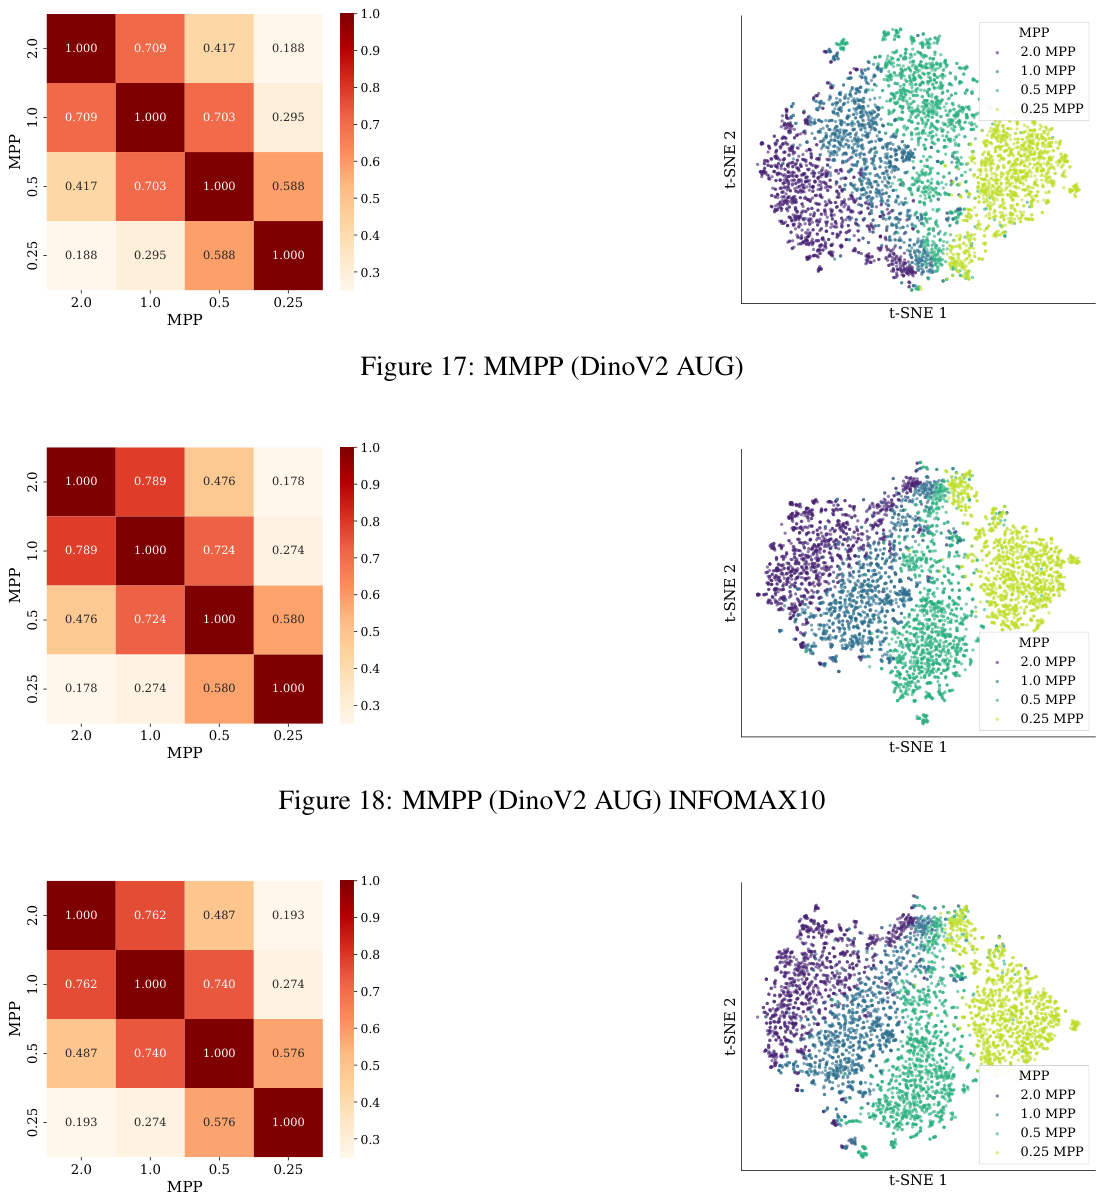
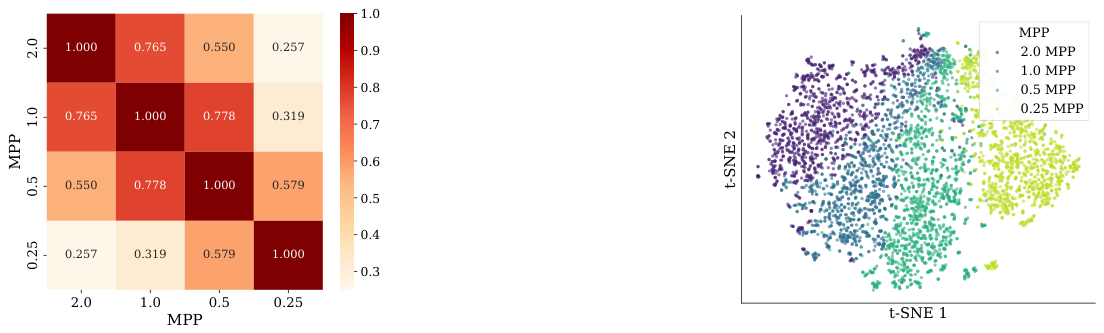
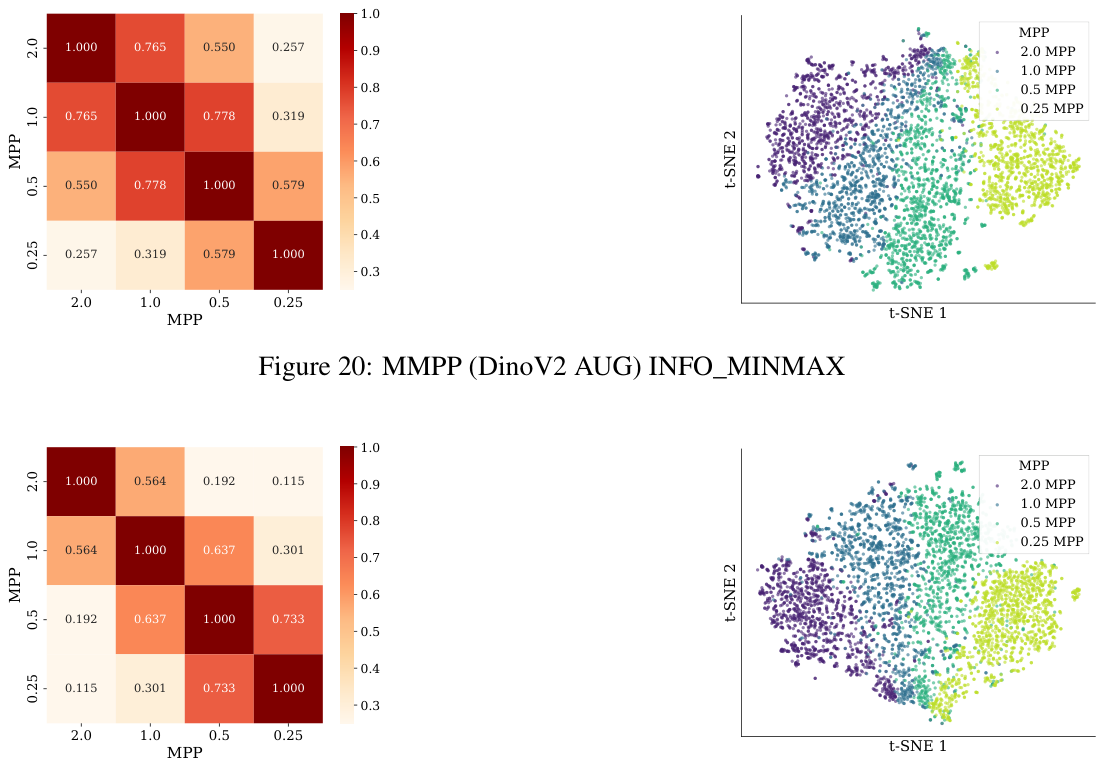
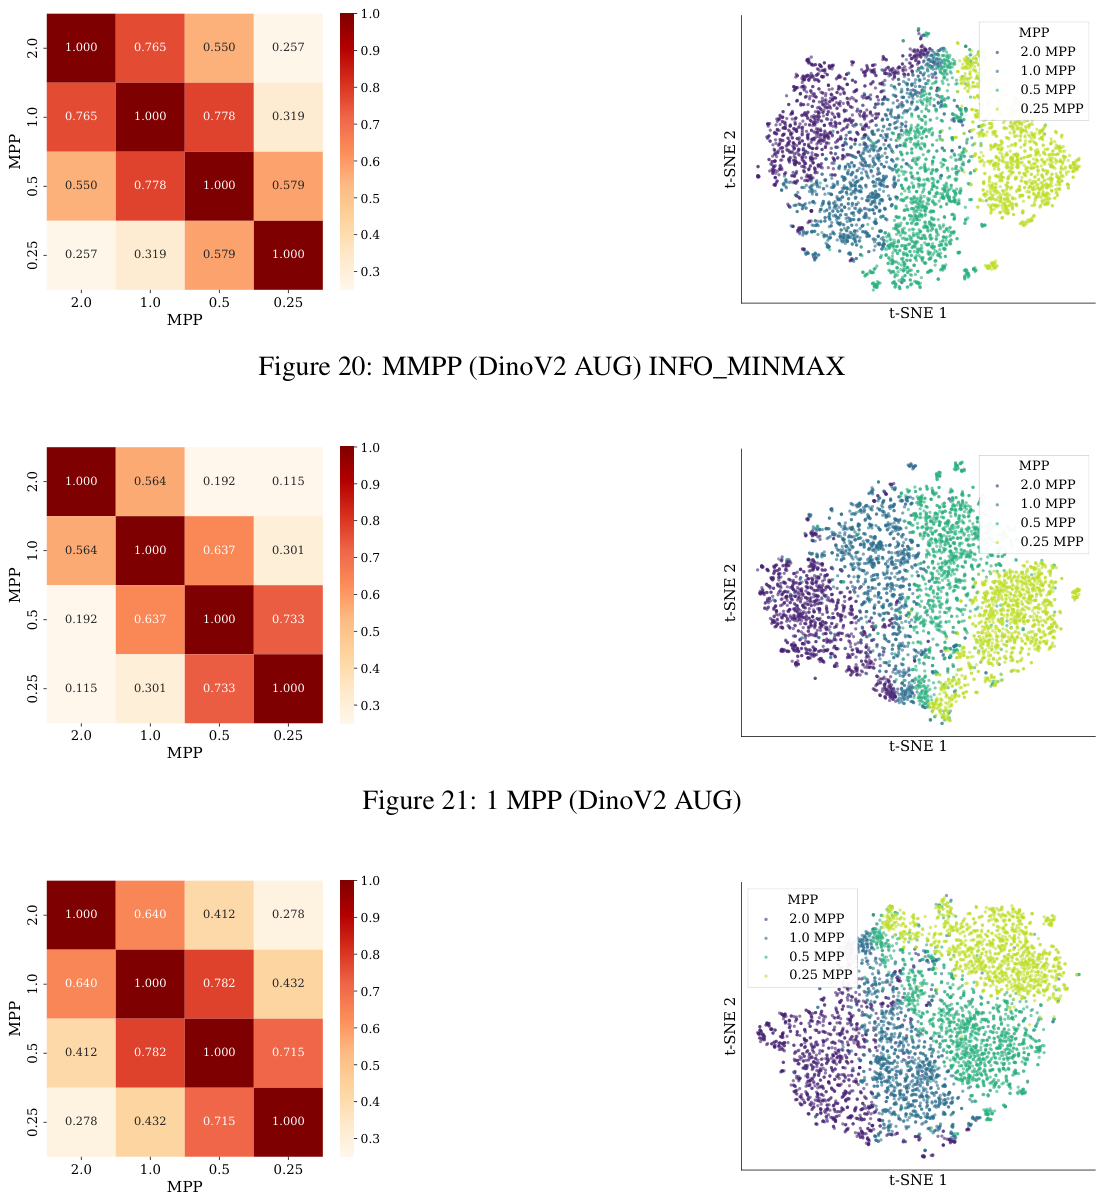
Figure 5. Figure 5: Representation quality and embedding space organization in multi-scale models. (A) RankMe profiles across magnifications: discrete uniform sampling (DU) shows dips at intermediate scales, while continuous strategies produce smooth profiles. (B) Minimal and overall theoretical train- ing signal and normalized RankMe scores across sampling strategies. The close alignment between theoretical predictions and measured embedding quality validates our domain adaptation framework. (C) Cosine similarities between embedding centroids at standard magnifications (DU model). Patches from similar magnifications cluster more closely, while larger magnification differences correspond to greater separation in the learned feature space. (D) t-SNE projection of patch embeddings colored by magnification (DU model), showing that scale acts as a continuous organizing dimension.解説: マルチスケールモデルにおける表現品質と埋め込み空間の組織化を示しています。(A) 倍率ごとのRankMeプロファイル:離散均一サンプリング(DU)は中間スケールで低下を示す一方、連続戦略は滑らかなプロファイルを作成します。(B) 理論的な最小および全体的な学習信号と、サンプリング戦略ごとの正規化されたRankMeスコアの比較。理論的予測と測定された埋め込み品質が密接に一致しており、ドメイン適応フレームワークの妥当性を検証しています。(C) 標準倍率(DUモデル)における埋め込み重心間のコサイン類似度:類似した倍率のパッチはより密接にクラスターを形成し、倍率差が大きいほど学習された特徴空間での分離が大きくなります。(D) 倍率によって色分けされたパッチ埋め込みのt-SNE投影(DUモデル):スケールが連続的な組織化次元として機能していることを示しています。
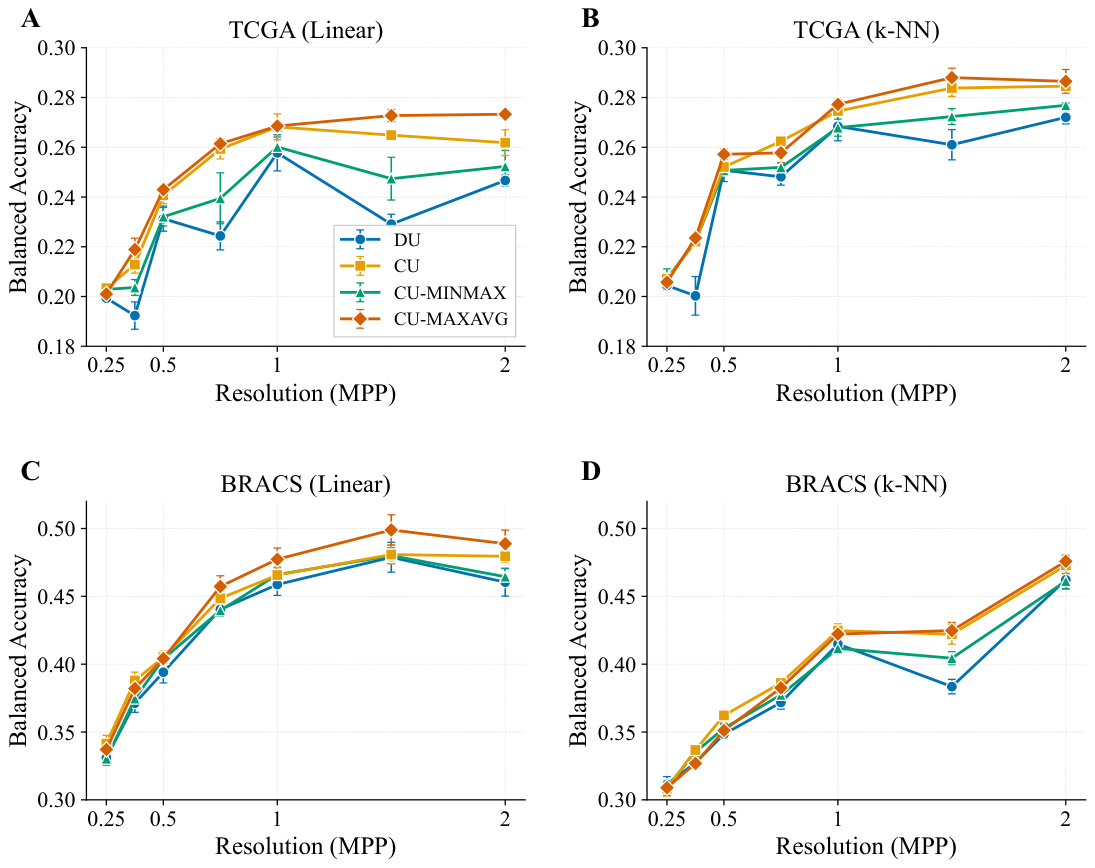
Figure 6. Figure 6: Multi-scale classification performance across benchmarks. (A) TCGA-MS with linear classifier. (B) TCGA-MS with a k-NN classifier. (C) BRACS-MS with linear classifier. (D) BRACS- MS with k-NN classifier. All panels show balanced accuracy across resolutions (MPP). Error bars indicate the standard error of the mean over three training seeds.解説: ベンチマーク全体にわたるマルチスケール分類性能を示しています。(A) 線形分類器を用いたTCGA-MS。(B) k-NN分類器を用いたTCGA-MS。(C) 線形分類器を用いたBRACS-MS。(D) k-NN分類器を用いたBRACS-MS。すべてのパネルは解像度(MPP)全体にわたるバランス精度を示しています。エラーバーは3つの学習シードにわたる平均の標準誤差を示します。
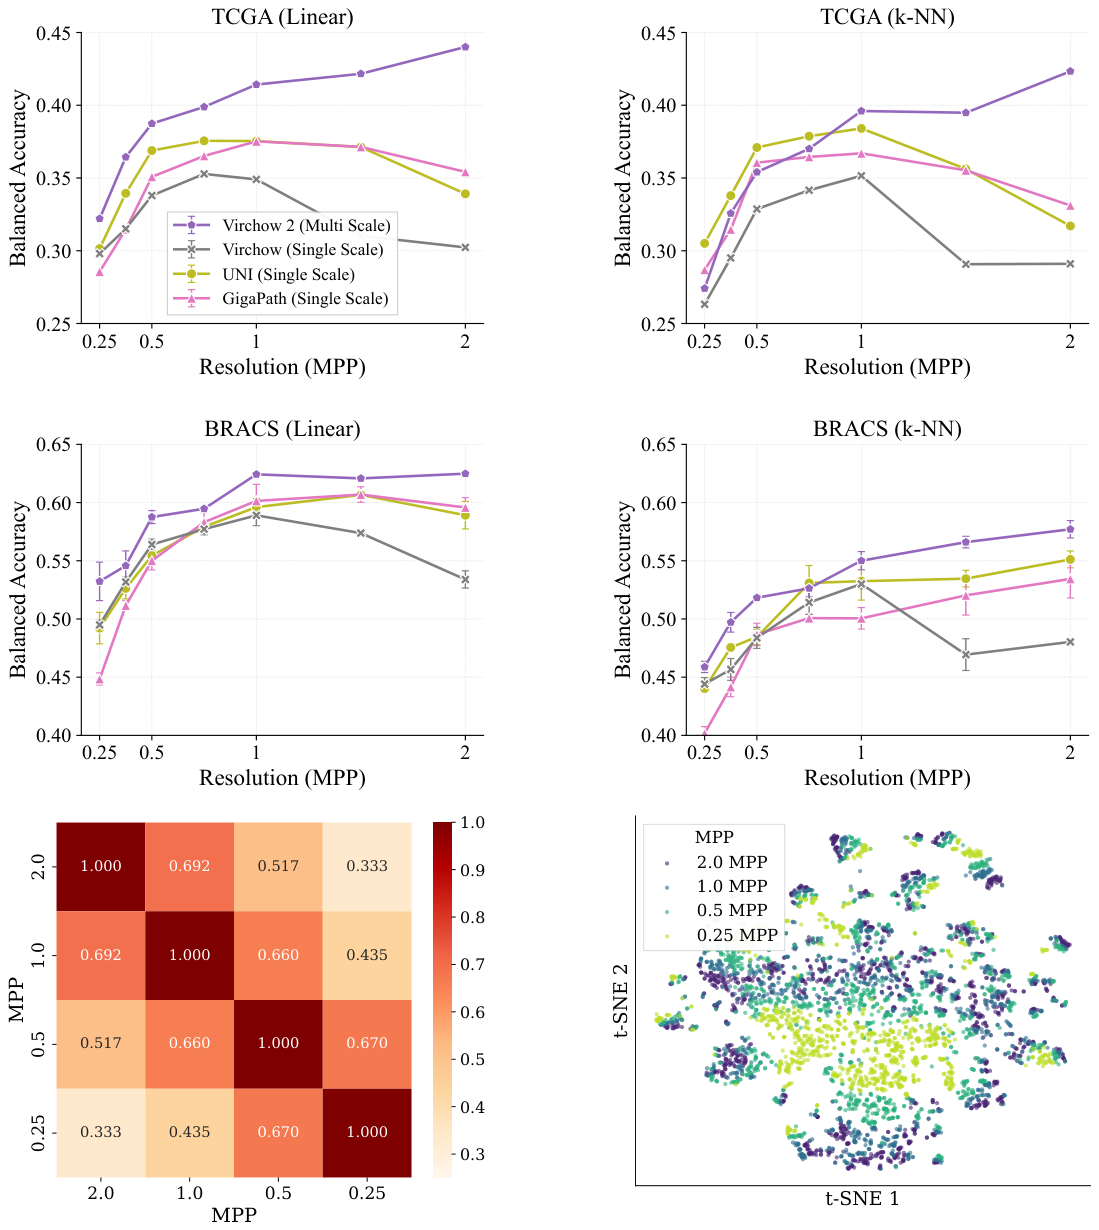
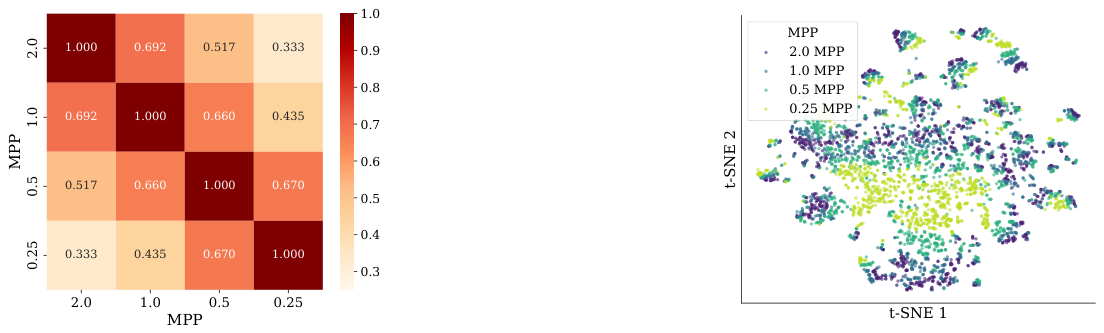
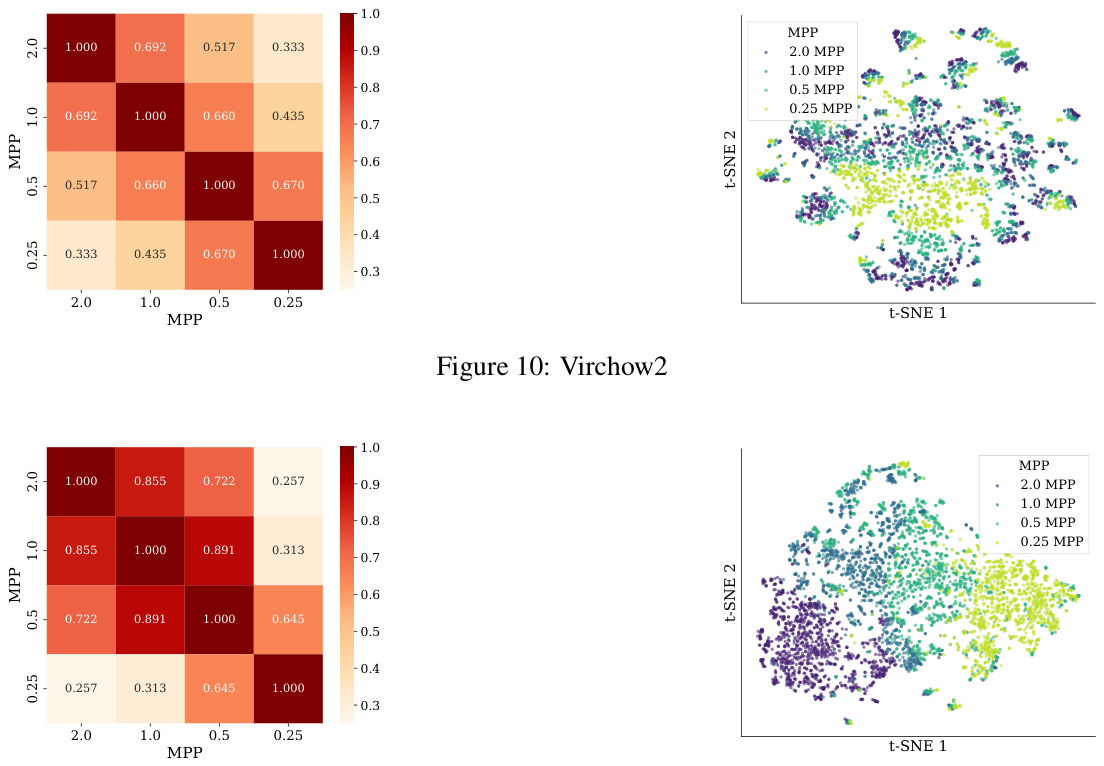
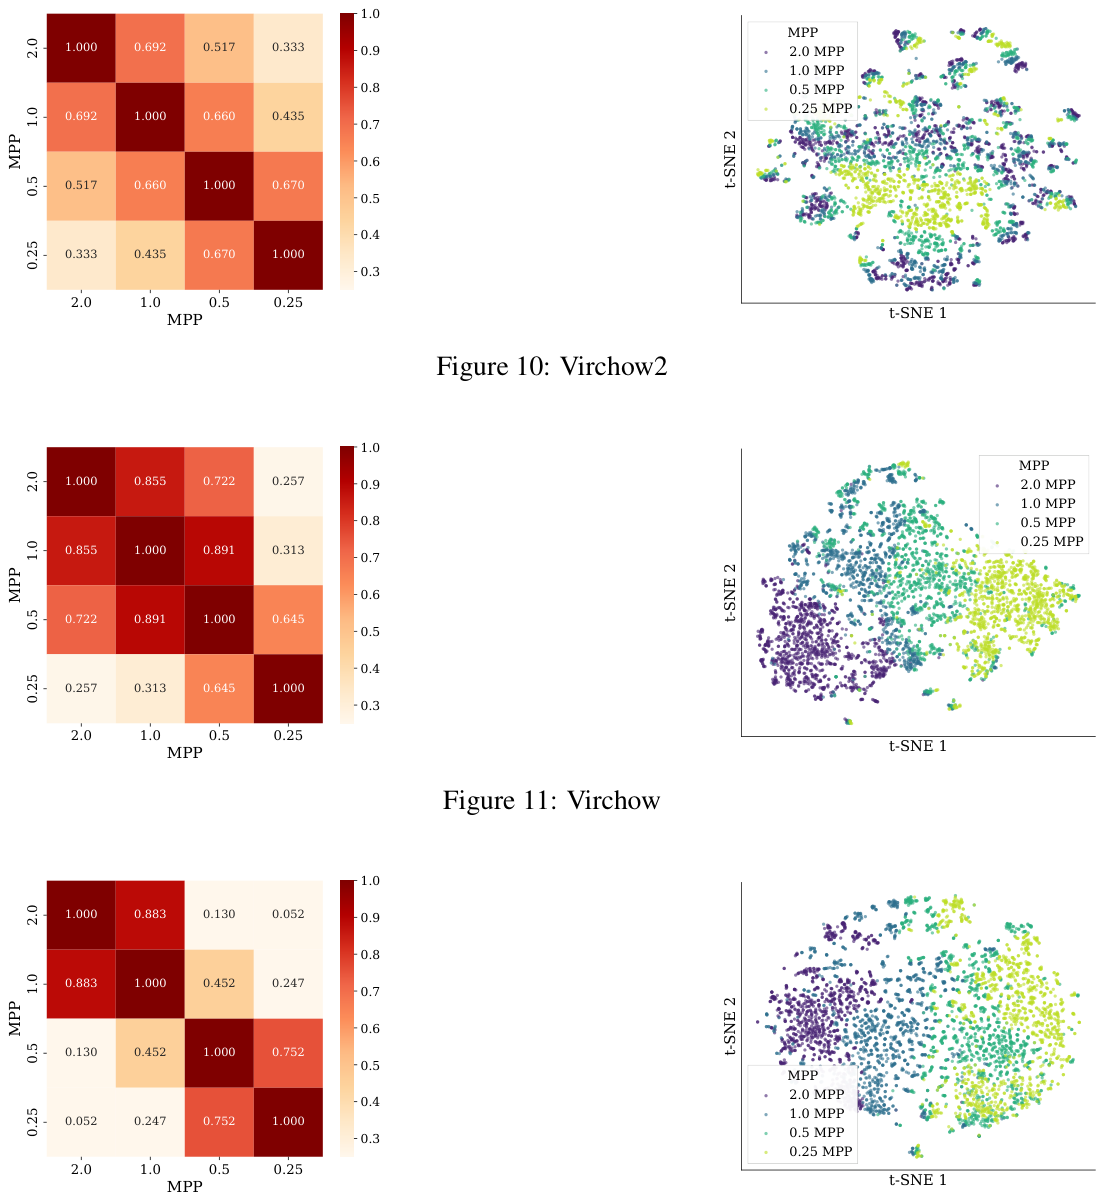
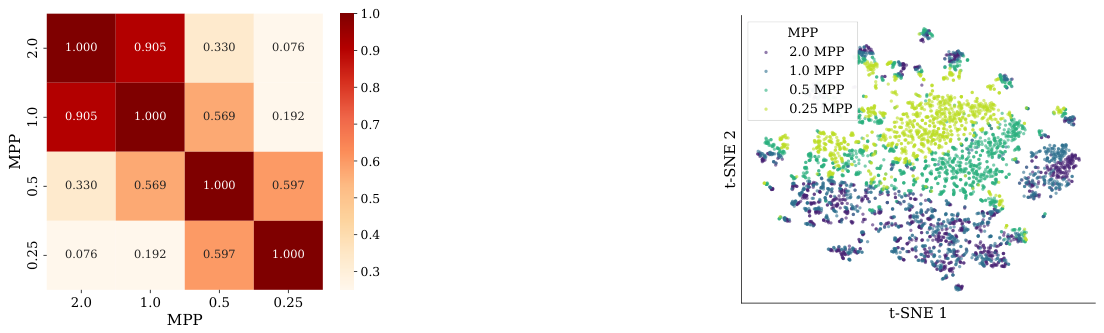
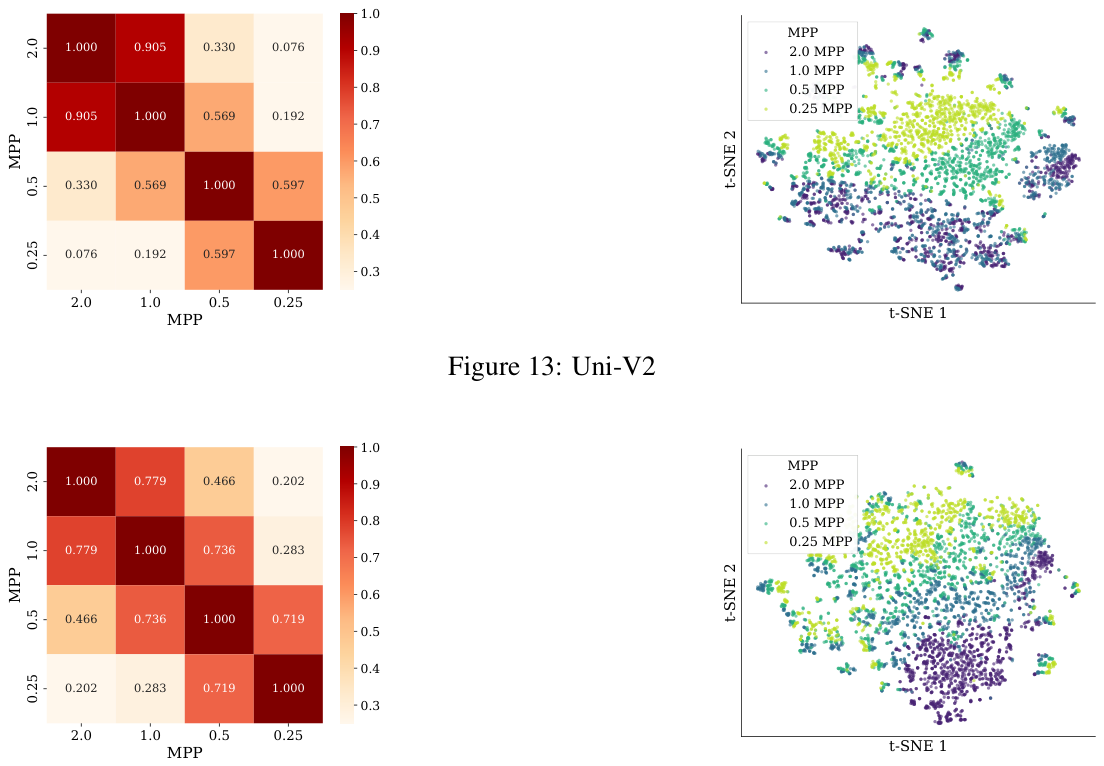
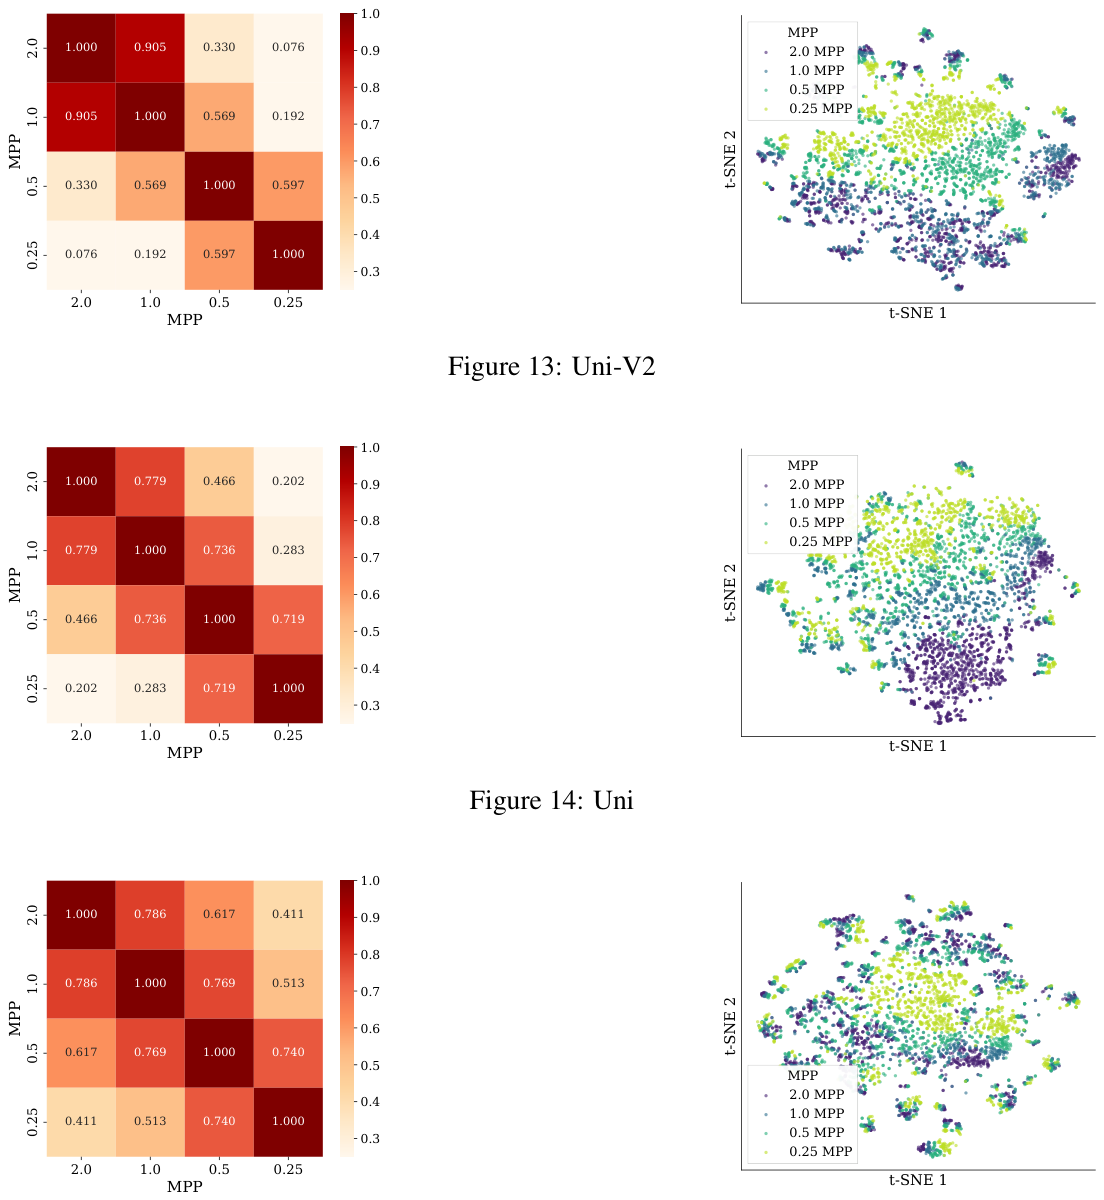
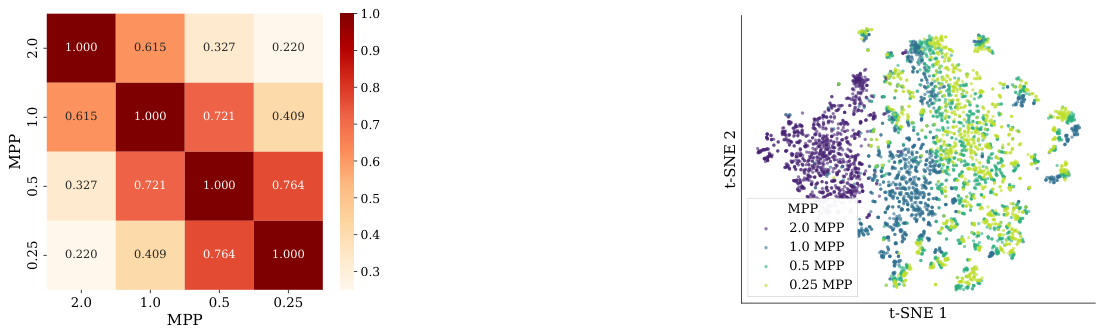
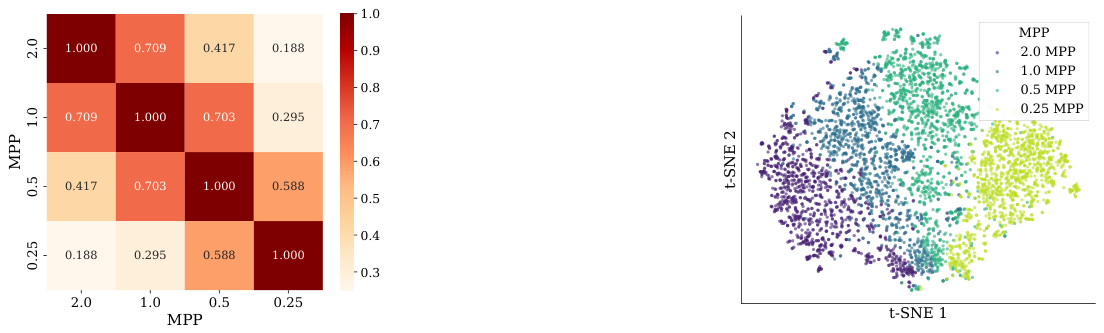
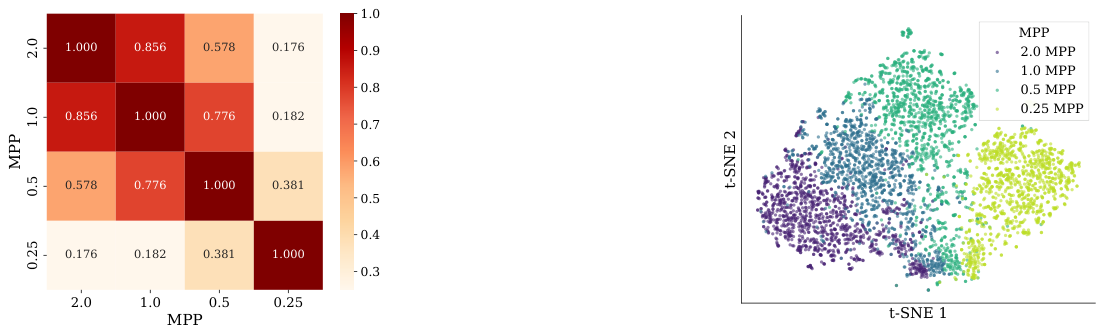
Figure 7. Figure 7: Foundation model evaluation across magnification scales. (Top, Middle) Classification performance on TCGA (top) and BRACS (middle) via linear probe (left) and k-NN (right). Single- scale models degrade at extreme magnifications, particularly at 2.0 mpp, while Virchow2 (multi-scale) maintains robust performance across the spectrum. Nevertheless, performance dips at intermediate magnifications remain evident across both benchmarks. (Bottom) Virchow2 embedding space: cosine similarities between magnification centroids (left) and t-SNE projection (right). Virchow2 exhibits a magnification-dependent embedding structure consistent with our controlled experiments, though with less distinct stratification.解説: 財団モデルの倍率スケール全体にわたる評価結果を示しています。(上、中)TCGA(上)とBRACS(中)における線形プローブ(左)とk-NN(右)による分類性能です。単一倍率モデルは極端な倍率、特に2.0mppで性能が低下する一方、Virchow2(マルチスケール)はスペクトル全体で堅牢な性能を維持しています。しかし、両ベンチマークで中間倍率での性能低下が依然として明らかです。(下)Virchow2の埋め込み空間:倍率重心間のコサイン類似度(左)とt-SNE投影(右)です。Virchow2は、管理された実験と一貫性のある倍率依存の埋め込み構造を示していますが、層別化はそれほど明確ではありません。
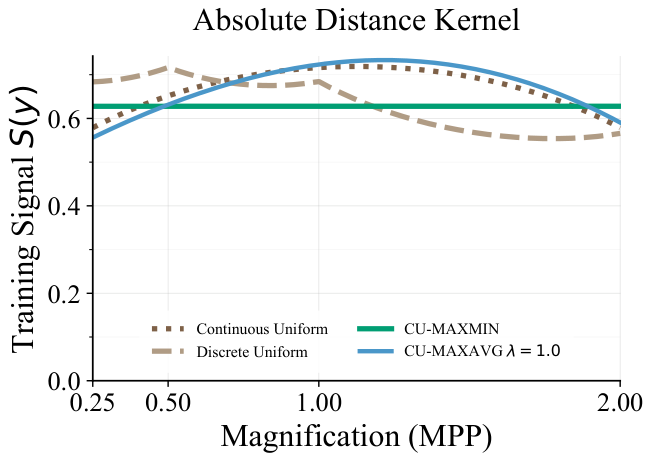
Figure 8. Figure 8: Accumulated training signal S(y) across magnifications under the absolute distance kernel. While the kernel correctly predicts degradation at intermediate magnifications for discrete sampling (DU), it underestimates the magnitude of this effect compared to empirical observations (cf. Figure 5A), motivating our use of the information-based kernel for the primary analysis.解説: 絶対距離カーネルにおける倍率全体の蓄積された学習信号S(y)を示しています。このカーネルは、学習信号が中央に集中する傾向をモデル化しており、特に連続均一サンプリングと離散均一サンプリングでその影響が表れています。
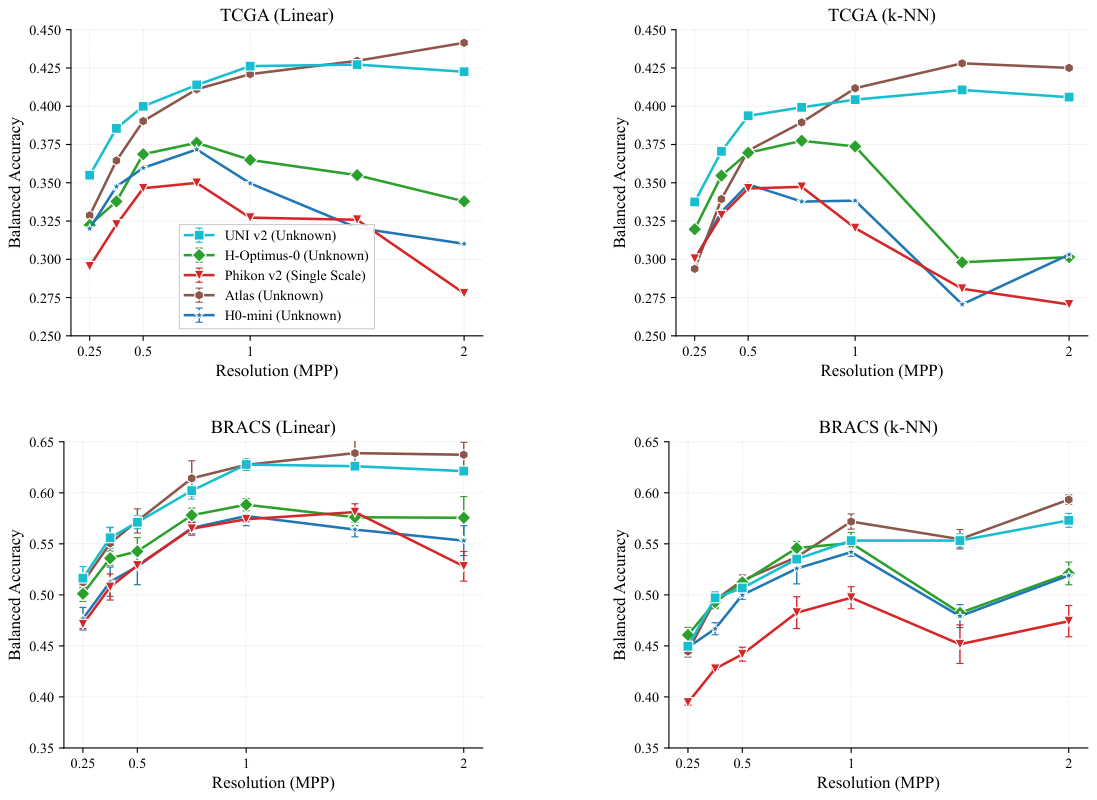
Figure 9
Figure 9. Figure 9: Foundation model evaluation across magnification scales.解説: 追加の財団モデルにおける倍率スケール全体にわたる分類性能を示しています。TCGA(線形、k-NN)およびBRACS(線形、k-NN)の両ベンチマークで、様々なモデルが異なる倍率でどのような精度を示すかを比較しています。

コメントを残す