どうも、Beyond the Pixelです。脳は人間の体で最もエネルギーを必要とする臓器であり、シナプス伝達、神経可塑性、酸化還元恒常性といった複雑な活動を維持するために効率的な代謝プロセスに依存しています。特に思考や意思決定を司る前頭葉におけるエネルギー代謝の障害やミトコンドリア機能不全は、神経変性疾患、神経精神疾患、そして加齢に伴う認知機能の低下と関連が指摘されています。このような脳のエネルギー代謝経路を定量的に調べる強力なツールの一つが、13C標識された基質(例えば[1-13C]グルコース)を投与し、13Cが下流の代謝物(グルタミン酸やグルタミンなど)に組み込まれる様子を追跡する13C磁気共鳴分光法(MRS)です。この技術はこれまで前臨床研究で広く応用されてきました。
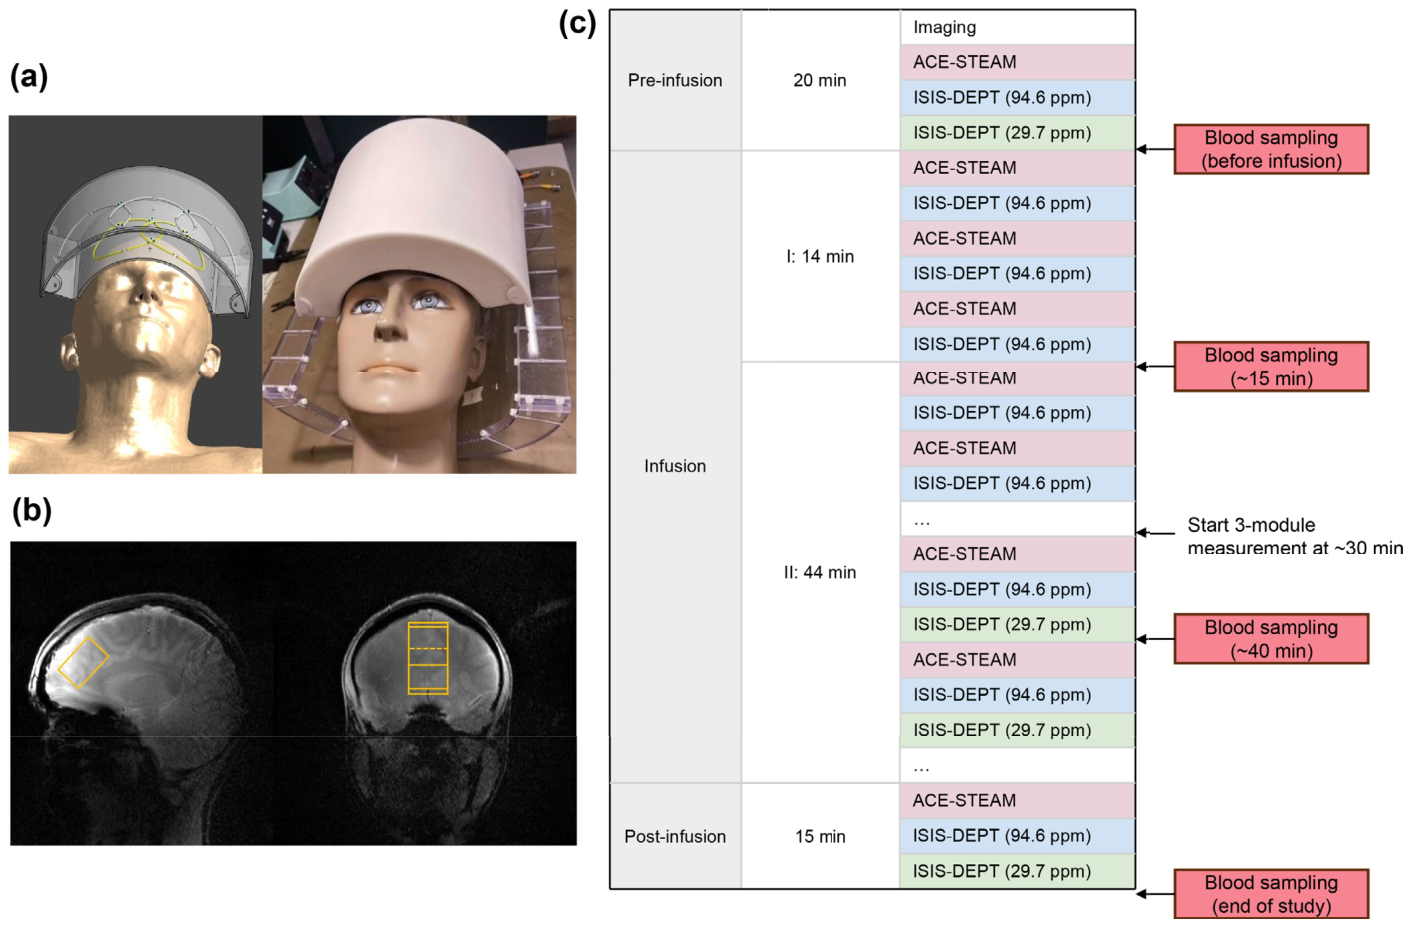
Figure 1. FIGURE 1 | Experimental setup and example design: (a) Illustration of the dual-tuned 3-channel 1H/2-channel 13C surface coil. Left: Simulated coil placement on the Duke human model using Sim4Life. Right: Photograph of the coil setup. All loops are enclosed in the casing designed for frontal lobe coverage, mounted on two adjustable arms and a transparent base to facilitate precise positioning. (b) Voxel (2.5 × 2.8 × 4.0 cm3) local- ization in the frontal lobe. (c) Example interleaved MRS acquisition scheme. The session began with around 20 min allocated to preparation scans, including 3D anatomical imaging for voxel localization, shimming, and baseline MRS measurements (before infusion). Intravenous infusion of 10% [1-13C]-glucose solution (total dose: 0.5 g/kg body weight) included a priming bolus over the first 14 min (50% of the dose, delivered at three rates), followed by a slower maintenance infusion. The 1H and 13C MRS were interleaved to form one complete acquisition block: (1) ACE-STEAM, (2) ISIS- DEPT carried at 94.6 ppm, and (3) ISIS-DEPT carried at 29.7 ppm conducted after 30 min. After completion of the infusion (at ~60 min), one final block of MRS acquisition was performed. Venous blood was sampled at baseline (pre-infusion), then about every 20 min during the infusion phase, and once more at the end of the full experiment.解説: 本研究の実験セットアップとプロトコルの例。(a) 前頭葉をカバーするために設計された、デュアルチューン対応の3チャンネル1H/2チャンネル13C表面コイルのイラストと写真。 (b) 前頭葉におけるMRSボクセル(2.5×2.8×4.0 cm3)の局在化。 (c) インターリーブMRS取得スキームの例。約20分の準備スキャン後、10% [1-13C]-グルコース溶液が静脈内注入され、その間と終了後にMRSデータと採血が行われる。
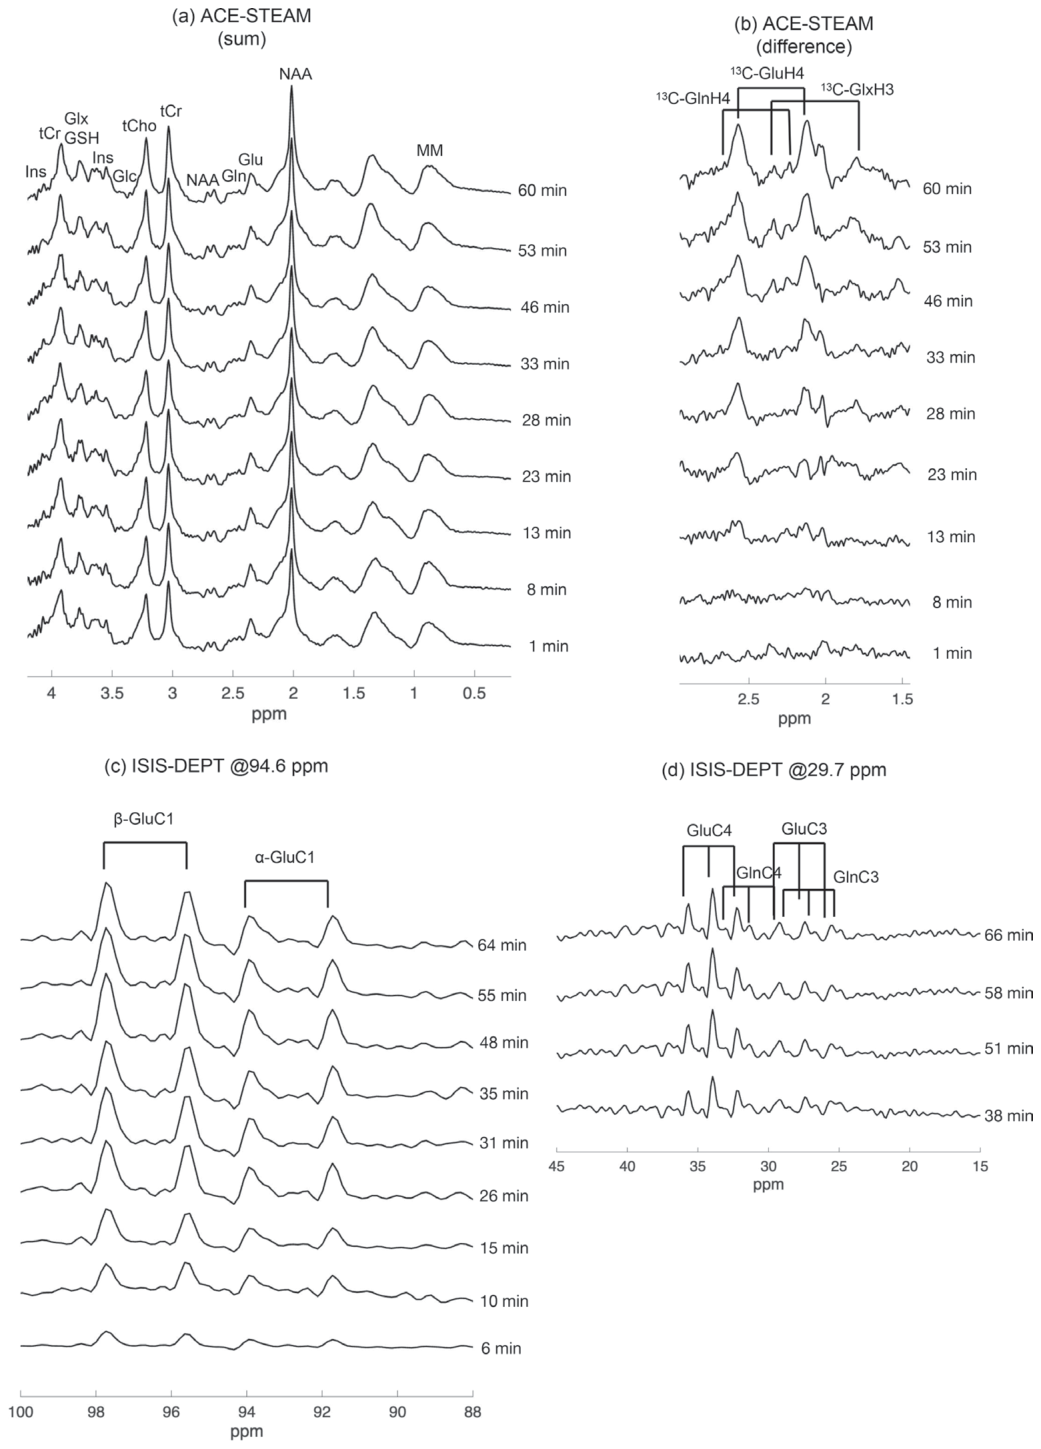
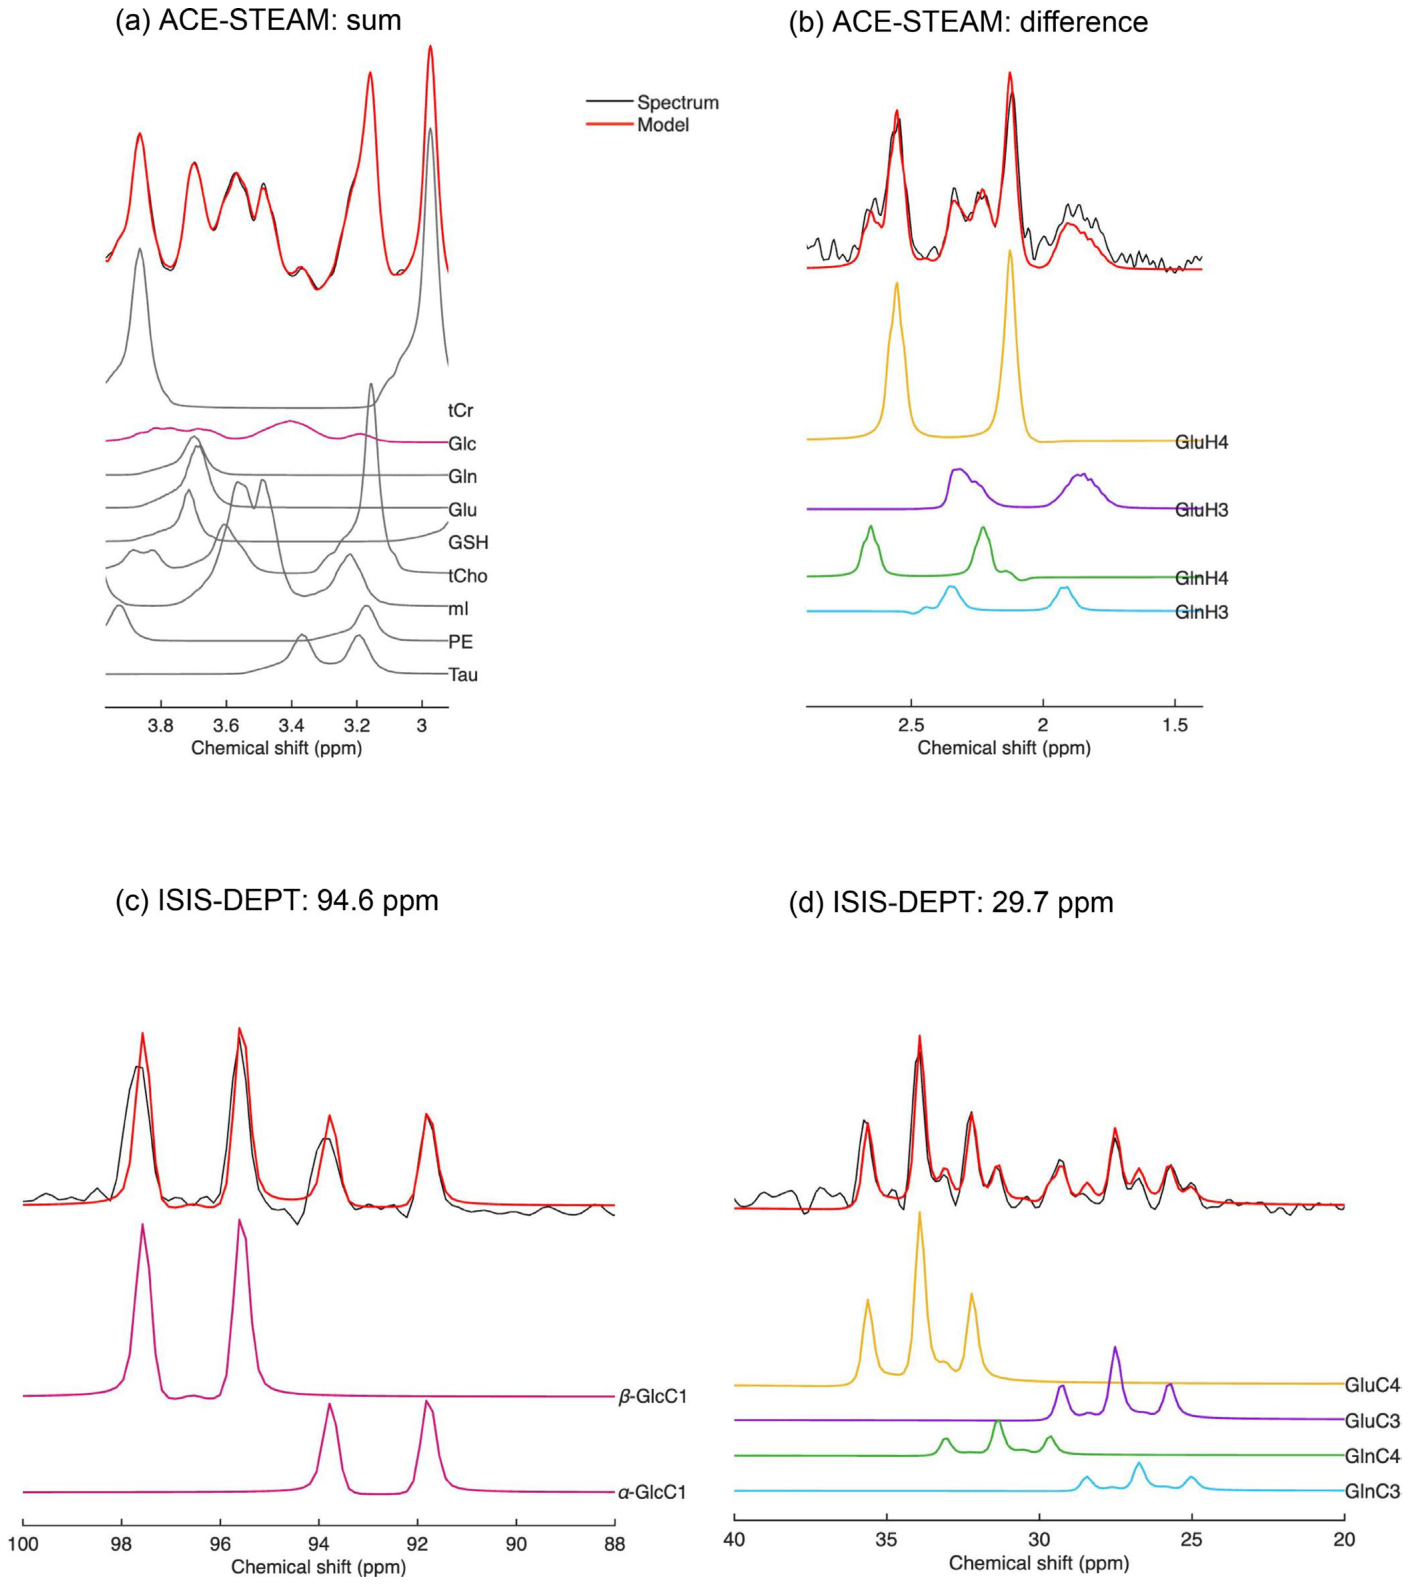
Figure 3. FIGURE 3 | Representative in vivo spectra (black) acquired with ACE-STEAM and ISIS-DEPT sequences and sum resonances (red), as well as the individual isotopomer decompositions. (a) ACE-STEAM sum spectrum (32 averages). The spectrum shown here was processed with macromol- ecule and baseline removal, achieved by subtracting the fitted components obtained from the LCModel fitting results; (b) ACE-STEAM difference spectrum (128 averages); (c) 13C spectrum acquired with ISIS-DEPT (128 averages, carrier frequency 94.6 ppm); (d) 13C spectrum acquired with ISIS- DEPT (128 averages, carrier frequency 29.7 ppm).解説: ACE-STEAMおよびISIS-DEPTシーケンスで取得された代表的な生体内スペクトルと、各代謝物の分解結果。(a) ACE-STEAM総和スペクトルで、複数の代謝物の信号が分解されている。(b) ACE-STEAM差分スペクトルでは、13C結合した1H信号が検出され、GluH4、GlnH4、GlxH3の信号が区別できる。(c) ISIS-DEPTで取得された13Cスペクトル(94.6 ppm)では、α-GlcC1とβ-GlcC1の2つのグルコース二重線が明確に分離されている。(d) ISIS-DEPTで取得された13Cスペクトル(29.7 ppm)では、GluC4、GlnC4、GluC3、GlnC3の4つの特徴的な三重線が検出されている。
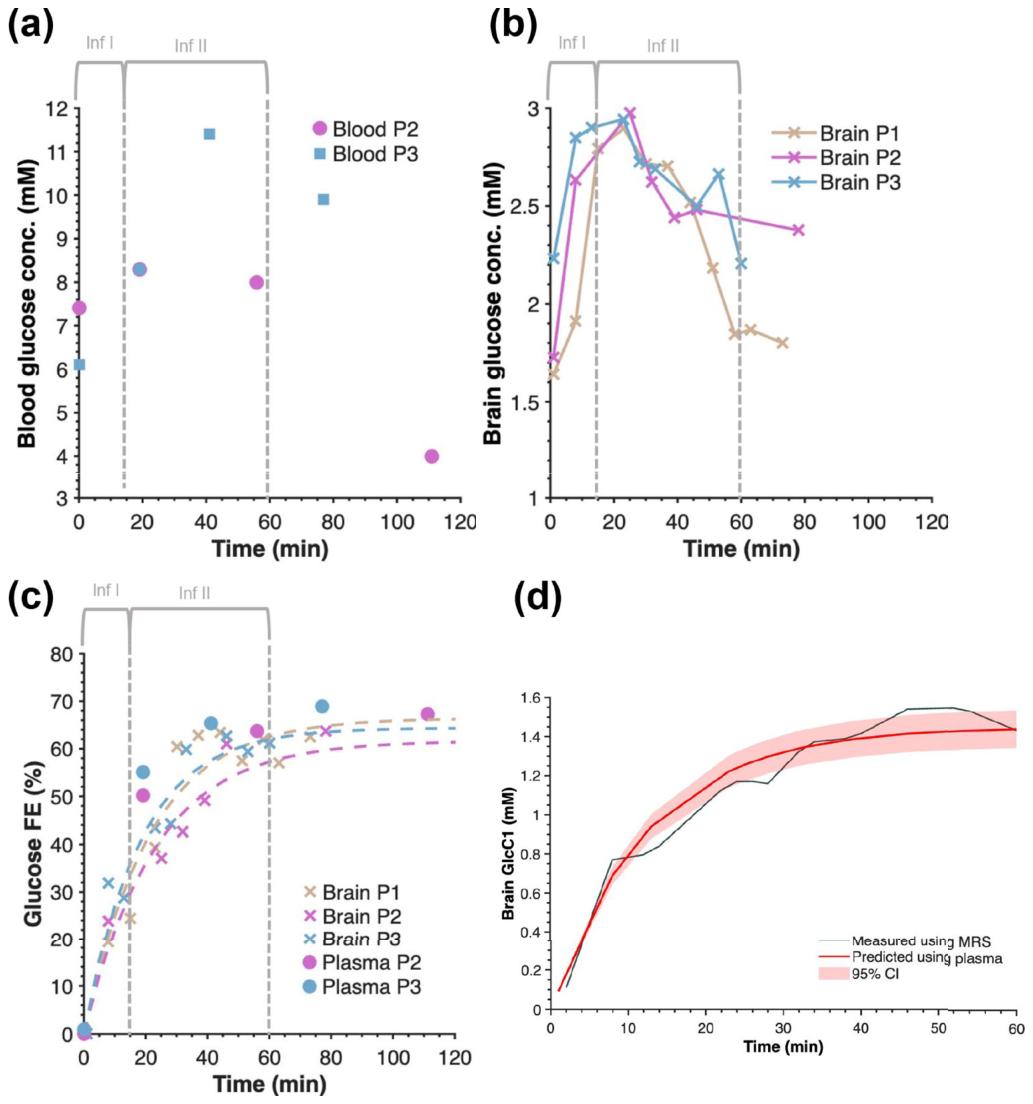
Figure 4. FIGURE 4 | Time courses of glucose levels and 13C FEs. (a) Blood glucose concentrations of Participant 2 and 3 measured with the glucose me- ter. (b) Total brain glucose levels in three participants, quantified from ACE-STEAM sum spectra. (c) Brain (Participant 1, 2, and 3) and plasma [1-13C]-glucose FEs (Participant 2 and 3) measured using MRS and LC-HRMS, respectively. The dotted line represents the exponential fit of the brain data. (d) for Participant 2 and 3, averaged brain [1-13C]-glucose (black), and the fit of the model to the brain [1-13C]-glucose level using plasma data (red) with its 95% confidence interval (CI), using the reversible Michaelis–Menten model.解説: グルコースレベルと13Cの分数濃縮(FE)の経時変化。(a) 対象者2と3の採血で測定された血糖濃度。 (b) 3人の対象者における脳の総グルコースレベルで、ACE-STEAM総和スペクトルから定量された。 (c) MRSおよびLC-HRMSでそれぞれ測定された、脳(対象者1、2、3)および血漿(対象者2、3)の[1-13C]-グルコースFE。 (d) 対象者2と3の平均脳[1-13C]-グルコースと、血漿データを用いた脳[1-13C]-グルコースレベルのモデルフィット。
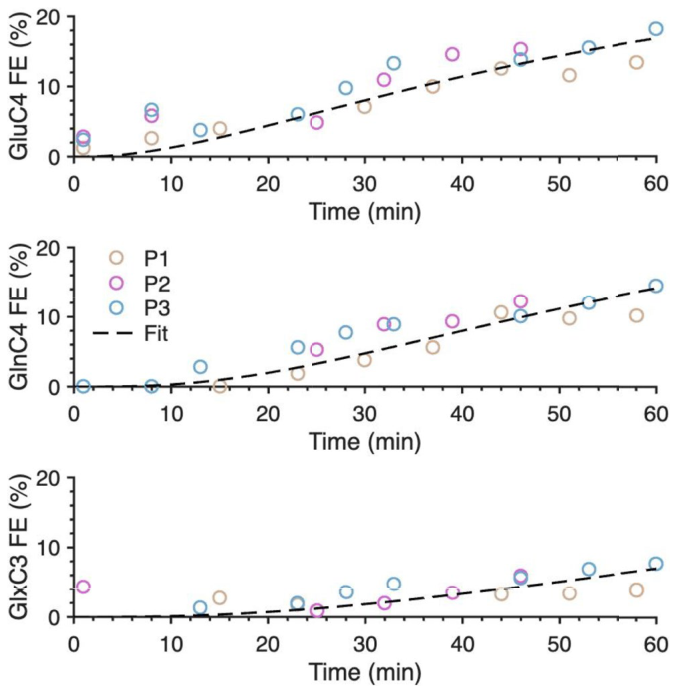
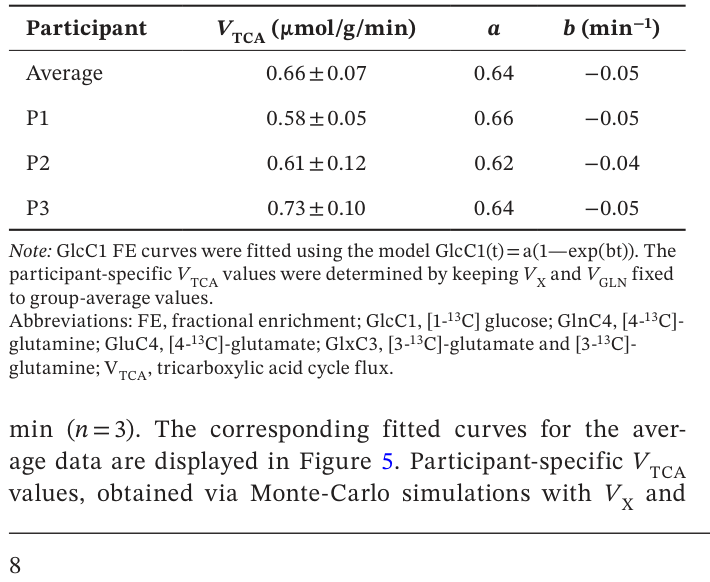
Figure 5. FIGURE 5 | Average fits of glutamate C4, glutamine C4, and glu- tamate/glutamine C3 FE curves of three participants. The fitting was performed with the one-compartment model using the average GlcC1 function as input. Each participant is represented by a distinct color.解説: 3人の対象者のグルタミン酸C4、グルタミンC4、グルタミン酸/グルタミンC3のFE曲線平均フィット。平均GlcC1関数を入力として、1コンパートメントモデルでフィットが実行された。Table 1. TABLE 1 | Group-averaged and participant-specific VTCA estimates and fitted GlcC1 FE parameters (a, b), with uncertainties obtained from Monte-Carlo simulations, incorporating variability in GluC4, GlnC4, and GlxC3 enrichments.解説: TCAサイクルフラックス(VTCA)のグループ平均値および対象者ごとの推定値と、GlcC1 FEパラメータ(a, b)のフィット値。不確実性はモンテカルロシミュレーションから得られたもので、GluC4、GlnC4、GlxC3のエンリッチメントの変動が考慮されている。グループ平均VTCAは0.66±0.07μmol/g/minであり、対象者個別では0.58~0.73μmol/g/minの範囲であった。
コメントを残す