どうも、Beyond the Pixelです。近年、医療画像診断の分野では、放射線被ばく量の削減と画像品質の向上という、相反する課題を解決するための技術革新が目覚ましいです。その中でも「フォトンカウンティングCT(PCCT)」は、従来のCT(エネルギー積分型CT)を凌駕する画期的な技術として注目されています。PCCTは、X線光子を一つ一つ直接検出することで、ノイズを低減し、より少ない線量で高分解能の画像を得ることを可能にします。これにより、特に繰り返し検査が必要な肺疾患の診断やスクリーニングにおいて、対象者の負担を大幅に軽減できる可能性を秘めています。
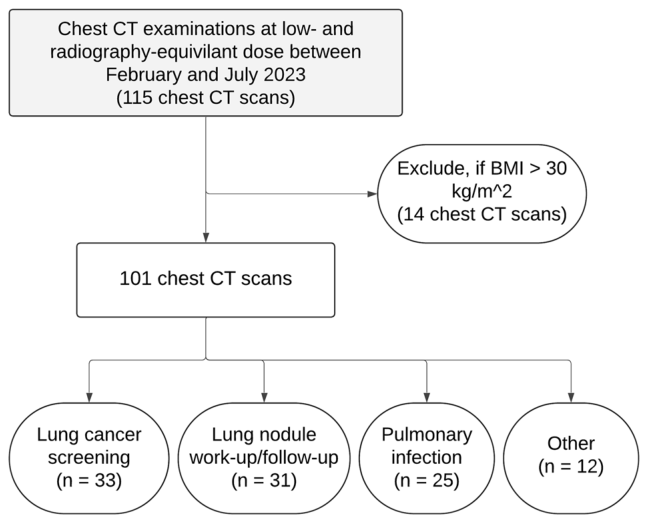
Figure 1. Fig. 1 Flowchart of patient selection解説: このフローチャートは、研究対象者の選定プロセスを示しています。当初115名の胸部CT検査から、BMIが30kg/m²を超える14名が除外され、最終的に101名の対象者が研究に組み込まれました。主な臨床的適応としては、肺がんスクリーニング、肺結節の評価・経過観察、肺感染症の評価などが含まれています。
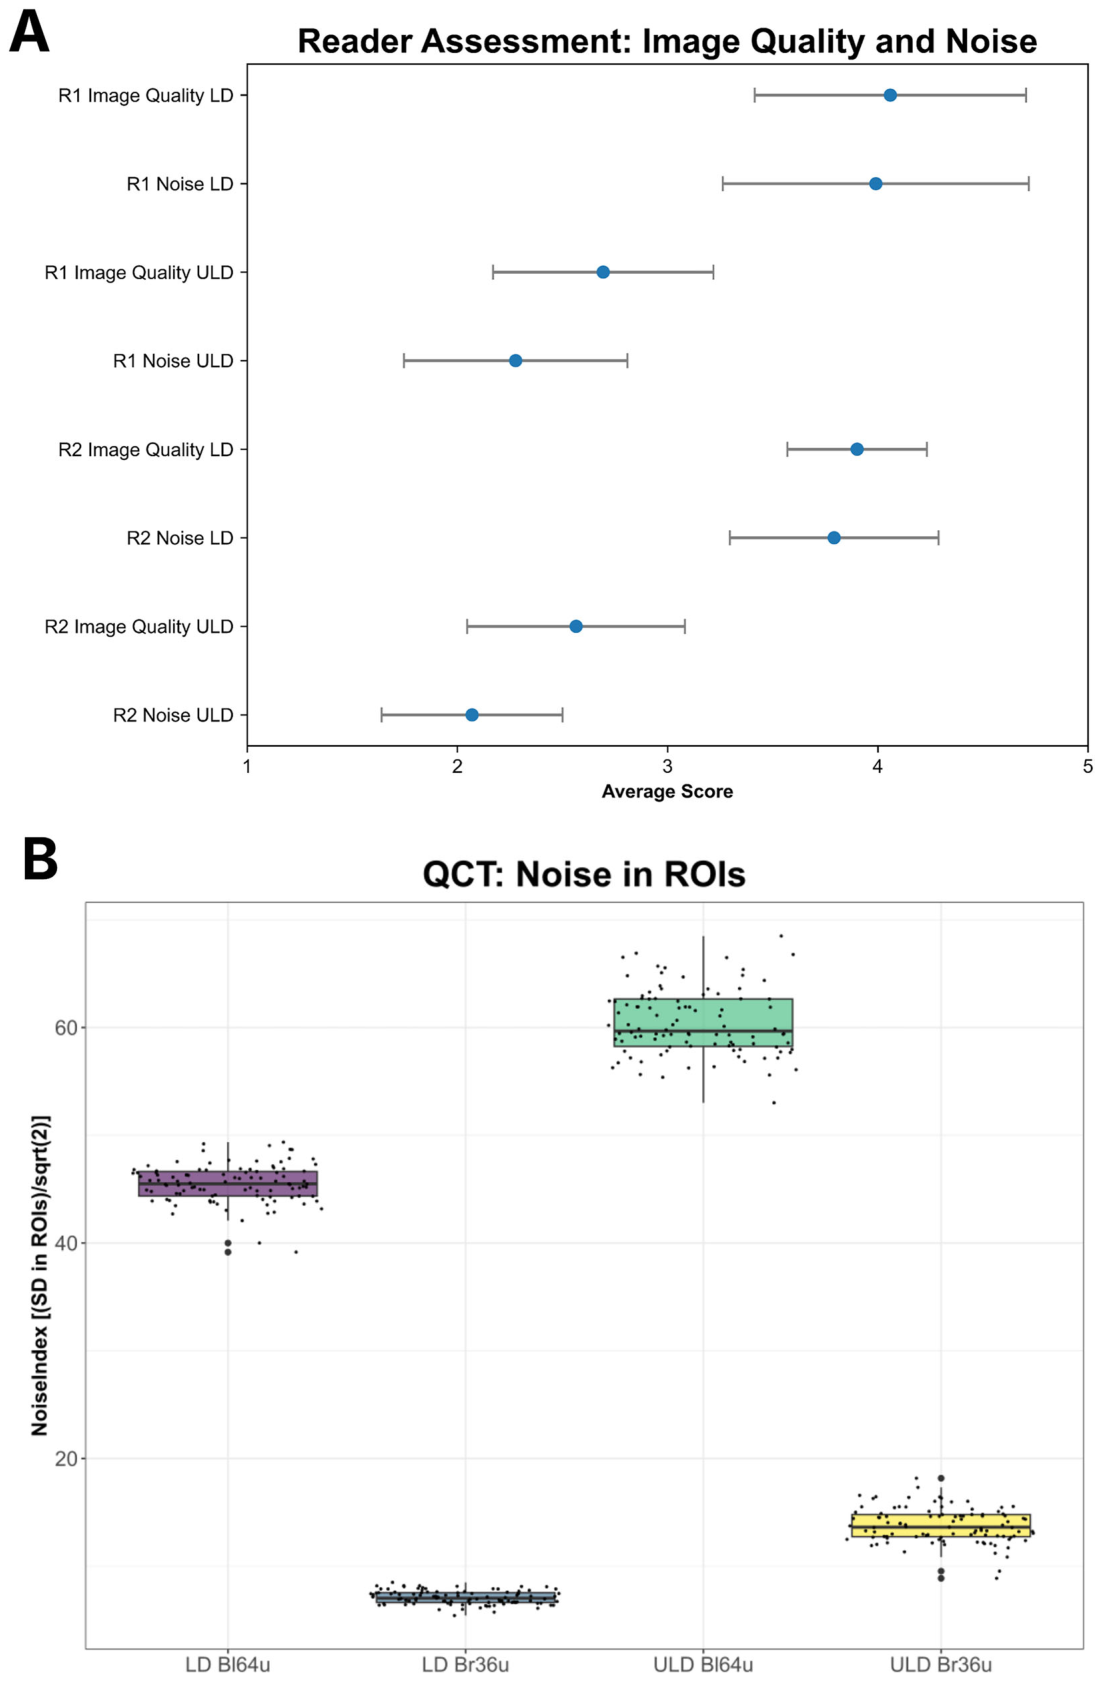
Figure 2. Fig. 2 Assessment of image quality and noise. A Visual assessment showed lower ratings for image quality and higher noise at ultra-low-dose (ULD) (mean ± standard deviation). B Higher noise levels at ULD are confirmed by higher values for the automatically determined parameter NoiseIndexROIs. The differences were pairwise significant for all four groups with p < 0.001解説: 画像品質とノイズの評価結果を示しています。Aでは、2名の専門家(R1, R2)による視覚評価で、低線量(LD)と比較して超低線量(ULD)で画像品質の評価が低く、ノイズの評価が高いことが示されています。Bでは、自動定量CTによるノイズ指標(NoiseIndexROIs)で、ULDプロトコル(特にBl64uカーネル)がLDプロトコルよりも有意に高いノイズレベルを示しています。
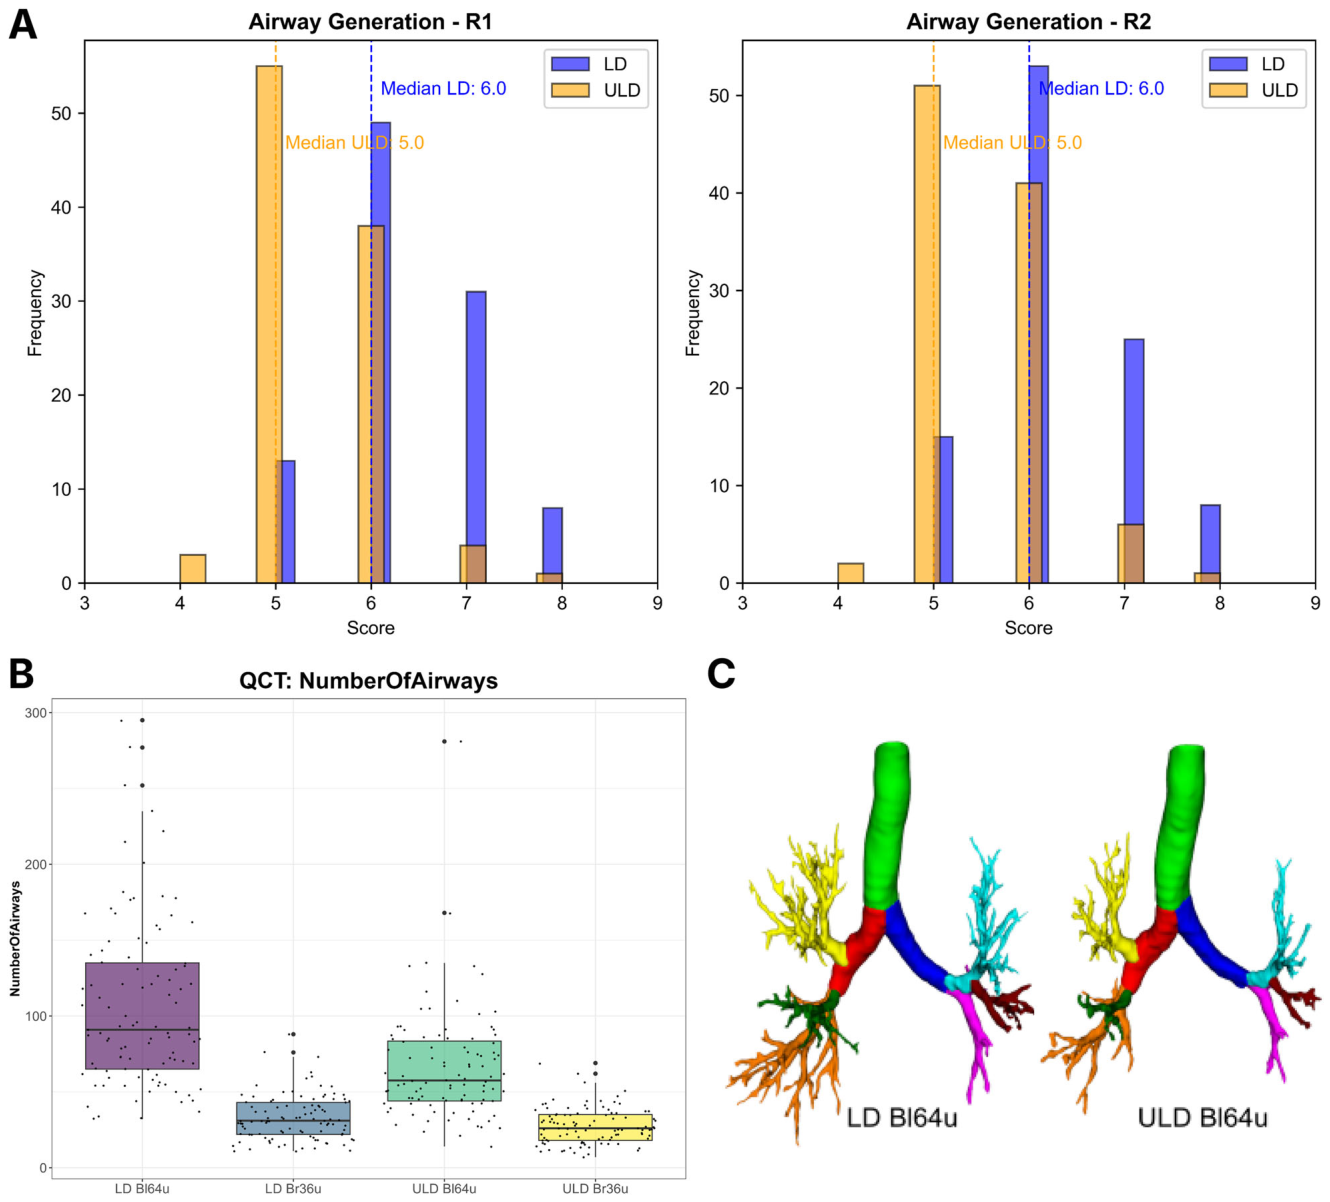
Figure 3. Fig. 3 Assessment of visualization of airway generations at low- (LD) and ultra-low-dose (ULD) PCCT. A Histograms of reader assessment of airway generations counted at RB3 show higher generations are visible at LD (blue bars) compared to ULD (yellow bars) for both readers. B Boxplots of the number of segmented airways from automated QCT at LD and ULD CT. Airway counts were higher for both reconstruction kernels (Bl64u = lung tissue kernel, Br36u = soft-tissue kernel) at LD. C Example of the automated segmentations of airway generations showing comparable proximal airway anatomy but a reduced visualization of distal bronchi at ULD compared to LD for the lung tissue kernel (Bl64u)解説: LDとULD-PCCTにおける気道世代の視覚化評価を示しています。Aは、2名の専門家によるRB3(右上葉前枝気管支)で数えられた気道世代のヒストグラムで、LDの方がULDよりも高い世代の気道が可視化されていることを示しています。Bは、自動QCTによるセグメント化された気道数のボックスプロットで、LDの方がULDよりも気道数が多くなっています。Cは、自動セグメンテーションの例で、LDと比較してULDでは末梢気管支の視覚化が減少していることを示しています。
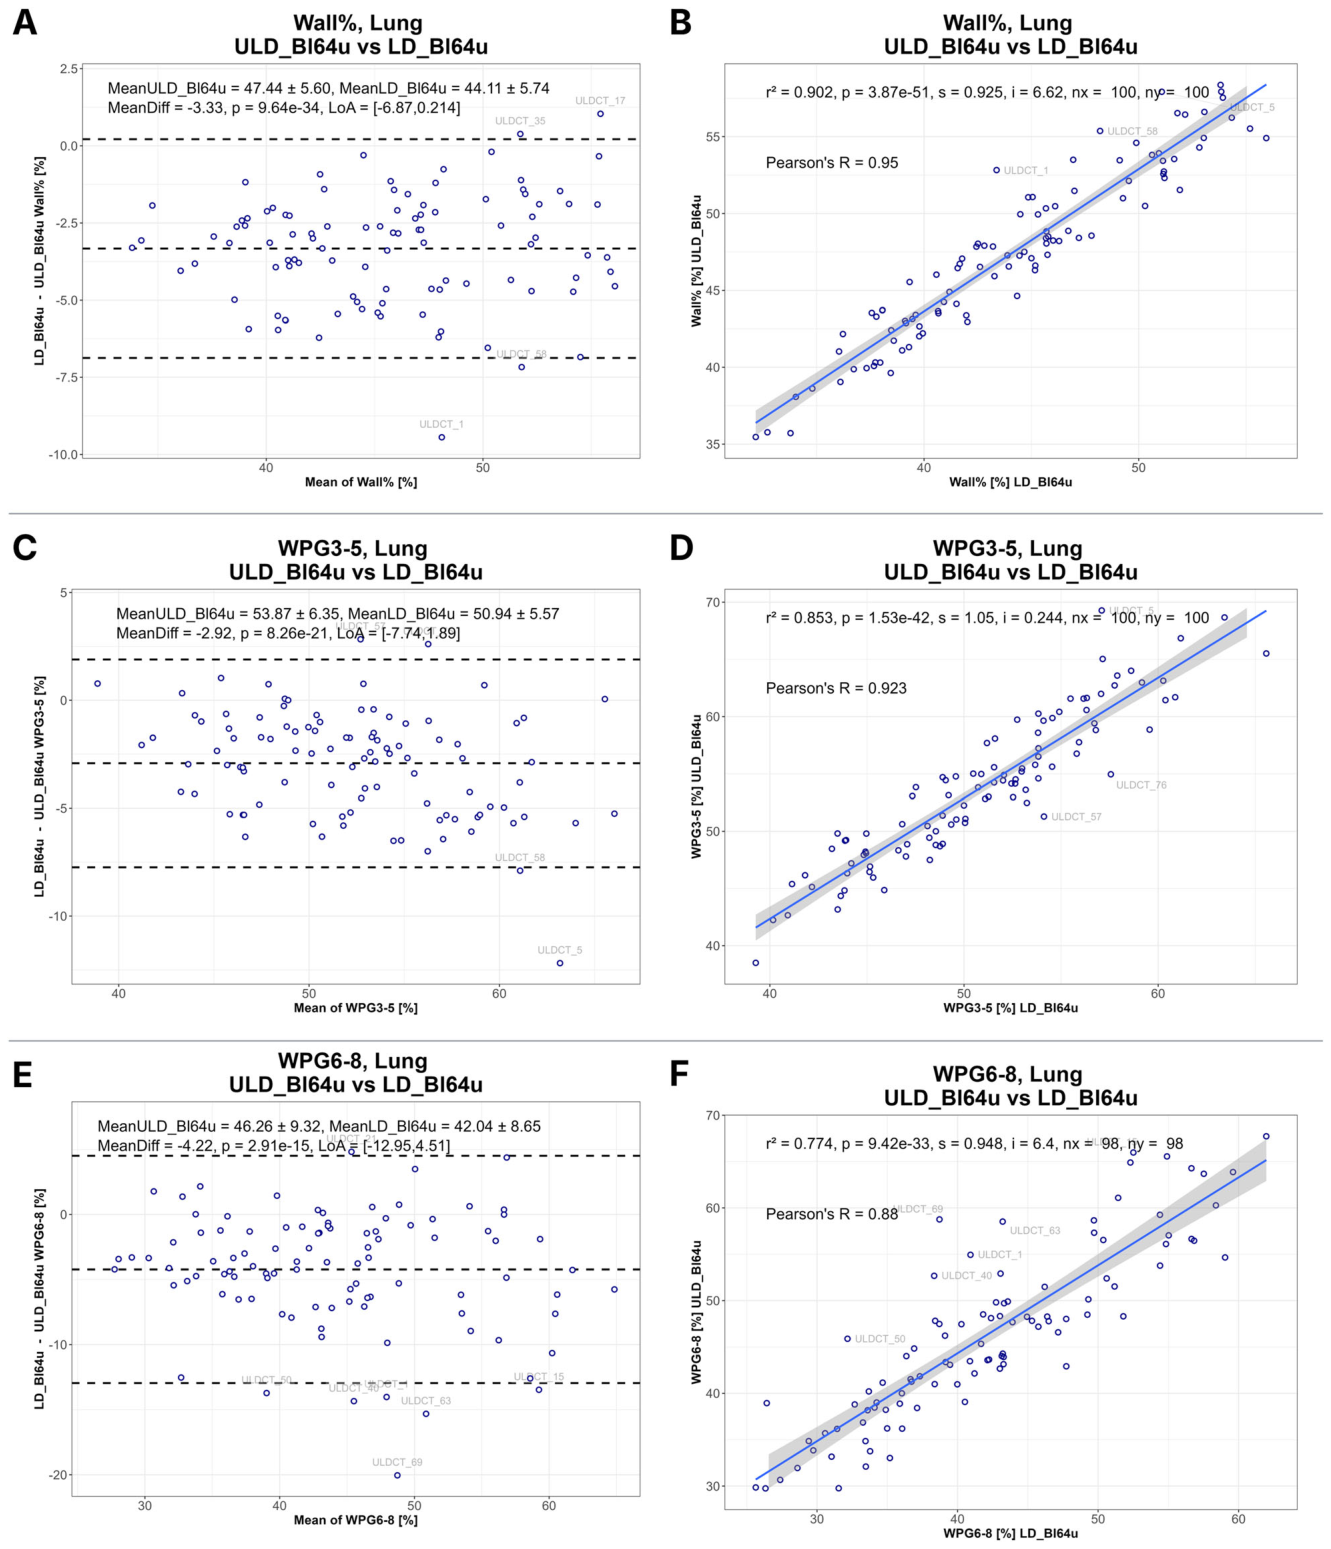
Figure 4. Fig. 4 Agreement and correlation of bronchial wall percentage between low-dose (LD) and ultra-low-dose (ULD) photon-counting CT using the Bl64u lung reconstruction kernel. A, B Bland–Altman and correlation analyses for airway wall percentage averaged across the entire segmented airway tree. C, D Corresponding analyses restricted to airway generations 3–5 demonstrate smaller differences and stronger agreement between dose levels. E, F Analyses of airway generations 6–8 show greater differences and lower agreement, indicating reduced robustness of peripheral airway wall measurements at ULD解説: Bl64u肺再構成カーネルを使用したLDとULDフォトンカウンティングCT間の気管支壁厚比の一致度と相関関係を示しています。AとBは、セグメント化された気道ツリー全体の気道壁厚比に関するBland-Altman(ブランド・アルトマン)解析と相関分析です。CとDは、気道世代3〜5に限定した解析で、線量レベル間の差が小さく、一致度が高いことを示しています。EとFは、気道世代6〜8の解析で、差が大きく、一致度が低いことを示しており、ULDにおける末梢気道壁測定の堅牢性の低下を示唆しています。
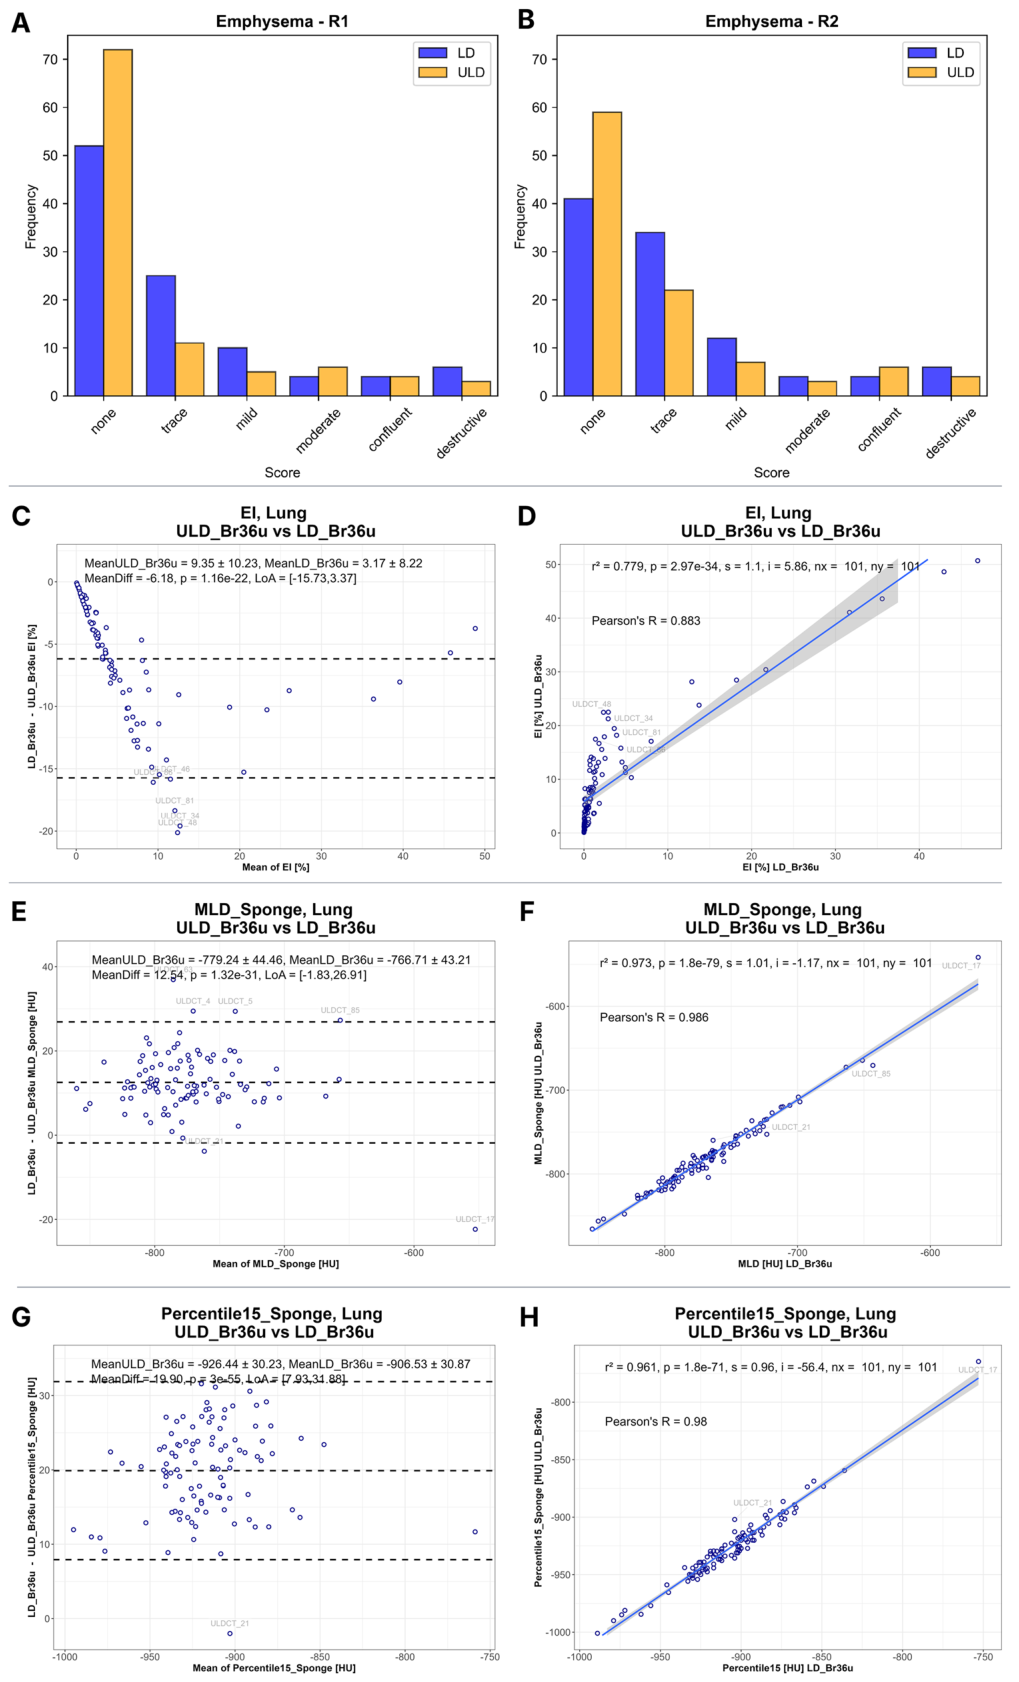
Figure 5. Fig. 5 (See legend on next page)解説: LDとULDフォトンカウンティングCT間の肺気腫関連の定量的および視覚的パラメーターの比較を示しています。AとBは、2名の専門家による視覚的肺気腫スコアのヒストグラムで、ULDで肺気腫の重症度が低いカテゴリーにシフトする傾向があることを示しています。CとDは、肺気腫指数(EI)のBland-Altman解析と相関分析で、ULDで閾値に基づく気腫推定値が高いことを示しています。EとFは、スポンジモデル補正後の平均肺密度(MLD)の解析で、ULDでMLD値が低いことを示しています。GとHは、スポンジモデル補正後の15パーセンタイル値(Perc15)の解析で、ULDで値が低いことを示しています。
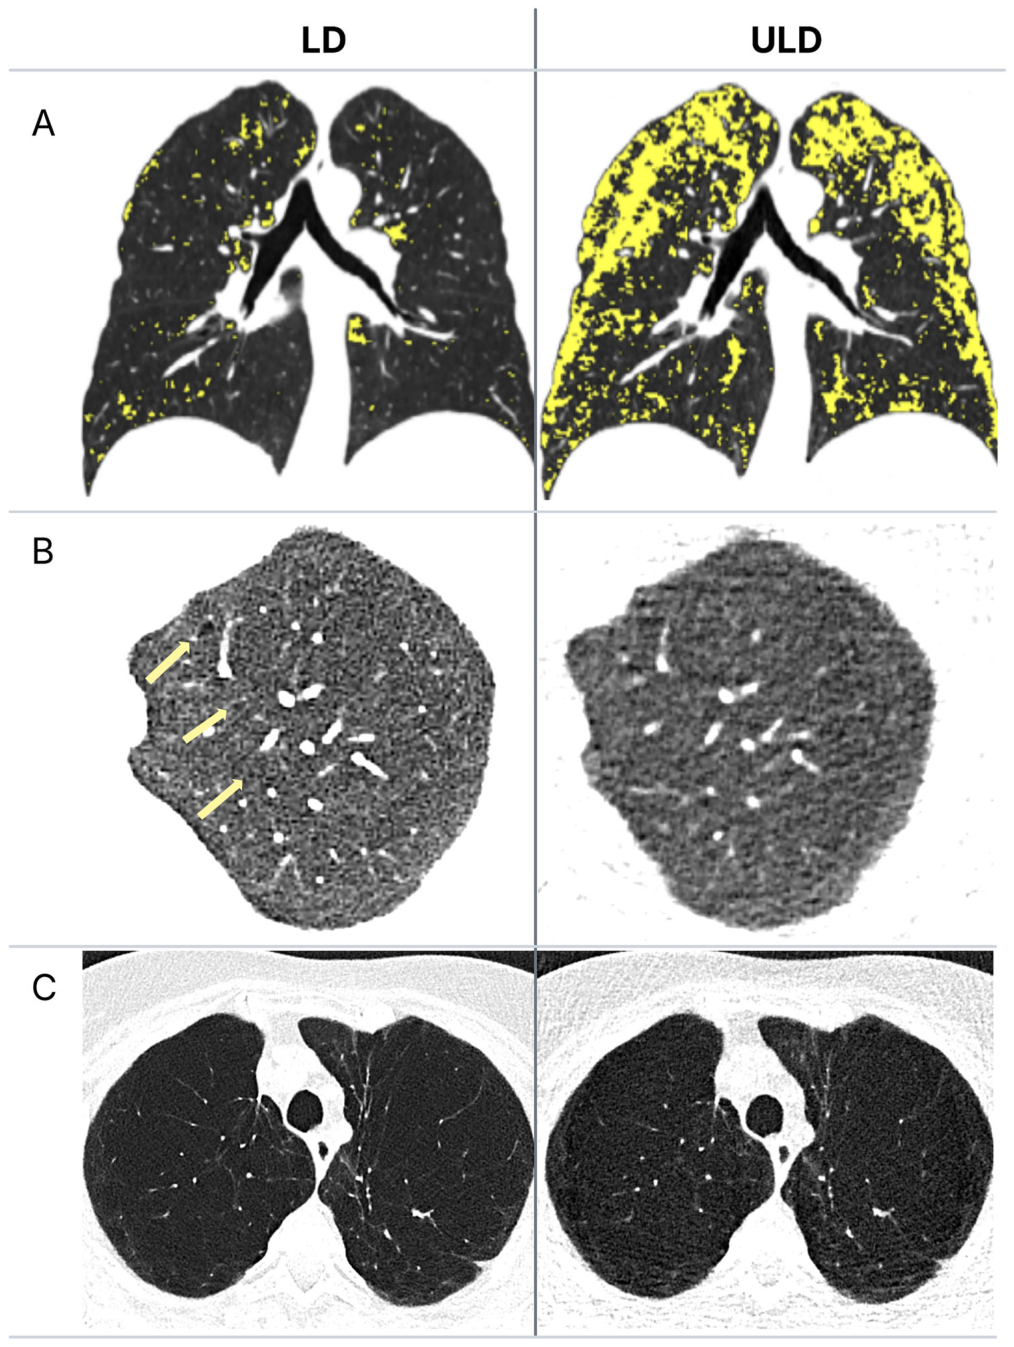
Figure 6. Fig. 6 Representative examples of emphysema quantification: first column, low-dose (LD); second column, ultra-low-dose (ULD). A Visualization of emphysema extent with −950 HU threshold (yellow areas) showing marked differences with a larger area falling below the threshold at ULD (LD: lung volume 7953 cm³; MLD −811 HU vs. ULD: lung volume 7998 cm³; MLD −823 HU). B Example of subtle centrilobular emphysematous changes (yellow arrows) that were reported as trace emphysema by both readers at LD but missed at ULD. C Example of emphysema consistently rated as destructive by both readers for both dose levels解説: LD(左列)とULD(右列)での肺気腫定量化の代表的な例を示しています。Aでは、-950 HU閾値(黄色の領域)を用いた肺気腫範囲の可視化で、肺容量が類似しているにもかかわらず、ULDの方が閾値を下回る領域が大きくなっています。Bの例は、LDでは両専門家によって微細な小葉中心性肺気腫変化(黄色い矢印)が微量気腫として報告されたものの、ULDでは識別されなかったケースを示しています。Cの例は、両専門家が両線量レベルで破壊性気腫と一貫して評価した進行した破壊性気腫を示しています。

コメントを残す