どうも、Beyond the Pixelです。胎児の体温を非侵襲的に評価する技術は、MRI検査の安全性監視を向上させるだけでなく、胎児の生理機能や発達に関する貴重な洞察を提供するために極めて重要です。特に、妊娠初期の体温上昇は奇形発生の原因となる可能性があり、妊娠後期においては低体温と高体温の双方が胎児の発達に悪影響を及ぼすことが知られています。現在のMRI安全性ガイドラインでは、組織に吸収される電磁エネルギーの割合を示す比吸収率(SAR)に基づいて推定される間接的な熱量評価が主に使用されています。しかし、このSARに基づくアプローチは、個々の生理的変動やリアルタイムでの温度変化を考慮に入れることができません。このため、直接的かつ非侵襲的な胎児の体温測定法の確立が求められています。胎児MRIの利用が拡大し、より初期の妊娠週数や高い磁場強度(例:3T)での検査が増えるにつれて、正確な胎児体温測定の必要性はさらに高まっています。既存のMRIによる温度測定法には限界があります。例えば、陽子共鳴周波数(PRF)による測定は相対的な温度変化しか推定できず、胎児の動きや母親の呼吸による位相の不安定性のため胎児MRIへの適用が困難です。また、磁気共鳴分光法(MRS)による絶対温度測定は、長い撮像時間、低い信号対ノイズ比(SNR)、および限られた空間分解能といった制約があります。このような背景から、水分子の拡散が温度に依存するという特性を利用する拡散MRIが、胎児の体温測定の新たなアプローチとして注目されています。自由液体中の水分子の拡散係数(D)は絶対温度(T)と動的粘度(η)、有効分子半径(r)の間のストークス・アインシュタイン・サザーランドの関係によって説明され、見かけの拡散係数(ADC)が温度と直接関連付けられることが実験的に示されています。成人脳脊髄液(CSF)における拡散係数と温度の関係を表す既存の経験的方程式は、神経画像診断や体温測定の研究で広く利用されてきました。しかし、この成人由来の拡散-温度校正曲線が、新生児や胎児のCSFにそのまま適用できるかは不明でした。本研究の目的は、この成人由来の拡散-温度関係を、早産児の脳脊髄液に適用できるか、そしてさらに子宮内の胎児脳脊髄液に適用できるかという実現可能性を評価することでした。これは、非侵襲的な胎児体温評価法の確立に向けた重要な第一歩となります。
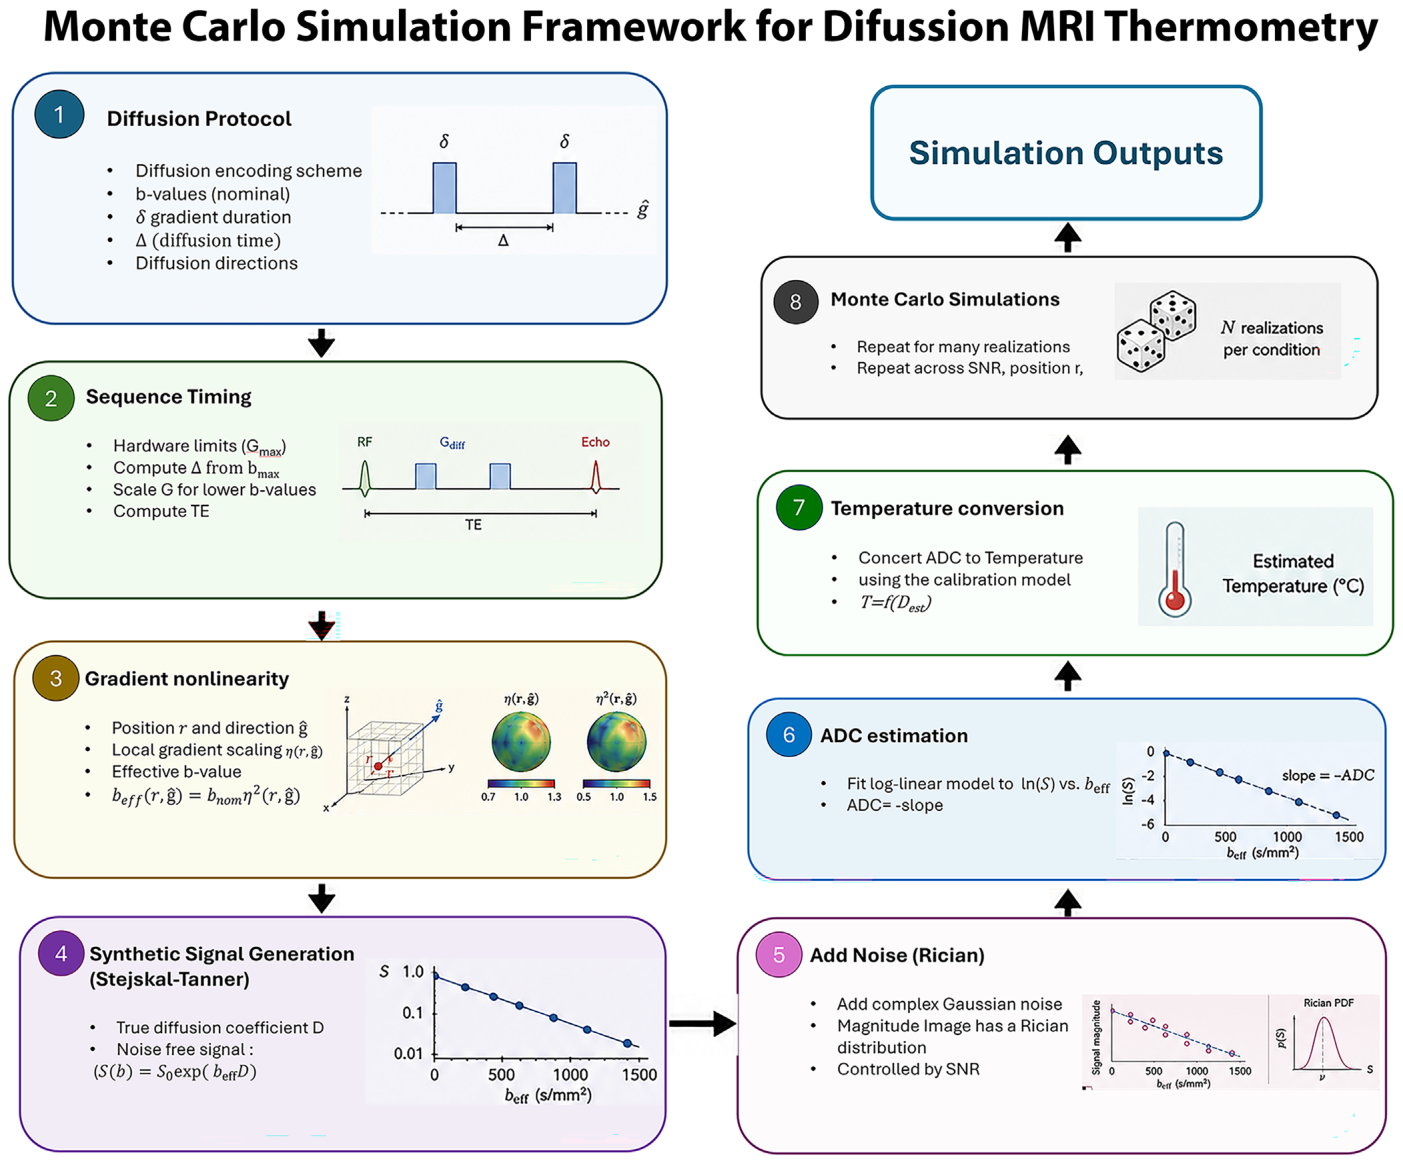
Figure 1. FIGURE 1 | Overview of the Monte Carlo simulation framework used to evaluate diffusion MRI thermometry. The simulation incorporates real- istic diffusion sequence timing, gradient field nonlinearity, Rician image noise, ADC estimation, and temperature conversion to quantify the effects of acquisition parameters and scanner-related uncertainties on temperature estimation accuracy and precision.解説: モンテカルロシミュレーションの枠組みを示しており、拡散MRIを用いた体温測定を評価するための手順が図示されています。これには、拡散プロトコル、シーケンスタイミング、勾配磁場非線形性、合成信号生成、画像ノイズの追加、ADC推定、そして最終的な温度変換のプロセスが含まれます。
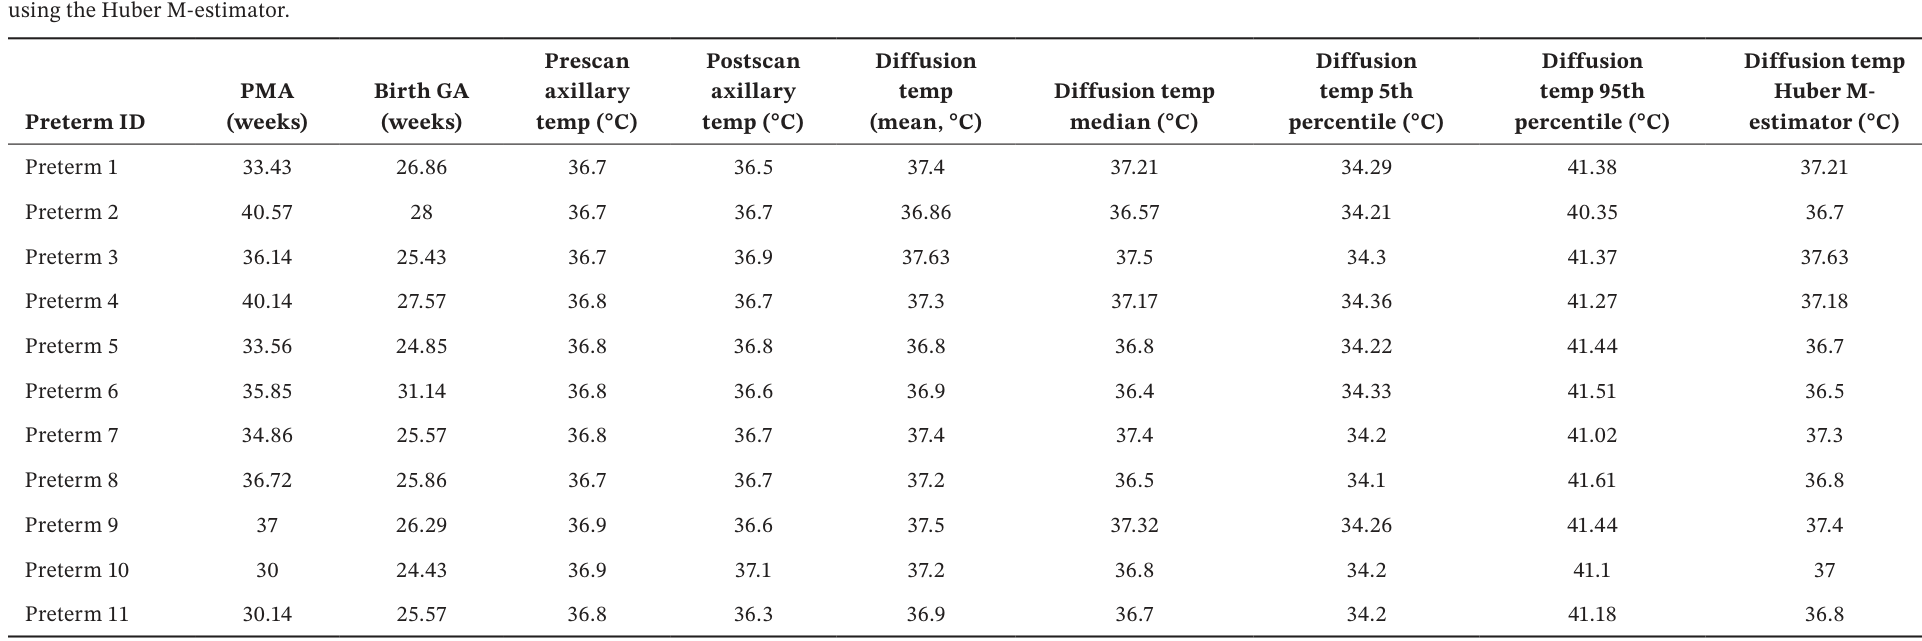
Table 1. TABLE 1 | Summary of postmenstrual age, gestational age, reference temperatures, and diffusion-derived CSF thermometry metrics in preterm neonates, including robust central temperature estimation解説: 早産児における生理学的指標、基準体温、および拡散MRIから得られた脳脊髄液(CSF)の体温測定結果の要約です。在胎週数、出生時の在胎週数、MRI検査前後の腋窩体温に加え、拡散由来のCSF体温の平均値、中央値、5パーセンタイル値、95パーセンタイル値、およびハブアーM推定量による値が示されています。
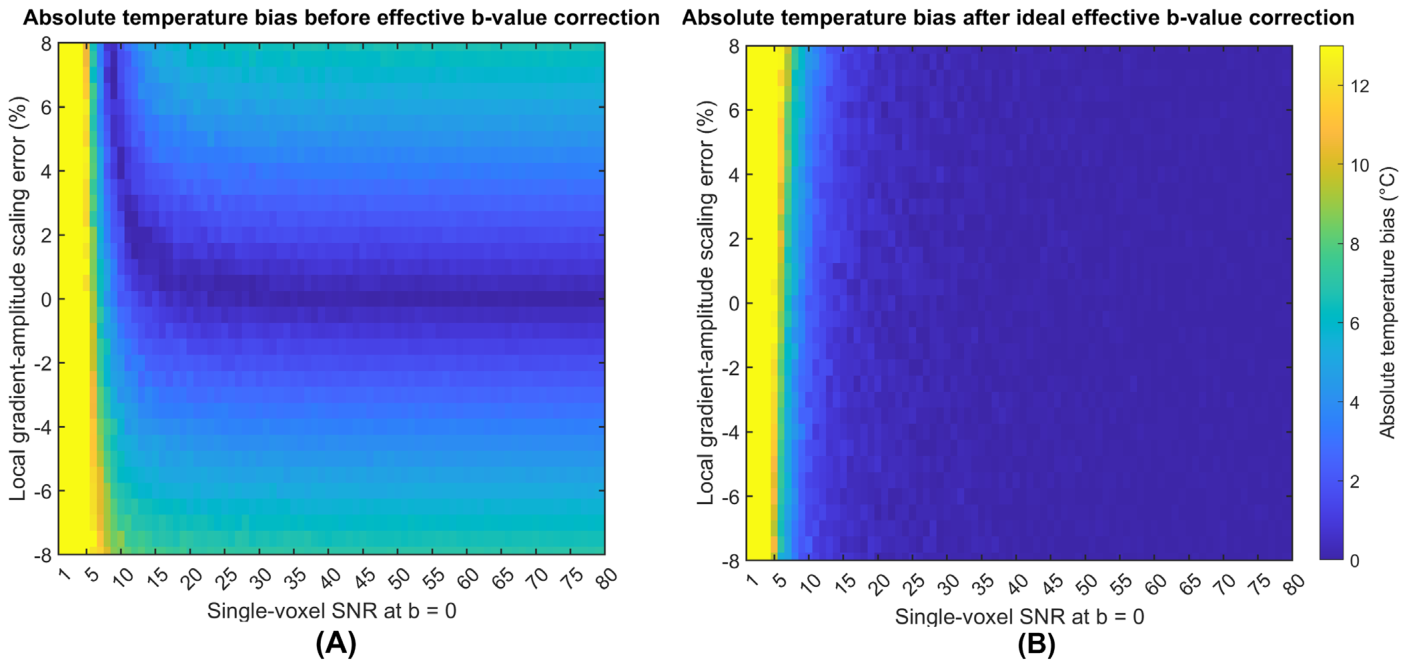
Figure 3. FIGURE 3 | Effect of local gradient-amplitude scaling error and effective b value correction on diffusion-derived temperature bias. (A) Absolute temperature bias before effective b value correction as a function of single-voxel SNR at b = 0 and local gradient-amplitude scaling error. Absolute bias increased with the magnitude of the gradient-scaling error. (B) Absolute temperature bias after ideal effective b value correction, assuming per- fect knowledge of the local effective diffusion weighting. Correction largely removed the dependence of temperature bias on gradient-scaling error, with residual bias predominantly observed at lower SNR.解説: 拡散由来の体温バイアスに対する局所勾配磁場振幅スケーリング誤差と実効b値補正の複合的な影響を示した図です。(A)は実効b値補正前の絶対温度バイアスを、(B)は理想的な実効b値補正後の絶対温度バイアスを、それぞれ単一ボクセルSNRと局所勾配磁場振幅スケーリング誤差の関数として示しています。
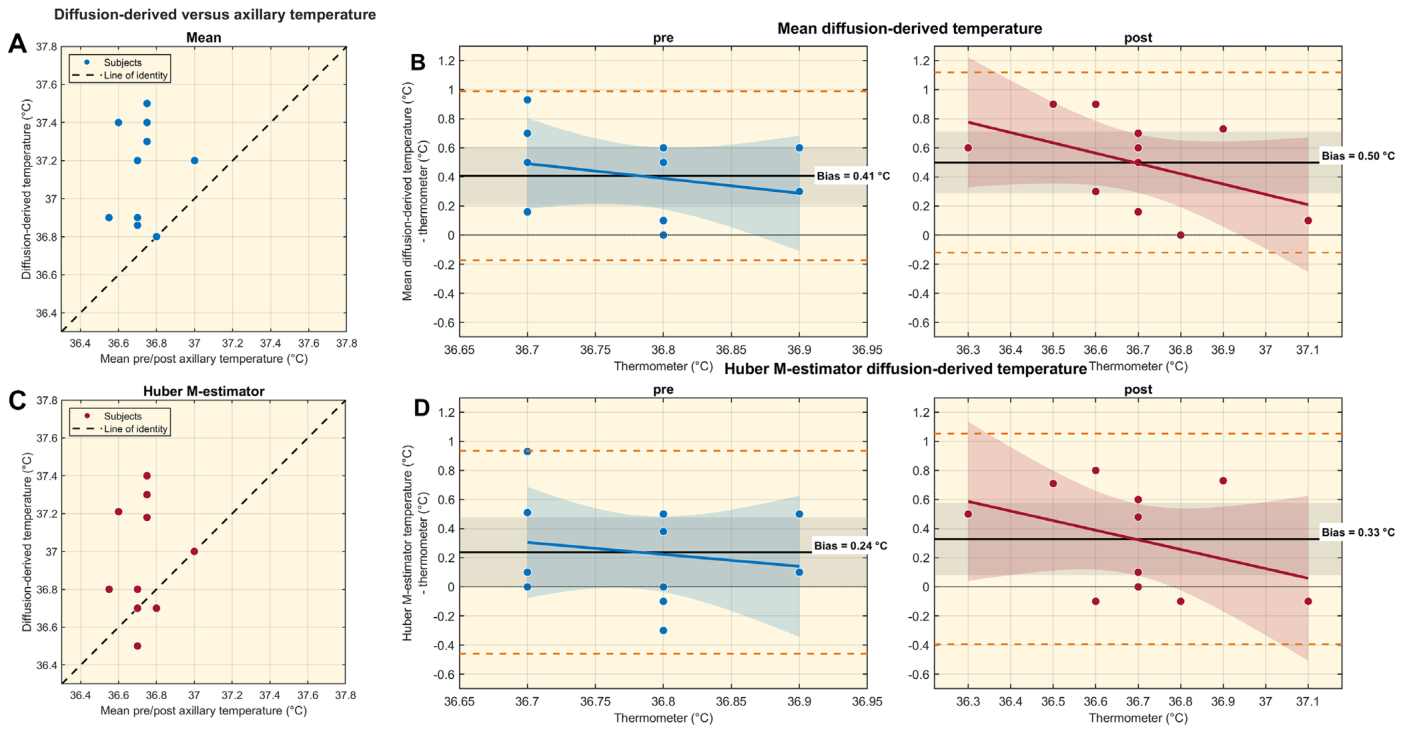
Figure 5. FIGURE 5 | Comparison of diffusion-derived and axillary temperature measurements in preterm neonates. (A) Scatter plot of mean diffusion- derived temperature versus the mean of the pre and postscan axillary temperatures for each subject; the dashed line indicates the line of identity. (B) Differences between mean diffusion-derived temperature and the prescan (left) and postscan (right) axillary temperatures. (C) Scatter plot of the Huber M-estimator of diffusion-derived temperature versus the mean of the pre and postscan axillary temperatures; the dashed line indicates the line of identity. (D) Differences between the Huber M-estimator and the prescan (left) and postscan (right) axillary temperatures. In panels B and D, the solid black horizontal line indicates the mean bias, the gray shaded region indicates the 95% confidence interval of the bias, and the orange dashed lines indicate the 95% limits of agreement. Colored solid lines and shaded regions represent the fitted linear relationship and its 95% confi- dence interval, respectively. Bias values are shown within each plot. Linear regression of the temperature differences against axillary temperature yielded slopes of −1.018 (R2 = 0.067, p = 0.444) and −0.709 (R2 = 0.216, p = 0.150) for the pre and postscan comparisons, respectively, using the mean diffusion-derived temperature (B). Corresponding slopes for the Huber M-estimator (D) were −0.823 (R2 = 0.030, p = 0.610) and −0.660 (R2 = 0.137, p = 0.263). None of the slopes was statistically significant.解説: 早産児における拡散由来の体温と腋窩体温測定値の比較を示しています。(A)は平均拡散由来体温とMRI検査前後の腋窩体温平均値の散布図、(B)は平均拡散由来体温とMRI検査前(左)および後(右)の腋窩体温との差分を示します。(C)はハブアーM推定量による拡散由来体温と腋窩体温平均値の散布図、(D)はハブアーM推定量と腋窩体温との差分です。
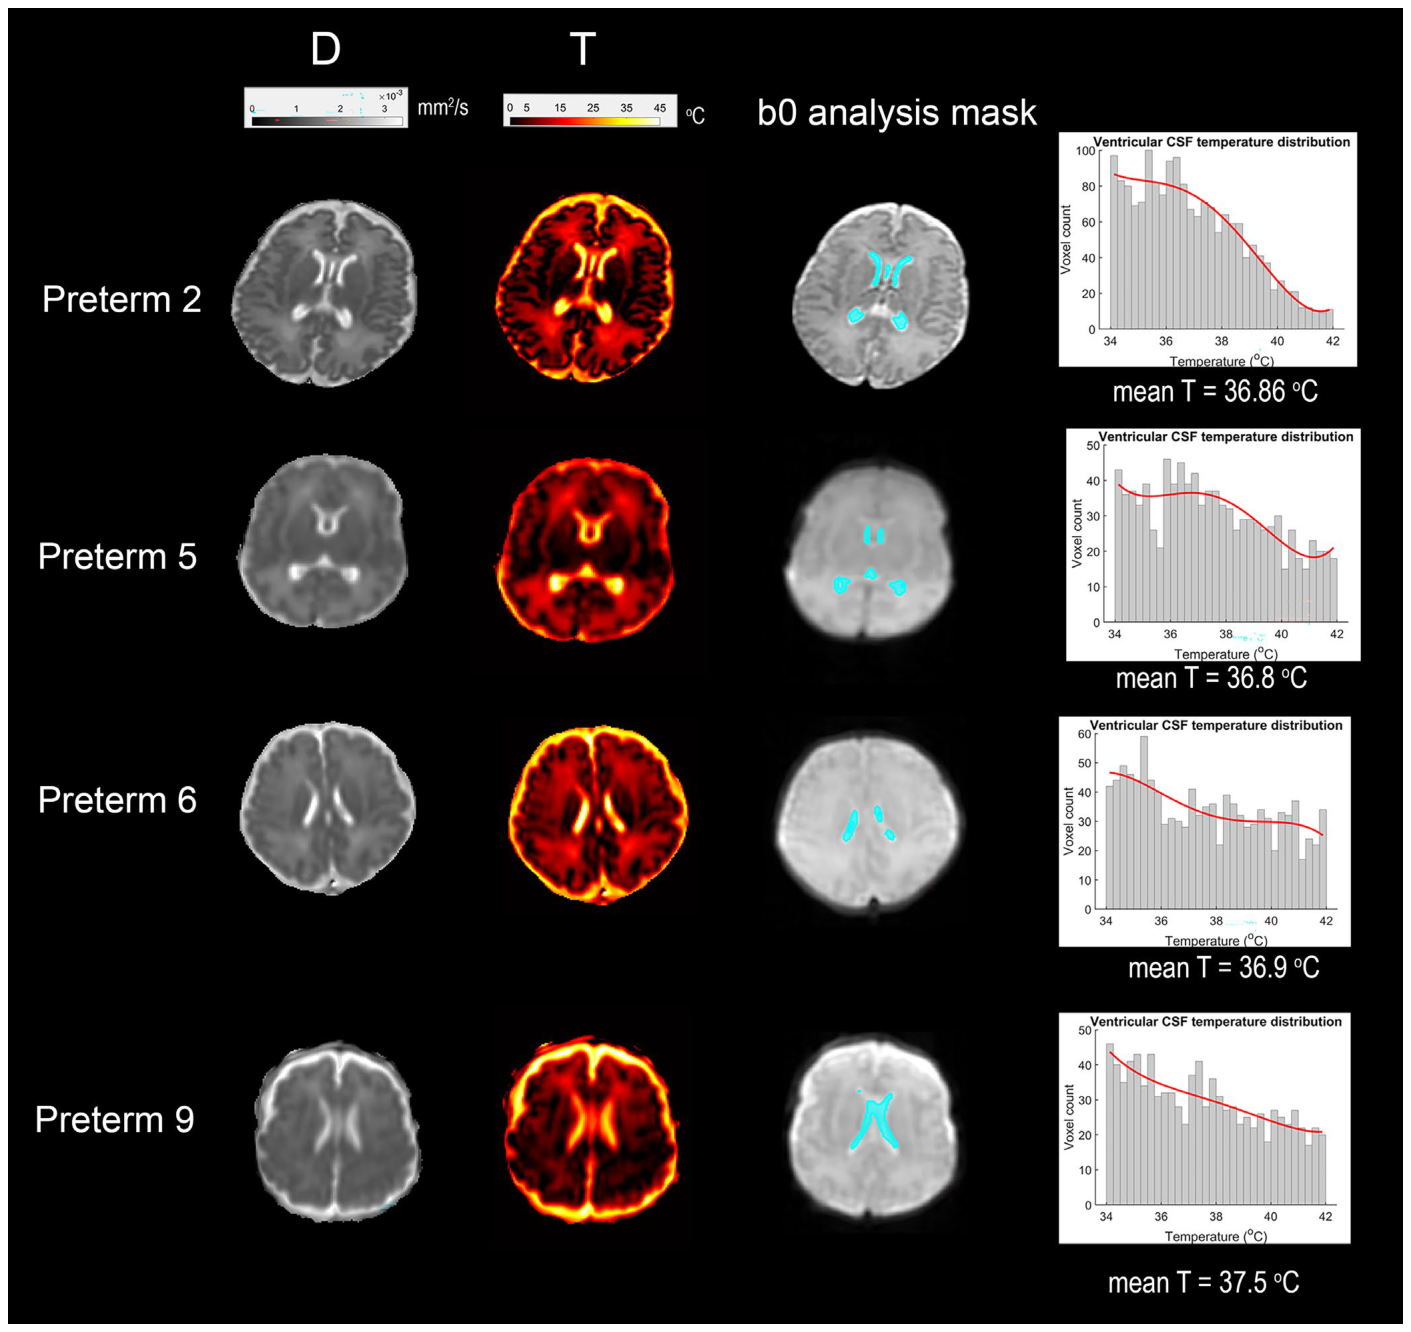
早産児の拡散マップと体温マップの例が
Figure 4. FIGURE 4 | Representative neonatal diffusion-derived temperature measurements. Mean diffusivity (D), corresponding diffusion-derived tem- perature maps (T), and analysis masks are shown for four representative preterm neonates. Cyan indicates voxels retained for quantitative analysis after application of the predefined 34°C–42°C diffusion-derived temperature inclusion criterion. Histograms show the distribution of retained vox- elwise temperature estimates for each subject.解説: 代表的な早産児における拡散由来の体温測定結果を示しています。平均拡散係数(D)、対応する拡散由来の体温マップ(T)、分析マスク、および各対象者における体積要素ごとの体温推定値の分布がヒストグラムで示されています。シアン色で示された領域は、あらかじめ定義された体温基準(34°C~42°C)を満たし、定量分析のために保持された体積要素を示します。
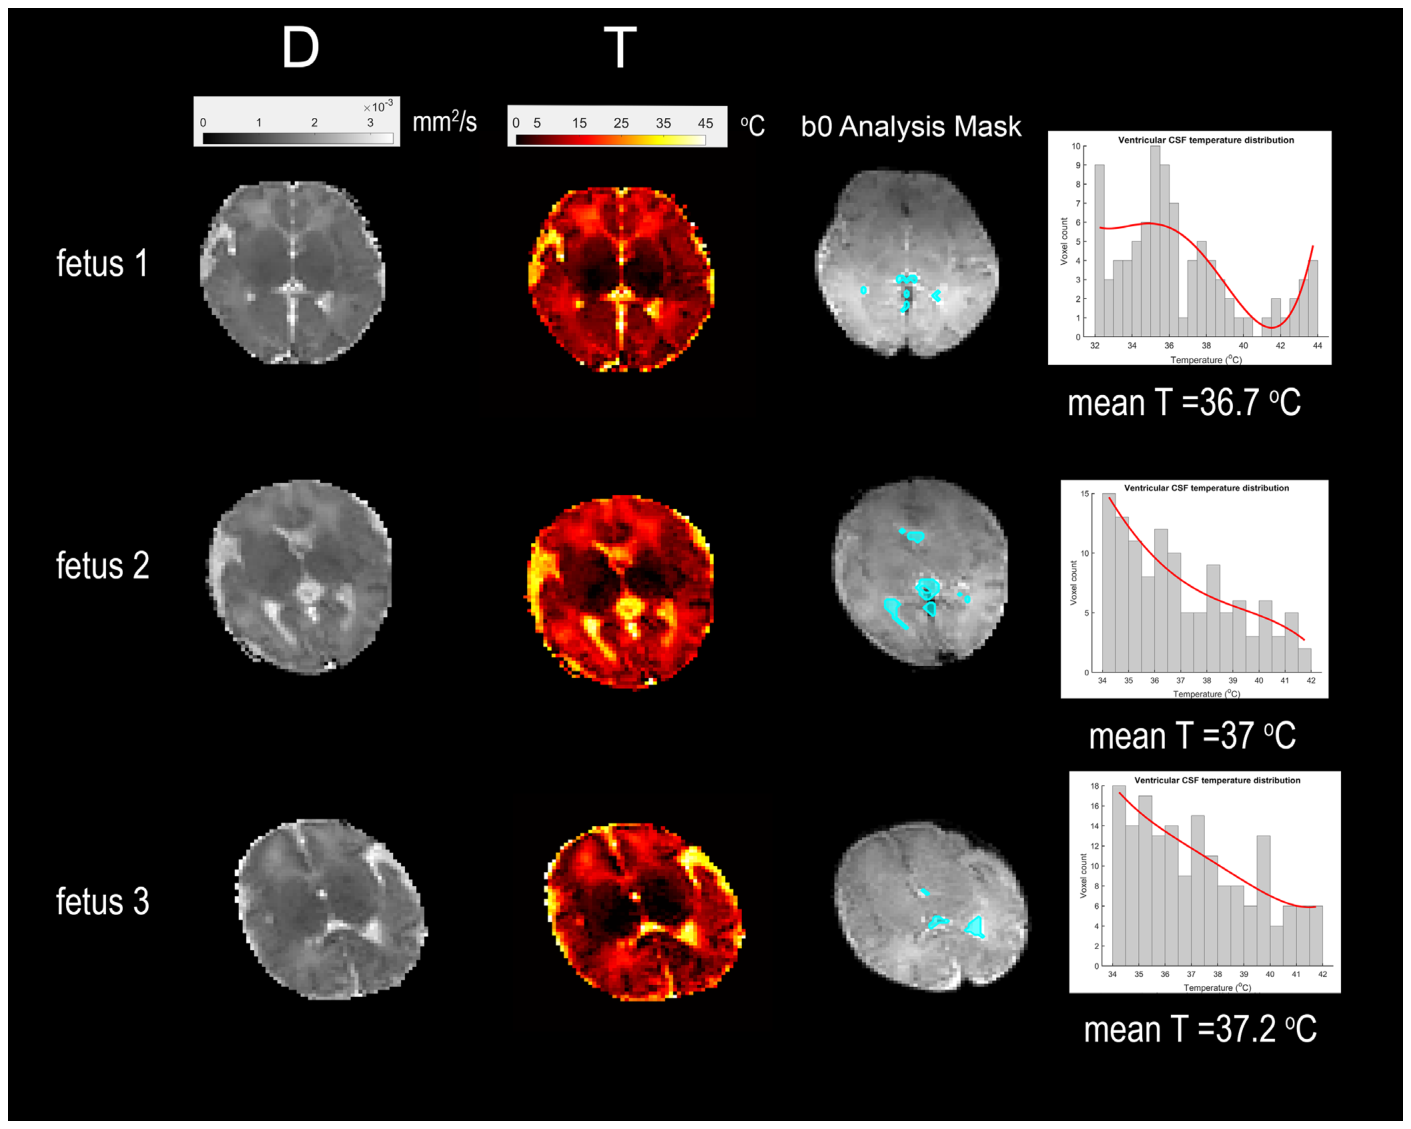
Figure 6. FIGURE 6 | Representative fetal brain diffusion-derived temperature measurements. Mean diffusivity (D), corresponding diffusion-derived tem- perature maps (T), analysis masks, and voxelwise temperature distributions are shown for three representative fetuses. Cyan indicates voxels re- tained for quantitative analysis after application of the predefined 34°C–42°C diffusion-derived temperature inclusion criterion. Histograms show the distribution of diffusion-derived temperatures within the retained analysis voxels; red curves represent fourth-order polynomial fits to the distri- butions. Mean diffusion-derived temperature is reported for each fetus.解説: 代表的な胎児脳における拡散由来の体温測定結果を示しています。平均拡散係数(D)、対応する拡散由来の体温マップ(T)、分析マスク、および体積要素ごとの体温分布が示されています。シアン色で示された領域は、体温基準(34°C~42°C)を満たし、定量分析のために保持された体積要素を示します。
に代表的な胎児の拡散マップと体温マップが示され、
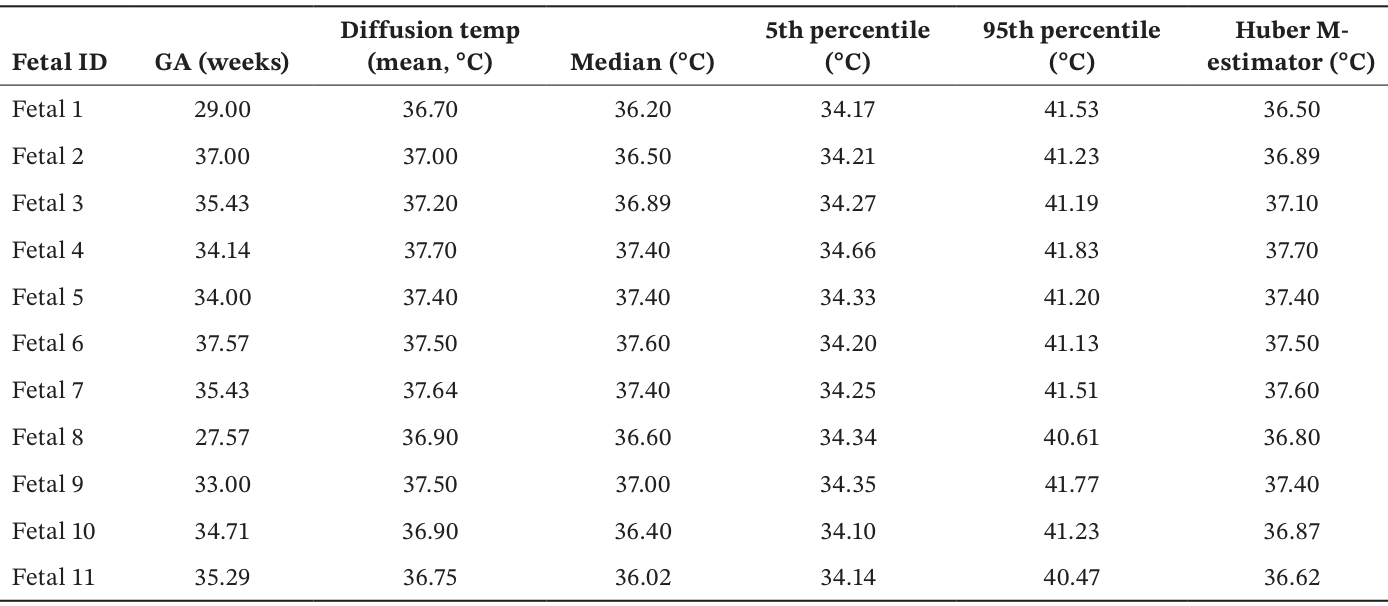
Table 2. TABLE 2 | Diffusion-derived CSF temperature metrics in fetuses, demonstrating consistency across gestational age using mean, median, percentile-based, and Huber M-estimator measures.解説: 胎児における拡散MRIから得られた脳脊髄液(CSF)の体温測定指標を示しています。各胎児の在胎週数、拡散由来の体温の平均値、中央値、5パーセンタイル値、95パーセンタイル値、およびハブアーM推定量による値が一覧になっています。
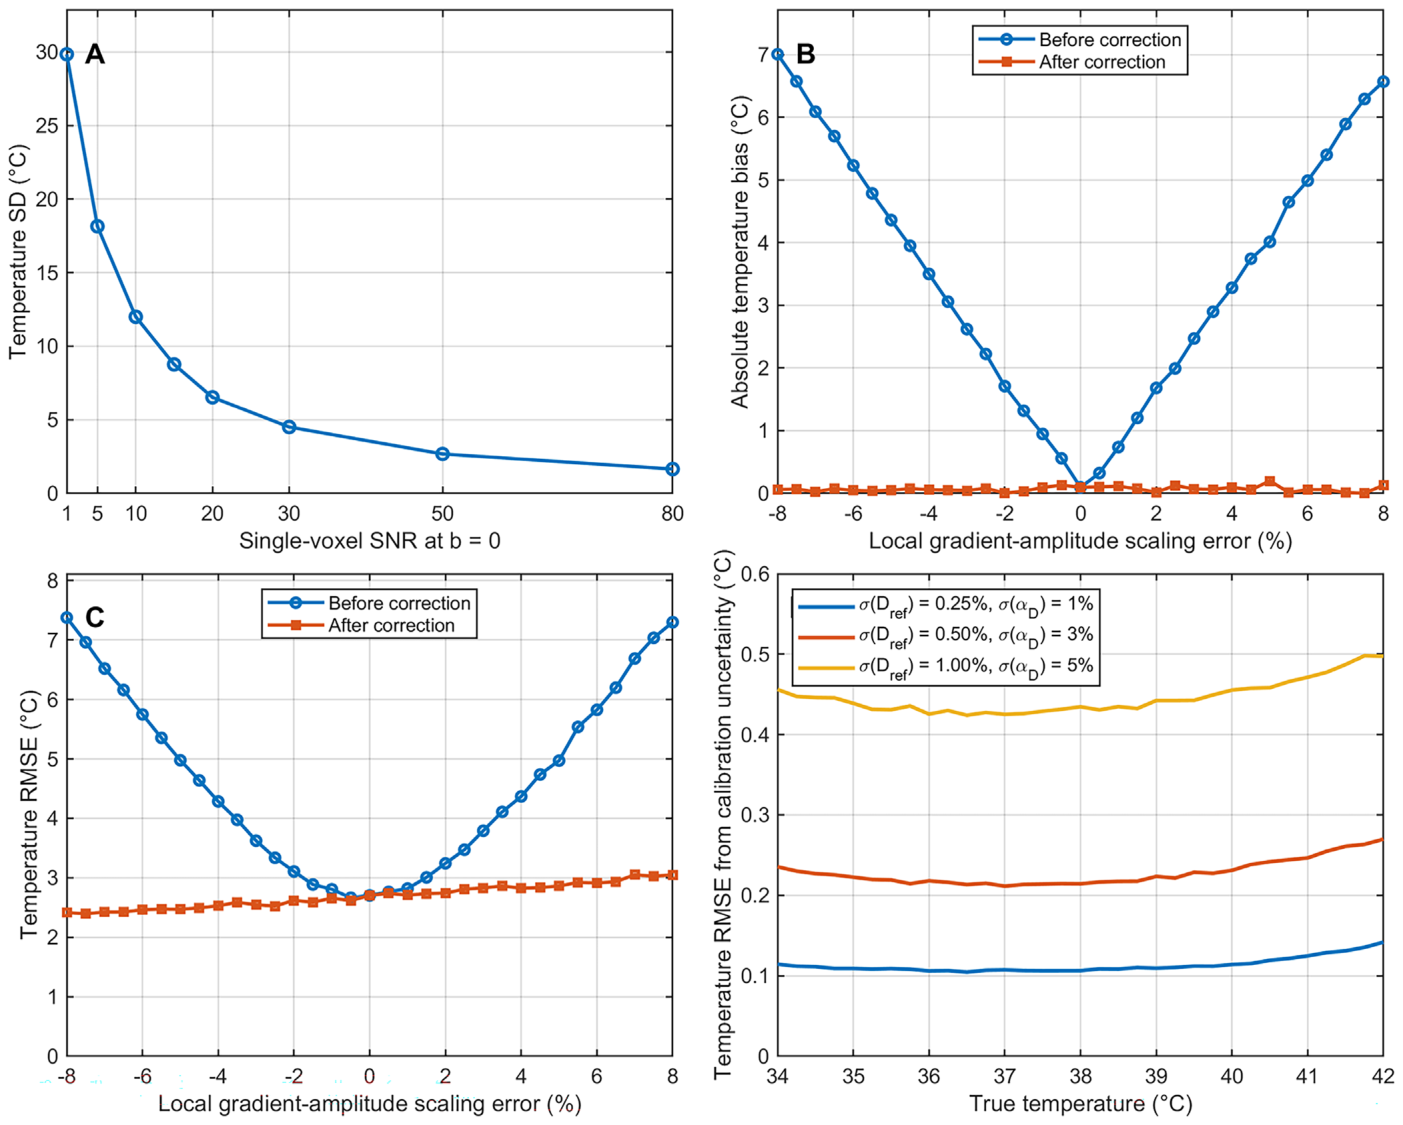
Figure 2. FIGURE 2 | Monte Carlo sensitivity analysis of diffusion MRI-based thermometry to measurement noise, local gradient-amplitude scaling er- rors, effective b value correction, and calibration uncertainty. (A) Temperature precision, expressed as the standard deviation (SD) of estimated temperature, as a function of single-voxel SNR at b = 0, demonstrating improved precision with increasing SNR. (B) Absolute temperature bias as a function of local gradient-amplitude scaling error before and after ideal effective b value correction at SNR = 50. Using nominal b values produces progressively increasing temperature bias with increasing gradient-scaling error magnitude, whereas correction with the corresponding effective b values largely removes this systematic bias. (C) Temperature root-mean-square error (RMSE) under the same conditions. Before correction, RMSE increases with the magnitude of the local gradient-scaling error; after effective b value correction, the remaining error is predominantly noise lim- ited. (D) Calibration-related temperature RMSE over a true temperature range of 34°C–42°C resulting from relative uncertainty in the reference diffusion coefficient (Dref) and fractional diffusion–temperature coefficient (훼D). Three uncertainty scenarios were evaluated:解説: 拡散MRIによる体温測定が、測定ノイズ、局所勾配磁場振幅スケーリング誤差、実効b値補正、および校正の不確実性に対してどれほど影響を受けるかを示すモンテカルロ感度分析の結果です。(A)はSNR増加に伴う体温精度の改善を、(B)は勾配スケーリング誤差が体温バイアスに与える影響と補正の効果を、(C)は同じ条件下での二乗平均平方根誤差(RMSE)の変化を、(D)は校正の不確実性による体温RMSEを示しています。

コメントを残す