どうも、Beyond the Pixelです。肝細胞がん(HCC)は、肝臓に発生する最も一般的な悪性腫瘍で、肝硬変や慢性B型肝炎の対象者に多く見られます。この診断には、CTやMRIを用いた「LI-RADS(Liver Imaging Reporting and Data System)」という分類システムが広く使われています。しかし、LI-RADS v2018は複雑であるため、現場での活用や読影者間の一貫性に課題がありました。今回ご紹介する大規模なメタアナリシスでは、このLI-RADS v2018の診断アルゴリズムを簡素化しても、その診断性能が維持できるのかを評価しました。その結果、ある特定の簡素化によって、診断精度を損なうことなく、より使いやすいシステムが実現できる可能性が示されました。
研究サマリー(FINER & PICO)
Feasible実施可能性
既存のLI-RADS Living Systematic ReviewおよびIPD Meta-analysis Projectからデータが利用されており、実現可能です。
P (肝細胞がんリスクのある対象者における肝病変), I (簡素化されたCT/MRI LI-RADS v2018), C (標準CT/MRI LI-RADS v2018), O (診断性能: AUC, 感度, 特異度, PPV)。
LI-RADSとは?その複雑性と簡素化の必要性
どうも、Beyond the Pixelです。肝細胞がん(HCC)は、肝臓に発生する最も一般的な悪性腫瘍で、肝硬変や慢性B型肝炎の対象者に多く見られます。この診断には、CTやMRIを用いた「LI-RADS(Liver Imaging Reporting and Data System)」という分類システムが広く使われています。LI-RADS v2018の診断アルゴリズムは、観察サイズ、非リム動脈相過剰造影(APHE)、非末梢性ウォッシュアウト、増強カプセル、そして閾値増大(TG)という5つの主要な特徴を評価することで、HCCの可能性を評価します。
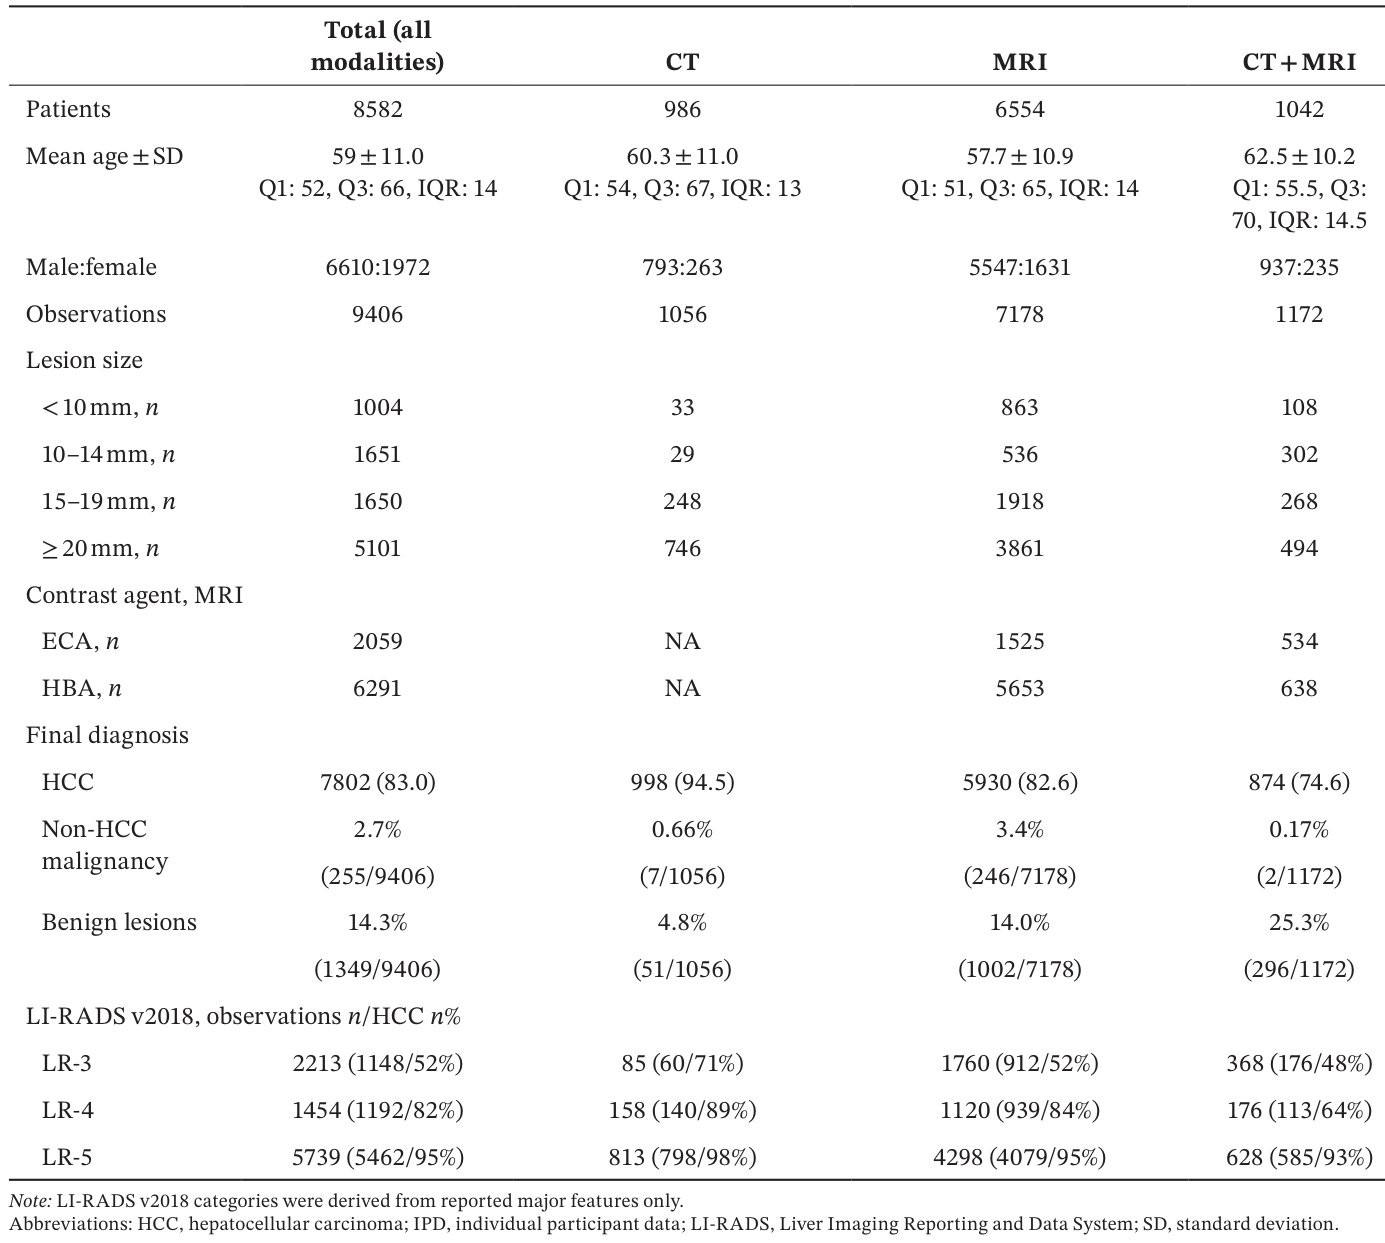
この研究は、レトロスペクティブなメタアナリシスとして実施され、LI-RADS Living Systematic Review and IPD Meta-analysis Projectから得られた個人参加者データ(IPD)が用いられました。対象となったのは、HCCのリスクがある8,582名の対象者から得られた9,406の肝病変の観察データです。
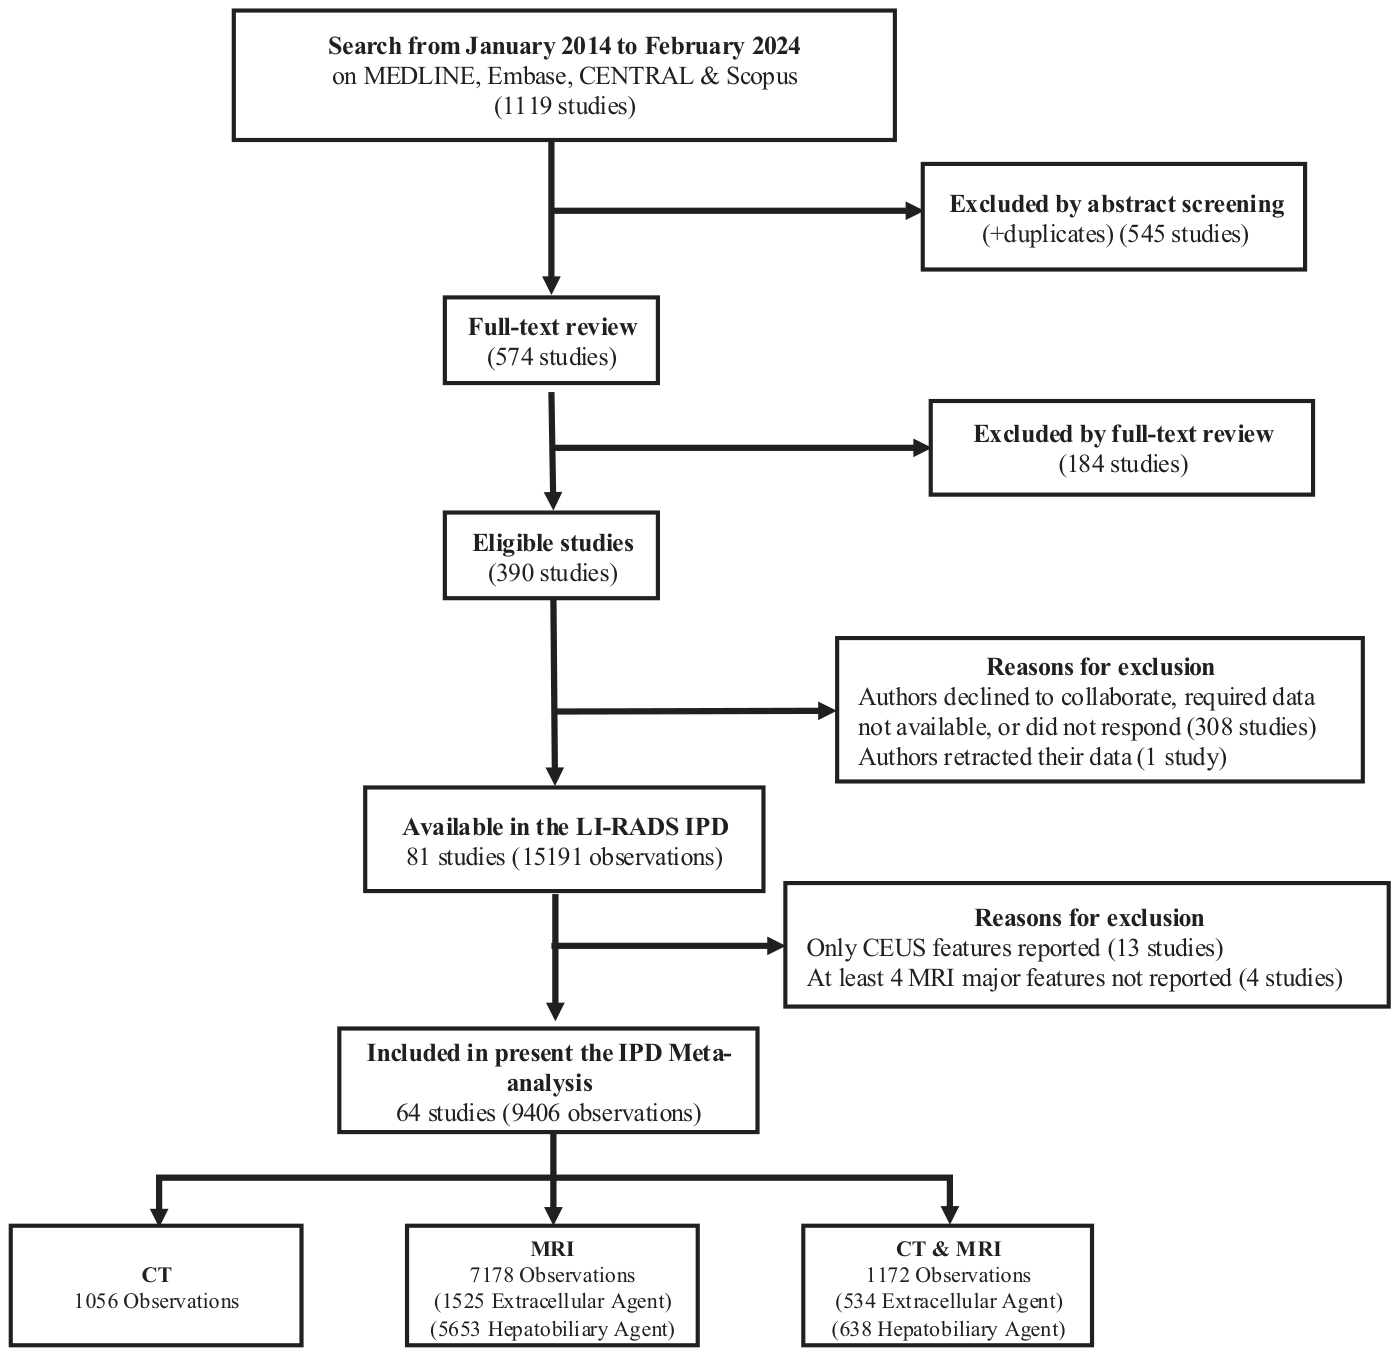
Figure 1. FIGURE 1 | Flow diagram shows search results, study review, and exclusion criteria. Of the 1119 studies identified, 64 met inclusion criteria and contributed data to the IPD meta-analysis, comprising 9406 observations. CEUS, contrast-enhanced ultrasound; IPD, individual participant data; LI-RADS, Liver Imaging Reporting and Data System.解説: このフローチャートは、研究のスクリーニング、包含基準、除外基準の概要を示しています。1119の研究が特定され、最終的に64の研究が本IPDメタアナリシスに含まれ、9406の観察が分析されました。
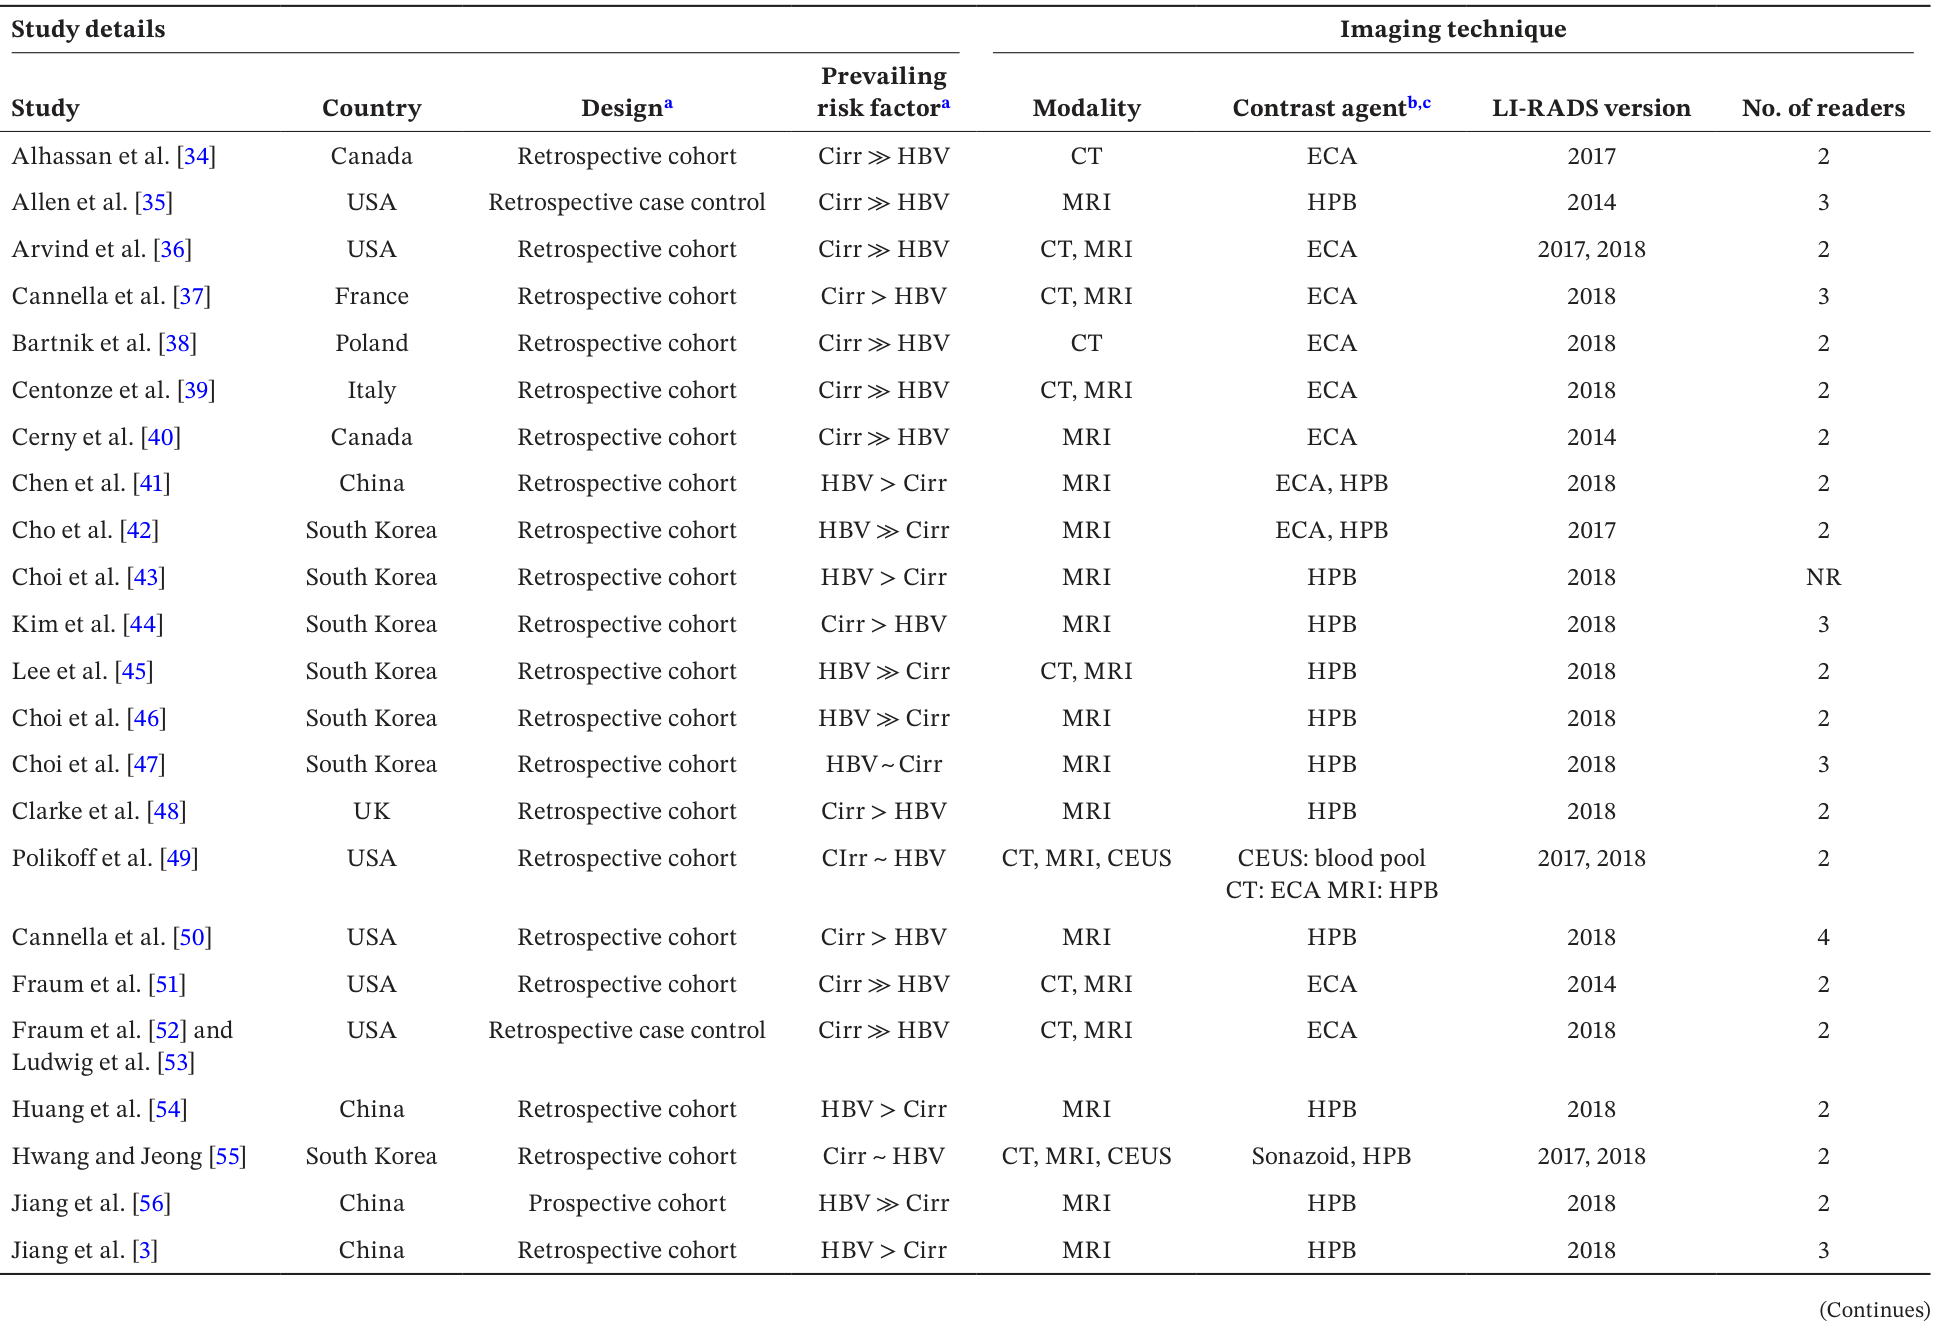
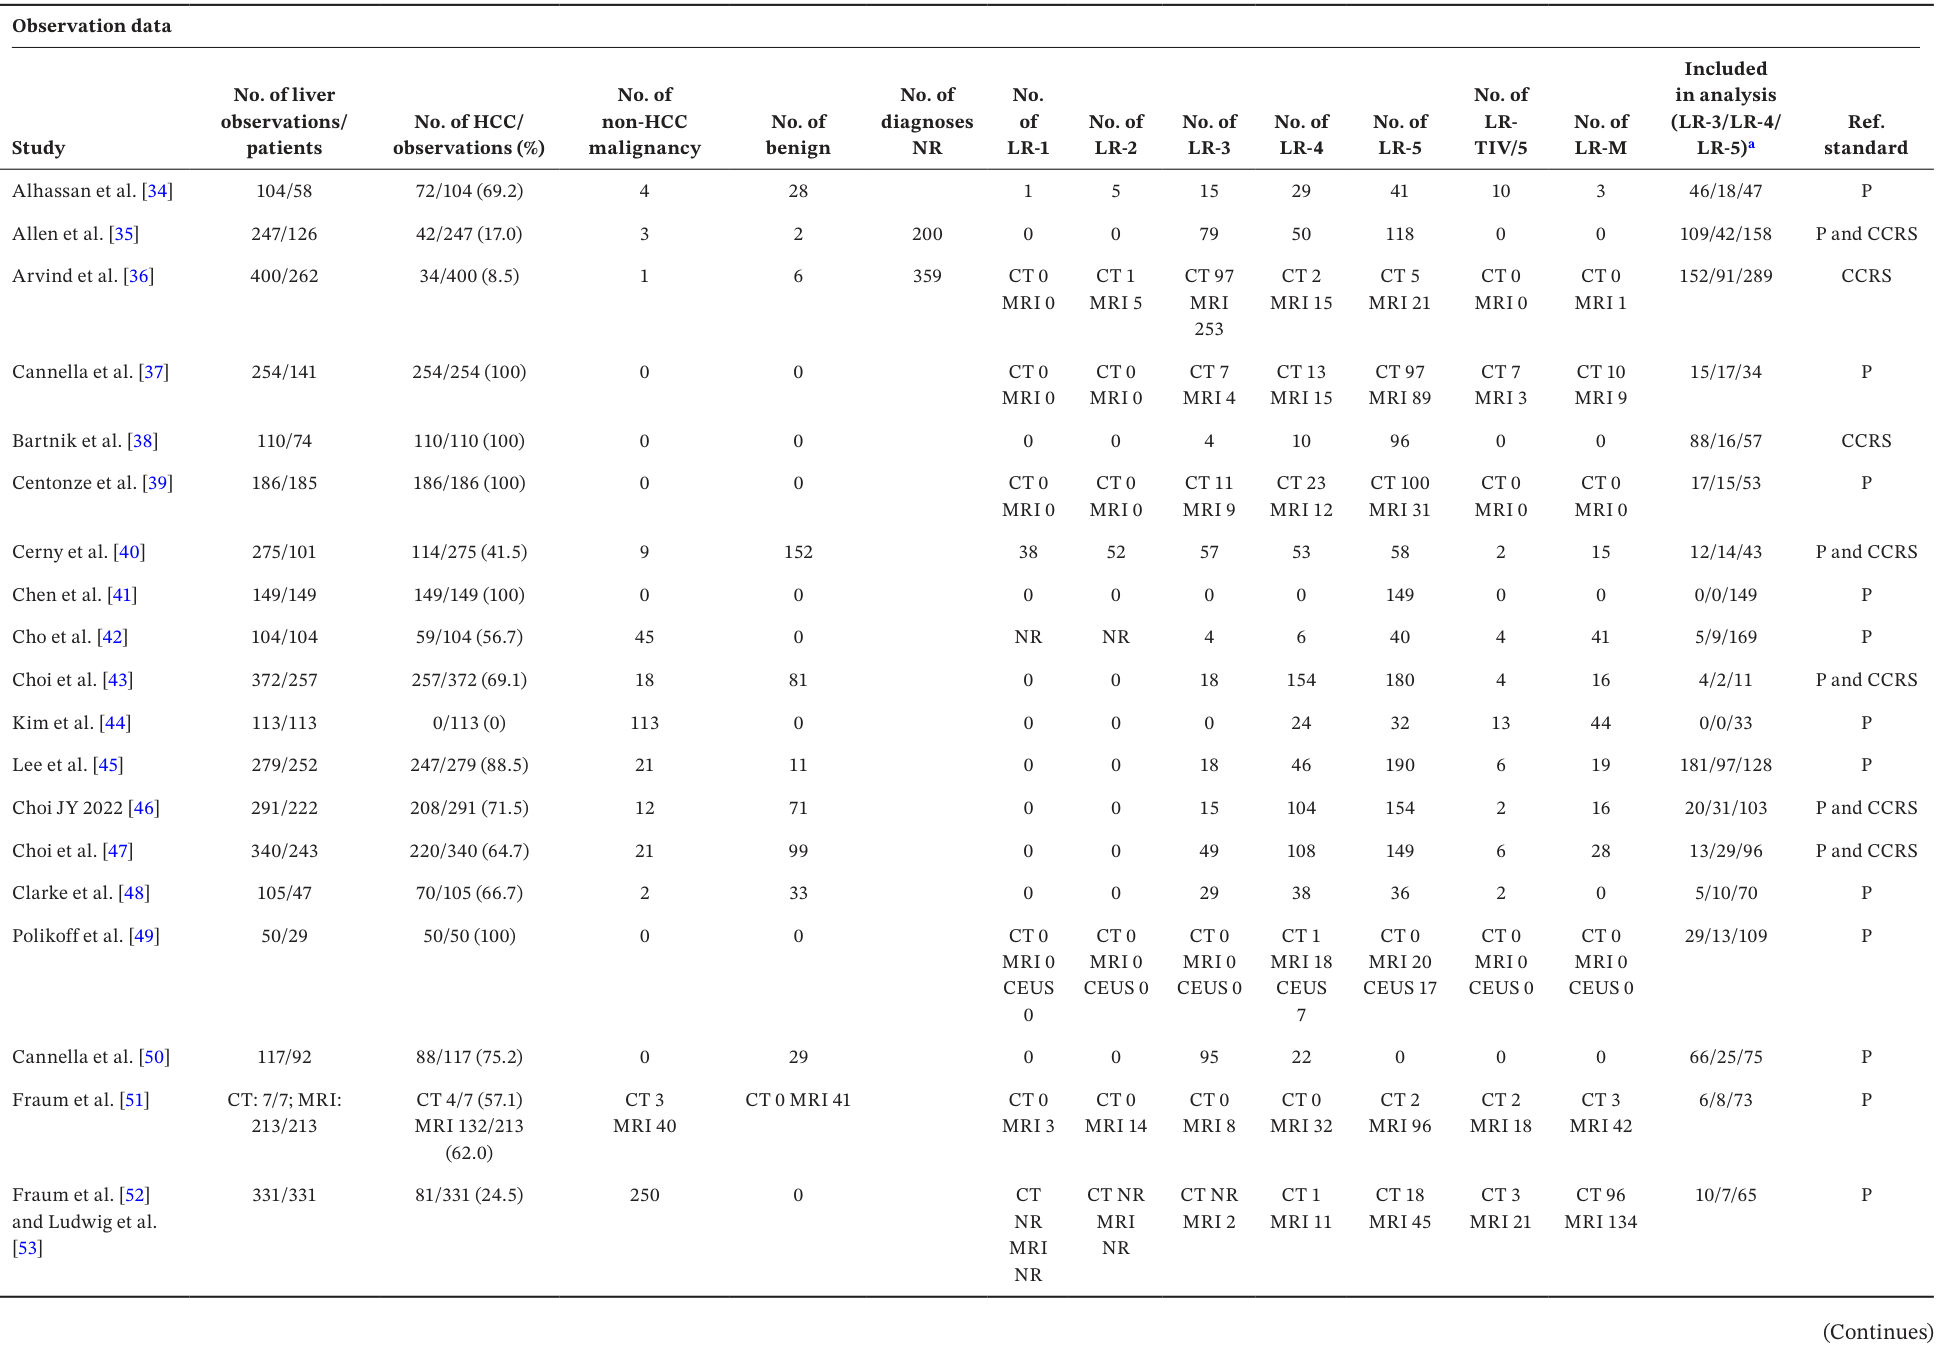
Table 1. TABLE 1 | Study details of included studies.解説: この表は、含まれた研究の詳細を示しており、国、研究デザイン、主なリスク因子、モダリティ、造影剤、LI-RADSバージョン、読影者の数などの情報が含まれています。Table 2. TABLE 2 | Observation data of included studies.解説: この表は、含まれた研究の観察データを示しており、肝病変の総数、HCCの数と割合、非HCC悪性腫瘍や良性病変の数、および各LI-RADSカテゴリ(LR-1からLR-M)に分類された観察数、ならびに参照標準の情報が含まれています。
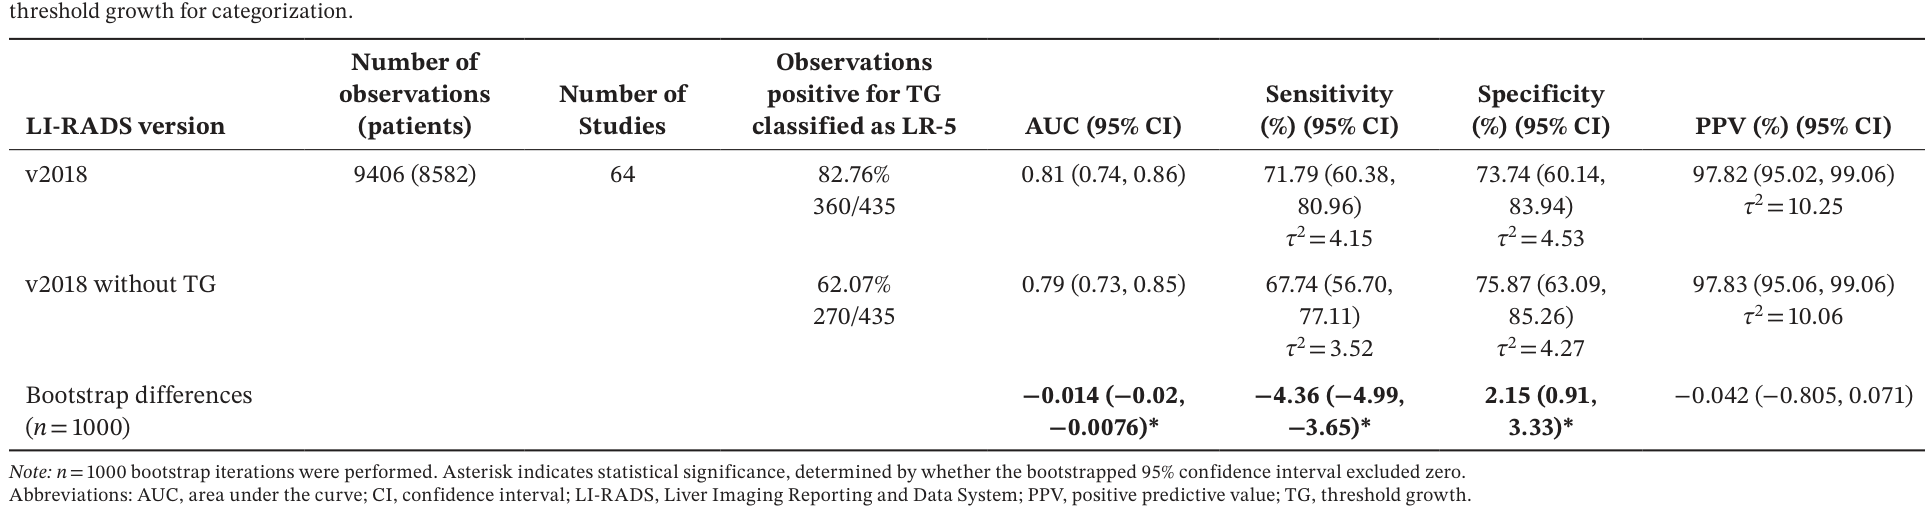
この研究では、簡素化がLI-RADS v2018の診断性能にどのような影響を与えるかが詳細に分析されました。まず、TGを診断カテゴリから除外した場合、LI-RADS v2018と比較してAUCはわずかに減少しましたが、LR-5の感度は低下し(71.79% vs 67.74%)、特異度は増加しました(73.74% vs 75.87%)。PPVには有意な差は見られませんでした。
Table 4. TABLE 4 | Standard CT/MRI LI-RADS v2018 diagnostic performance for LR-5 observations and diagnostic table performance for LR categories compared to a simplified LI-RADS v2018 without解説: この表は、LR-5観察のLI-RADS v2018の診断性能と、閾値増大(TG)を除外した簡素化LI-RADS v2018の診断テーブル性能を比較しています。AUC、感度、特異度、陽性予測値(PPV)が95%信頼区間とともに示され、v2018とTGを除外した場合の間のブートストラップ差分も含まれています。
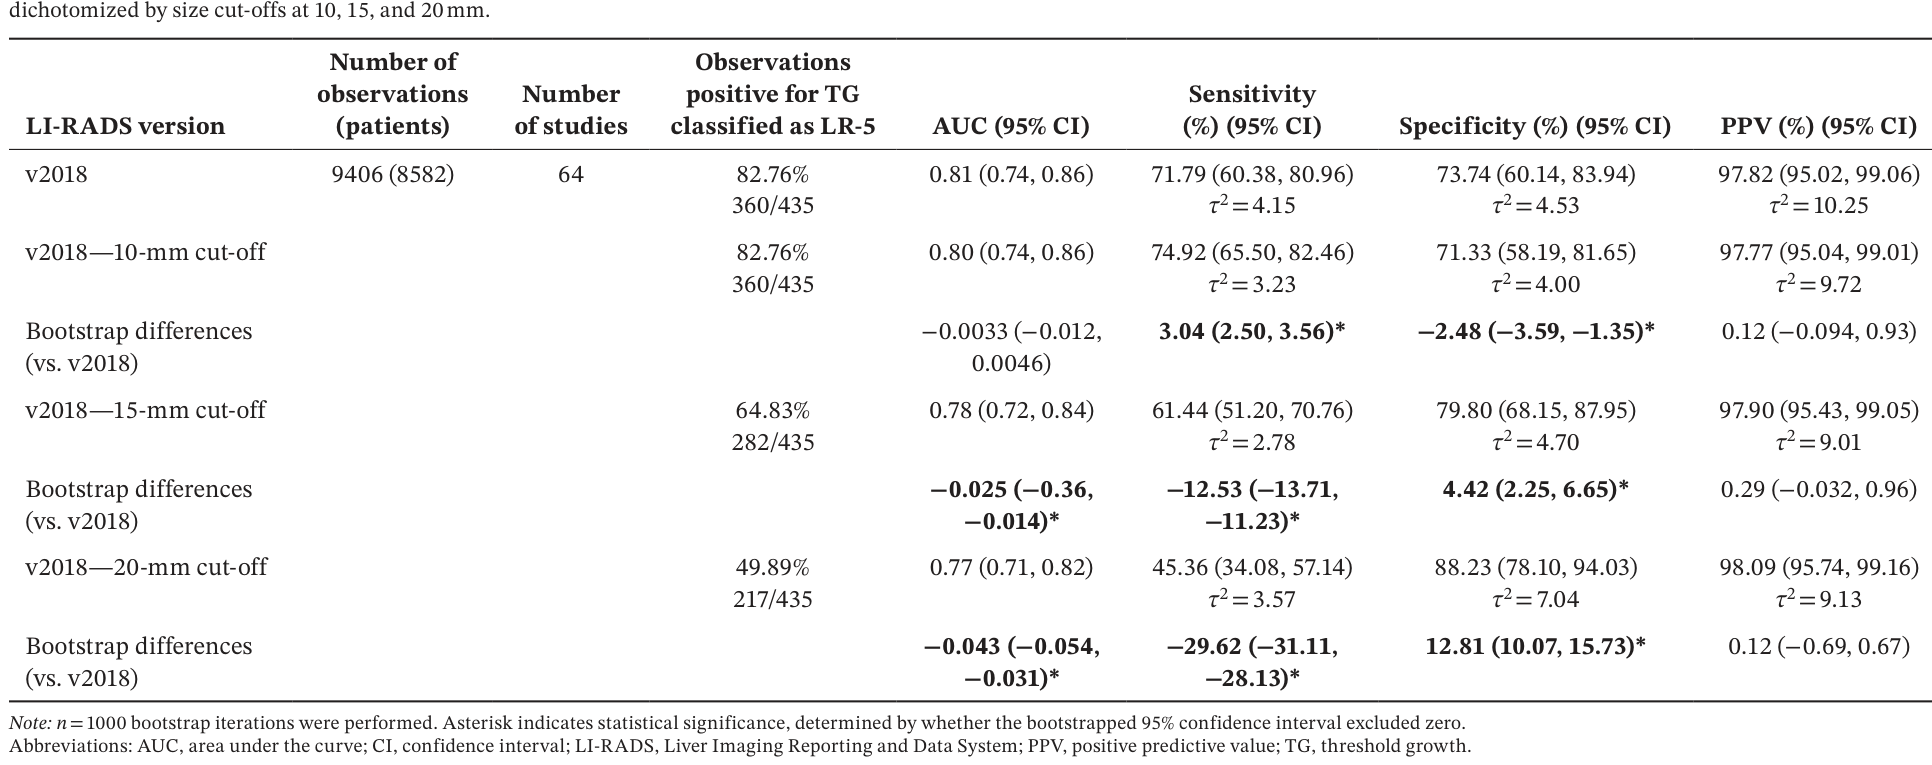
Table 5. TABLE 5 | Standard CT/MRI LI-RADS v2018 diagnostic performance for LR-5 observations and diagnostic table performance for LR categories compared to a simplified LI-RADS v2018 with observations解説: この表は、LR-5観察のLI-RADS v2018の診断性能と、観察を10mm、15mm、20mmのサイズカットオフで二値化した簡素化LI-RADS v2018の診断テーブル性能を比較しています。AUC、感度、特異度、陽性予測値(PPV)が95%信頼区間とともに示され、v2018とのブートストラップ差分も含まれています。
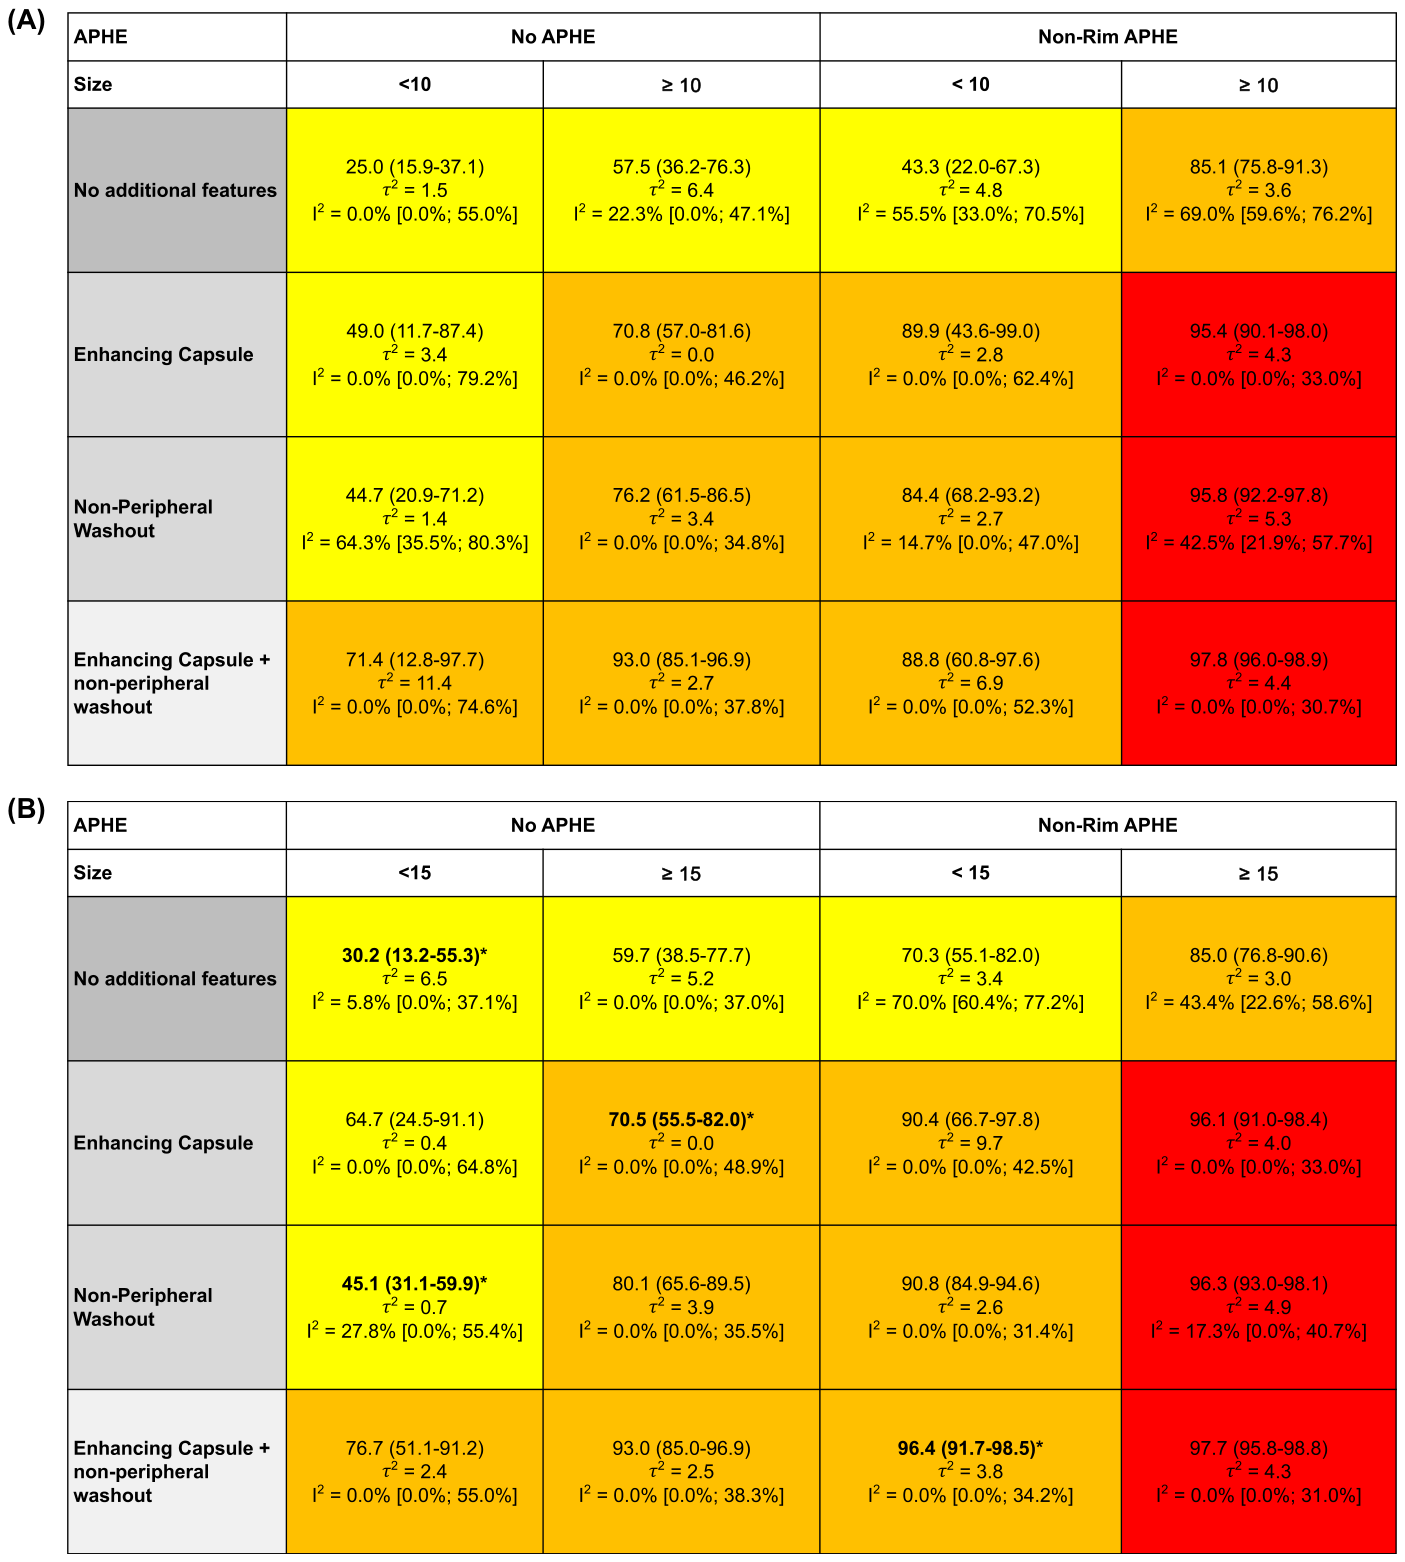
最も重要な発見は、TGの除去と10mmの単一サイズカットオフを組み合わせた場合です。この簡素化されたアルゴリズムは、LI-RADS v2018と比較してAUCに有意な差はなく、LR-5の感度は有意に改善しました(71.79% vs 73.82%)。特異度とPPVにも有意な差は認められませんでした。
Table 6. Table 6 summarizes the diagnostic performance of CT/ MRI LI-RADS v2018, without TG, but with size cut-offs.解説: この表は、LR-5観察のLI-RADS v2018の診断性能と、閾値増大(TG)を除外し、かつ観察を10mm、15mm、20mmのサイズカットオフで二値化した改訂版LI-RADS v2018の診断テーブル性能を比較しています。AUC、感度、特異度、陽性予測値(PPV)が95%信頼区間とともに示され、v2018とのブートストラップ差分も含まれています。
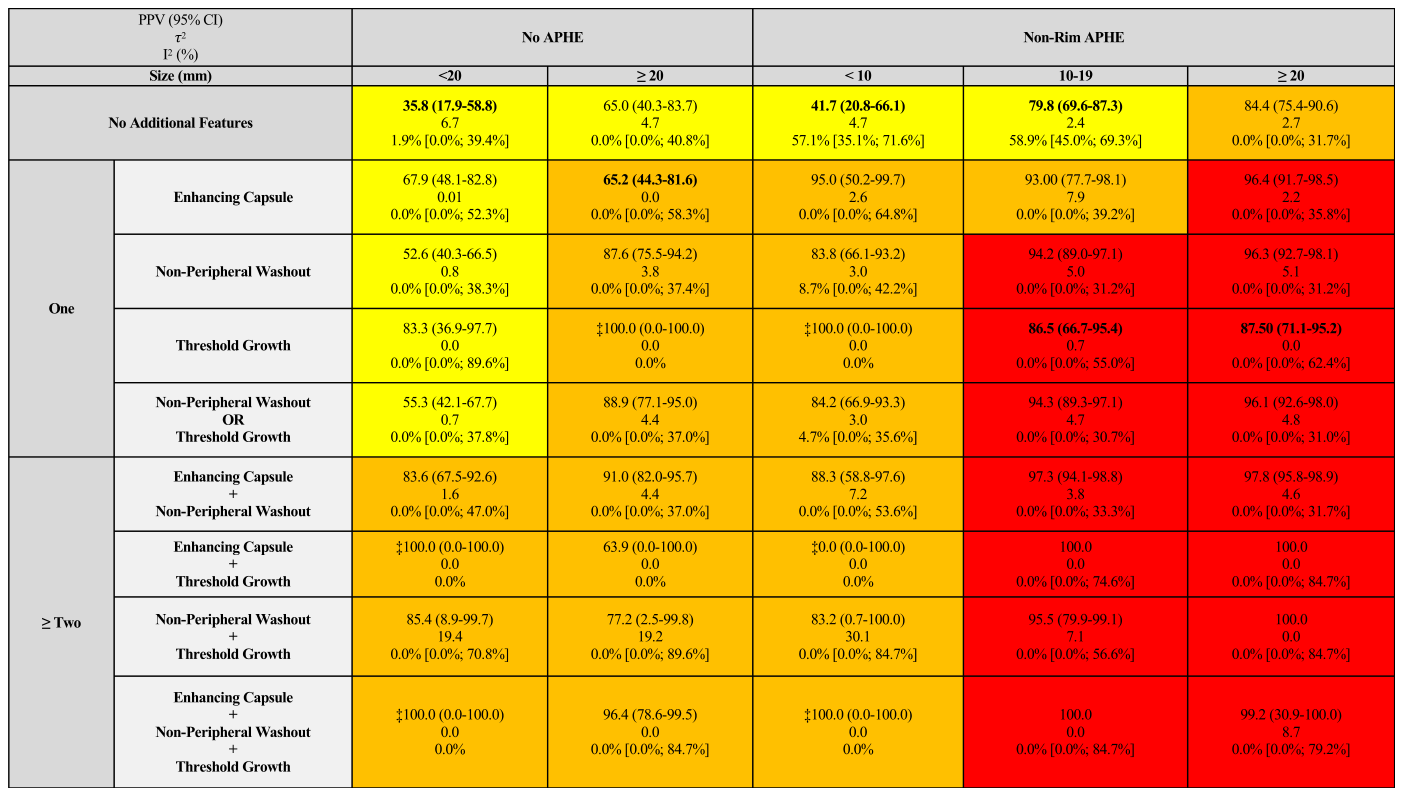
Figure 3. FIGURE 3 | Diagnostic table illustration of random effects model of positive predictive value (PPV) for diagnosis of HCC with 95% confidence in- tervals (CI), and heterogeneity measures τ2 and I2 (%) for v2018 CT/MRI LI-RADS major feature combinations. PPV (95% CI) values (top of each cell), τ2 and I2 values (bottom of each cell) are shown to reflect diagnostic performance and between-study heterogeneity, respectively. PPVs increased with observation size, presence of non-rim APHE, and the number of additional major features. LR-3 combinations (yellow) had the lowest PPVs and often high heterogeneity (I2), LR-4 combinations (orange) showed intermediate PPVs with variable heterogeneity, while LR-5 combinations (red) demonstrated consistently high PPVs with variable heterogeneity. Cells with bold text and an asterisk (*) represent individual combination PPVs that were significantly different from their overall category PPV. ‡ represents a cell whose PPV is derived from observations that were either all negative or positive for HCC. APHE, arterial phase hyperenhancement; HCC, hepatocellular carcinoma; LI-RADS, Liver Imaging Reporting and Data System; LR, LI-RADS; PPV, positive predictive value.解説: この診断テーブルは、v2018 CT/MRI LI-RADSの主要な特徴の組み合わせにおけるHCC診断の陽性予測値(PPV)のランダム効果モデルと、異質性指標(τ²およびI²)を95%信頼区間(CI)とともに示しています。PPVは観察サイズ、非リムAPHEの存在、および追加の主要な特徴の数とともに増加する傾向が見られました。太字とアスタリスク(*)が付いているセルは、そのPPVが全体的なカテゴリのPPVと有意に異なることを示しています。
Figure 4. FIGURE 4 | Diagnostic table illustration of random effects model of positive predictive value (PPV) for diagnosis of HCC with 95% confidence intervals (CI), and heterogeneity measures τ2 and I2 (%) for CT/MRI LI-RADS major feature combinations without threshold growth. Observations were dichotomized by size cut-offs at 10 mm (A), 15 mm (B), and 20 mm (C). (A) 10 mm—no outliers were found to be significantly different from their overall category PPV. (B) 15 mm—four outliers were found to be significantly different from their overall category PPV. (C) 20 mm—five outliers were found to be significantly different from their overall category PPV. PPV (95% CI) values (top of each cell), τ2 and I2 values (bottom of each cell) are shown to reflect diagnostic performance and between-study heterogeneity, respectively. PPVs increased with observation size, presence of non- rim APHE, and the number of additional major features. LR-3 combinations (yellow) had the lowest PPVs and often high heterogeneity (I2), LR-4 combinations (orange) showed intermediate PPVs with variable heterogeneity, while LR-5 combinations (red) demonstrated consistently high PPVs with variable heterogeneity. Cells with bold text and an asterisk (*) represent individual combination PPVs that were significantly different from their overall category PPV. Direction of significance can be found in Tables S3 and S5. APHE, arterial phase hyperenhancement; HCC, Hepatocellular Carcinoma; LI-RADS, Liver Imaging Reporting and Data System; LR, LI-RADS; PPV, positive predictive value.解説: この診断テーブルは、閾値増大を除外し、サイズカットオフを10mm(A)、15mm(B)、20mm(C)で二値化したCT/MRI LI-RADSの主要な特徴の組み合わせにおけるHCC診断の陽性予測値(PPV)のランダム効果モデルと、異質性指標(τ²およびI²)を95%信頼区間(CI)とともに示しています。Aの10mmカットオフでは、全体的なカテゴリPPVと有意に異なる外れ値は見られませんでした。Bの15mmカットオフでは4つ、Cの20mmカットオフでは5つの外れ値が見られました。
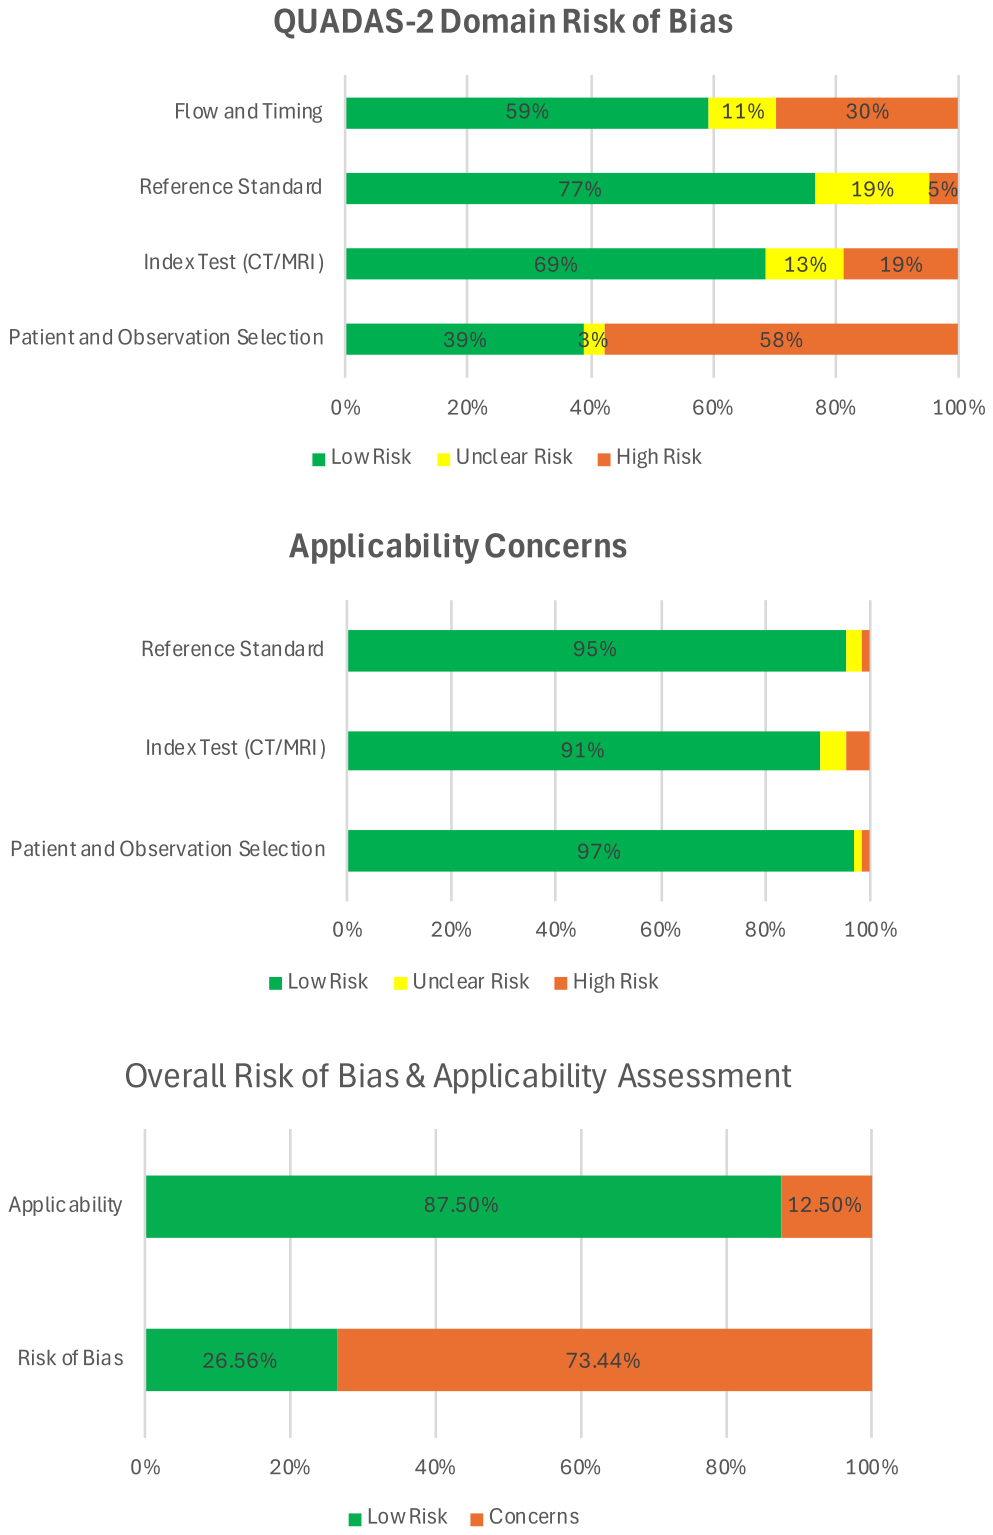
本研究は大規模なIPDメタアナリシスであり、その知見は貴重ですが、いくつかの限界も存在します。第一に、CTとMRIを組み合わせた分析であったため、CTまたはMRI単独の場合に結果が一般化できるかはさらなる検証が必要です。第二に、AUCの比較はLR-3、LR-4、LR-5観察に限定されており、LI-RADSの全範囲を反映しているわけではありません。第三に、MR磁場強度(1.5T vs 3T)や造影剤の種類による診断性能の違いは評価されていません。第四に、付属的特徴(AFs)の役割は本研究の簡素化の範囲外として評価されていません。第五に、特定の主要な特徴の組み合わせではサンプルサイズが限られており、95%信頼区間が広くなる傾向がありました。第六に、64の研究のうち47の研究が、後方視的デザインにおける組織病理学を組み込み基準とした選択バイアスや、画像診断と病理確認の時間間隔が長い・不明確であることなどから、バイアスリスクが高いと評価されました。
Figure 2. FIGURE 2 | Quality Assessment of Diagnostic Accuracy Studies 2 (QUADAS-2) risk of bias assessment. There was a total of 64 studies included in the assessment. Most studies showed low risk of bias in the index CT/MRI and reference standard domains, while patient and observation selec- tion, and flow and timing domains demonstrated higher risk of bias (top row). Overall risk of bias was high in a substantial proportion of studies, but applicability concerns were generally low across studies (bottom panel).解説: この図は、診断精度研究の質評価ツールであるQUADAS-2を用いたバイアスリスクと適用可能性の評価結果を示しています。ほとんどの研究で、インデックス検査(CT/MRI)と参照標準のドメインではバイアスリスクが低い一方で、対象者および観察の選択、ならびにフローとタイミングのドメインではバイアスリスクが高い傾向が見られました。全体的なバイアスリスクは高かったものの、適用可能性への懸念は概ね低いと評価されています。


コメントを残す