どうも、Beyond the Pixelです。世界の移植用臓器の深刻な不足は、公衆衛生上の大きな課題であり続けています。現在の保存方法では、腎臓は約24~36時間、心臓や肺はわずか4~6時間しか保存できず、これが多くの臓器が廃棄される原因となっています。このような現状を打破する技術として期待されているのが、「ガラス化」(vitrification)という凍結保存法です。ガラス化は、生体材料を結晶氷なしの「アモルファス」(非晶質)ガラス状に急速冷却することで、半永久的な保存を可能にする技術です。これにより、臓器の供給と需要のミスマッチを解消し、移植医療に革命をもたらす可能性があります。しかし、組織や臓器をガラス化する上で重要な課題の一つが、凍結保護剤(Cryoprotective Agent, CPA)を生体組織に適切に導入するプロセスです。CPAが不足すると組織内で氷が形成され、組織損傷の原因となります。逆にCPAが過剰に導入されると、薬剤の毒性によって組織が傷ついてしまいます。この重要なCPAの導入プロセスについて、生体内でどのように進行するのか、その詳細な理解はこれまで十分に解明されておらず、一貫性のない結果や回復率の低下につながっています。これまでのCPA浸透に関する生体内測定は、個々のCPA濃度を区別できず、その妥当性も十分に検証されていませんでした。
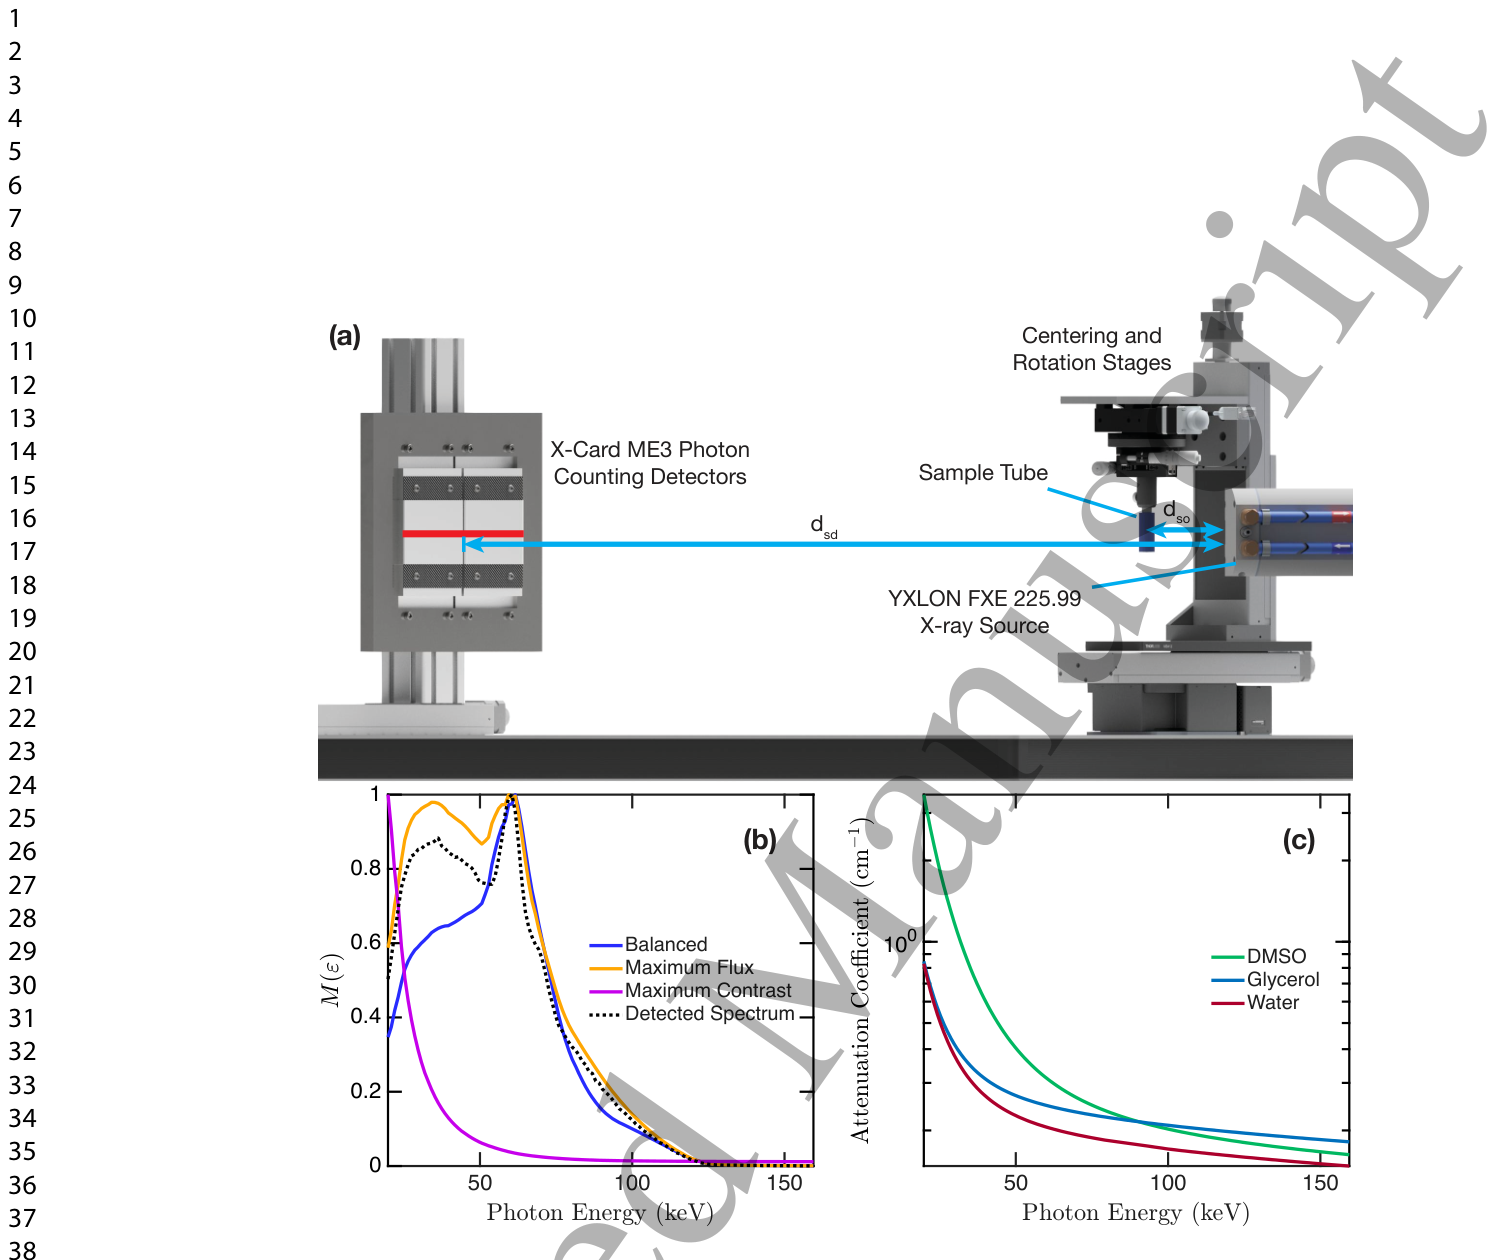
Figure 1. Figure 1: (a) The X-ray source is a tungsten-target YXLON FXE225.99 X-ray source with the directional head installed. The source emits a polychromatic cone beam with a 15° angle. The detector in this study is a Detection Technologies X-Card ME3 line detector capable of up to 128 photon energy bins. The approximate line detection region is indicated with a red line on the detector. (Not shown in figure 1 is a custom cooling system to keep the ME3 detector cool during operation.) The sample is in a 15 mL conical tube, which is connected from above to a stack of rotation and centering stages. The source to detector distance, dsd, is 1,367 mm; the source to object distance, dso, is 140 mm. (b) The measured spectrum and the energy metric, M(ε), for the range of emitted photon energies. Note that the balanced strategy does not necessarily choose the bins with the highest flux. (c) The linear attenuation coefficients for the three liquid components: DMSO, glycerol, and water. At low photon energies the DMSO has great contrast with glycerol and water, but glycerol and water have low contrast with one another. The balanced energy bin contrast metric considers this in choosing the optimal bins while the maximum contrast strategy does not.解説: (a)は、X線源、フォトンカウンティング検出器、および試料台を含むカスタムX線CTシステムの概略図を示しています。(b)は、放出されたX線光子エネルギーの範囲に対する測定スペクトルとエネルギー指標M(ε)の関係を示しており、バランス戦略が必ずしも最高のフラックスを持つビンを選択するわけではないことが分かります。(c)は、DMSO、グリセロール、水の3つの液体成分の線減衰係数を示しており、低光子エネルギーではDMSOがグリセロールや水との間に大きなコントラストを持つ一方で、グリセロールと水の間にはコントラストが低いことが示されています。
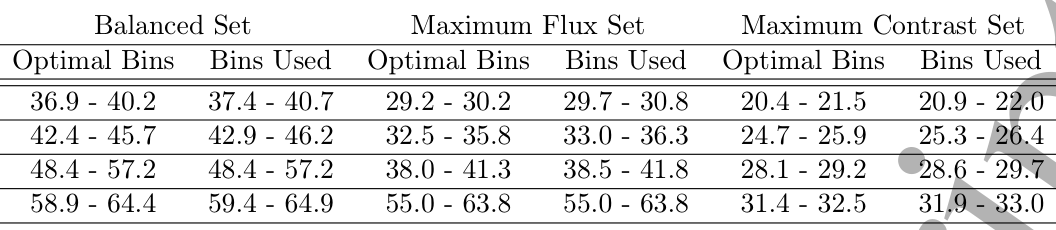
Table 2. Table 2: The energy bins (keV) used for the different bin-choice strategies in ascending energy order (not ascending metric order). The bins output by the program are in increments of 1.1 keV. The detector bins may not perfectly align with the bins output by the selection algorithm, which is the cause of the discrepancy between the optimal bins and the bins used.解説: 各ビン選択戦略(バランス、最大フラックス、最大コントラスト)で用いられたエネルギービン(keV)を昇順に示した表です。プログラムが出力した最適なビンと、検出器で実際に使用されたビンとの間にわずかなずれがあることが示されています。
Table 1. Table 1: Two solutions are tested with different amounts of DMSO and glycerol to validate the decomposition method and energy bin selection algorithm. The measured density of each component is shown; they are close to the reference densities. The volume fractions should sum to one.解説: 分解法とエネルギービン選択アルゴリズムの検証に用いられた、DMSO、グリセロール、水の量を変えた2種類の溶液における各成分の密度、質量、体積、体積分率をまとめた表です。
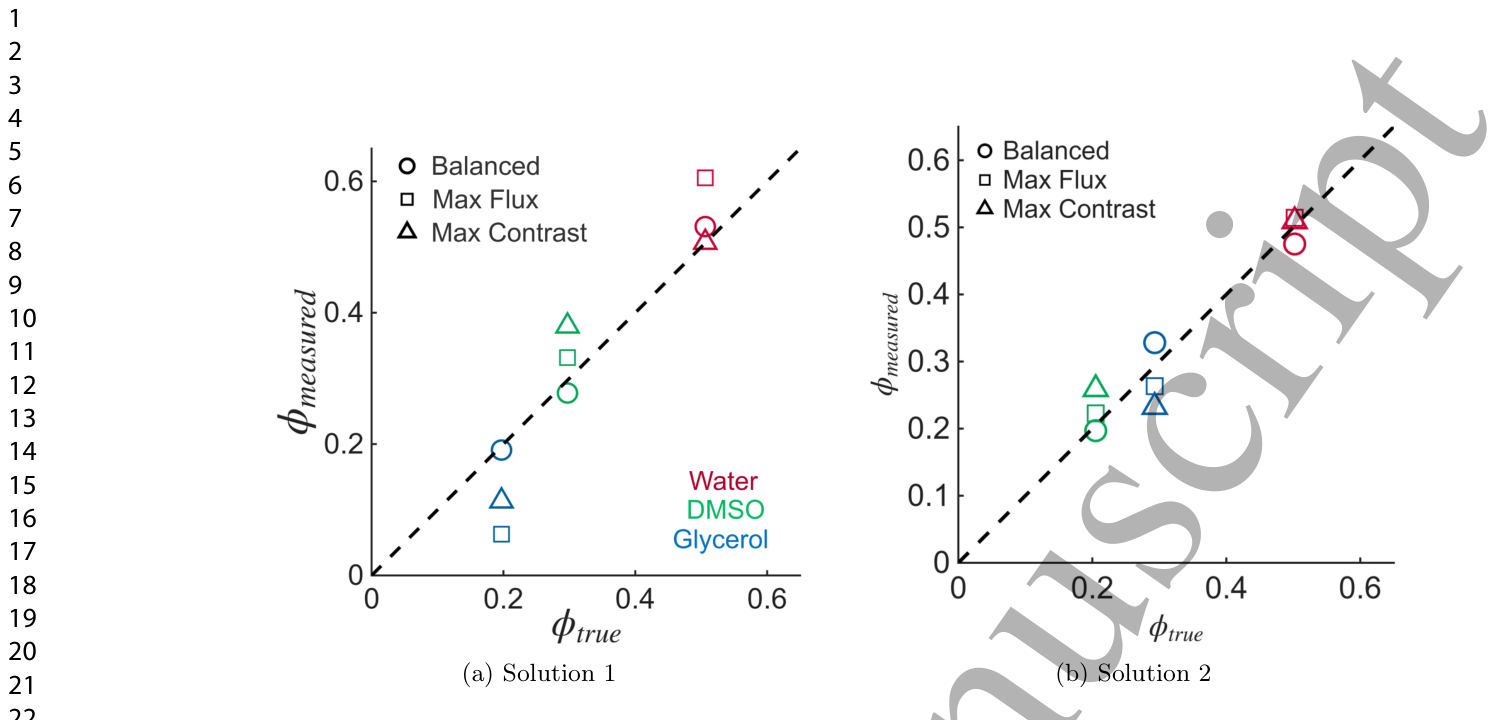
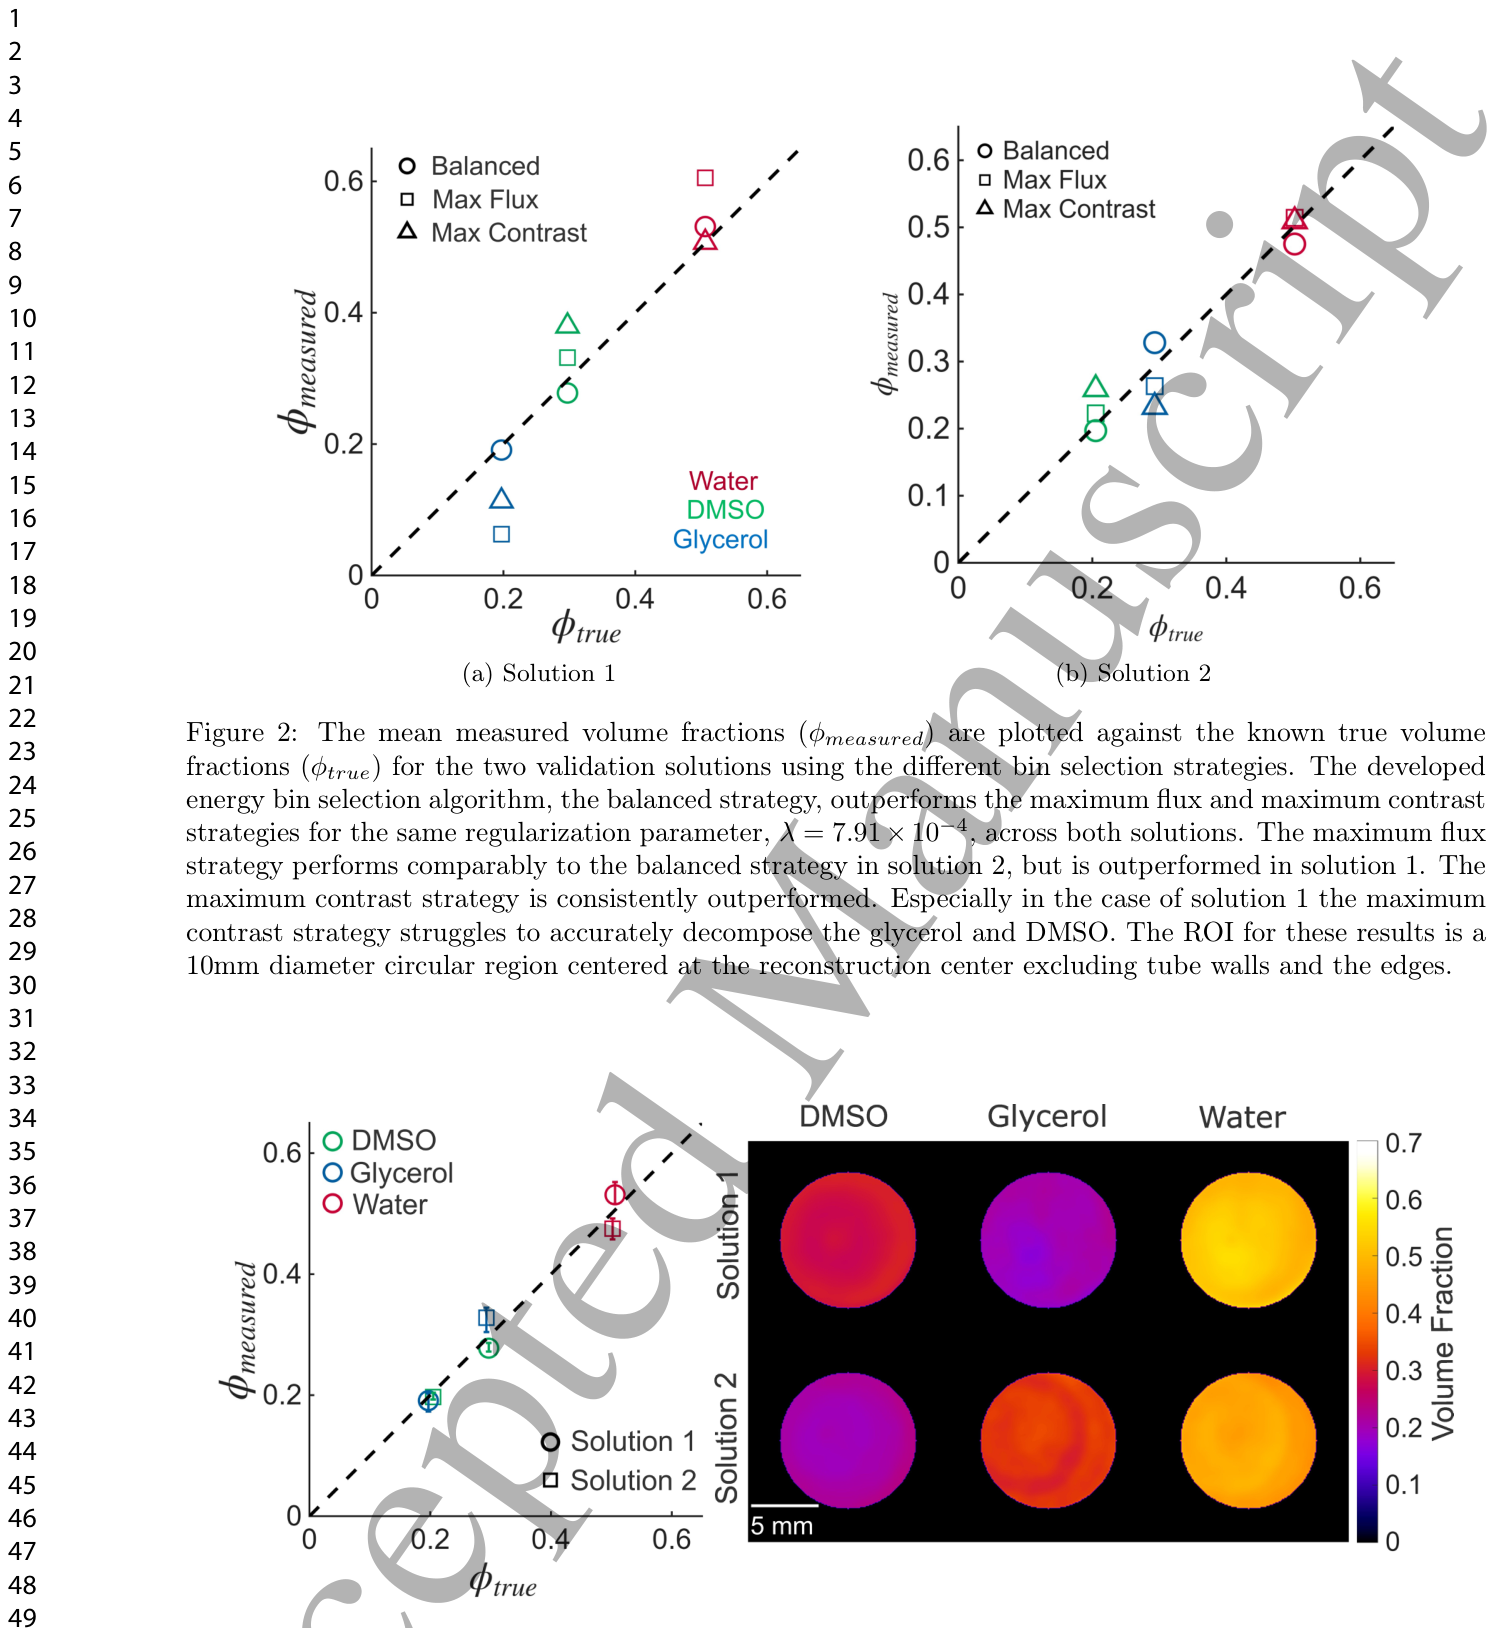
Figure 2. Figure 2: The mean measured volume fractions (ϕmeasured) are plotted against the known true volume fractions (ϕtrue) for the two validation solutions using the different bin selection strategies. The developed energy bin selection algorithm, the balanced strategy, outperforms the maximum flux and maximum contrast strategies for the same regularization parameter, λ = 7.91 × 10⁻⁴, across both solutions. The maximum flux strategy performs comparably to the balanced strategy in solution 2, but is outperformed in solution 1. The maximum contrast strategy is consistently outperformed. Especially in the case of solution 1 the maximum contrast strategy struggles to accurately decompose the glycerol and DMSO. The ROI for these results is a 10mm diameter circular region centered at the reconstruction center excluding tube walls and the edges.解説: 2つの検証ソリューションについて、異なるビン選択戦略を用いた場合の、測定された平均体積分率(ϕmeasured)と既知の真の体積分率(ϕtrue)を比較したグラフです。(a)は溶液1、(b)は溶液2の結果を示しています。開発されたバランス戦略が最大フラックス戦略および最大コントラスト戦略よりも優れた性能を示していることが分かります。
Figure 3. Figure 3: Volume fraction measurements of two well mixed solutions of known composition using the selected balanced energy bins compared to the known, true value. MSCT is able to measure the volume fraction accurately to within 5% error. The error bars show the 5th and 95th percentiles of volume fraction values of each component within the decomposed reconstructions, showing the precision of the decomposition. No significant image artifacts are observed. The ROI is a 10mm diameter circular region centered at the reconstruction center excluding tube walls and the edges.解説: バランス戦略で選択されたエネルギービンを用いて、既知の組成を持つ2つの均一混合溶液について測定された体積分率と真の値との比較、および空間分解断層画像を示しています。MSCTは、5%以内の誤差で体積分率を正確に測定できることが確認されました。分解された再構成画像において、有意なアーチファクトは観察されず、各成分が均一に分布している様子が示されています。
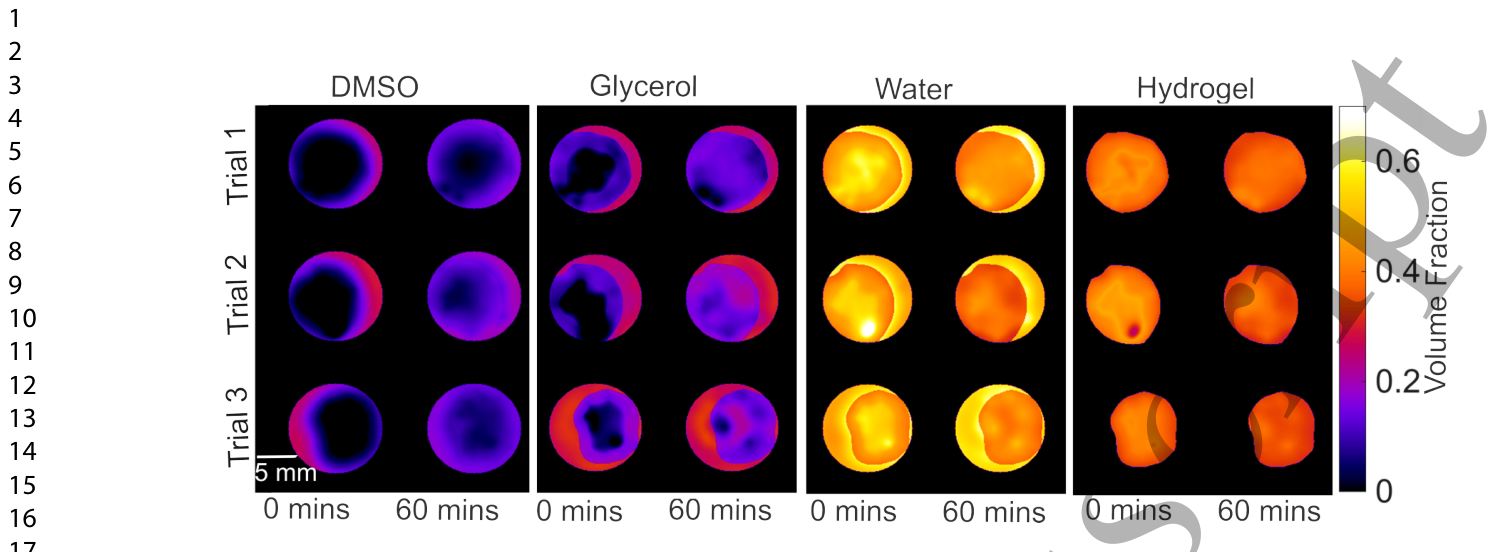
Figure 4. Figure 4: Volume fraction measurements of three hydrogel trials upon insertion (t = 0 min) and after one hour of CPA exposure (60 min). The ROI is a 10 mm diameter circular region centered at the reconstruction center excluding tube walls and the edges. DMSO and glycerol are not observed to diffuse uniformly. Some diffusion is observed over the course of the 15 min of the first scan. Interestingly, glycerol is observed to diffuse more quickly than DMSO in this hydrogel. The volume fraction of water decreases as glycerol and DMSO diffuse into the hydrogel. In total, four independent hydrogel trials were conducted: three to characterize spatial reproducibility at t = 0 and t = 60 min (shown in the current figure) and one to characterize temporal evolution at intermediate time points (figure 5).解説: 凍結保護剤(CPA)溶液に浸漬した直後(0分)と1時間後(60分)の3つのハイドロゲル試験における、各成分(DMSO、グリセロール、水、ハイドロゲル)の体積分率測定値を示しています。グリセロールがDMSOよりも速くハイドロゲルに拡散していることが観察され、DMSOとグリセロールが均一に拡散しないことが示唆されています。
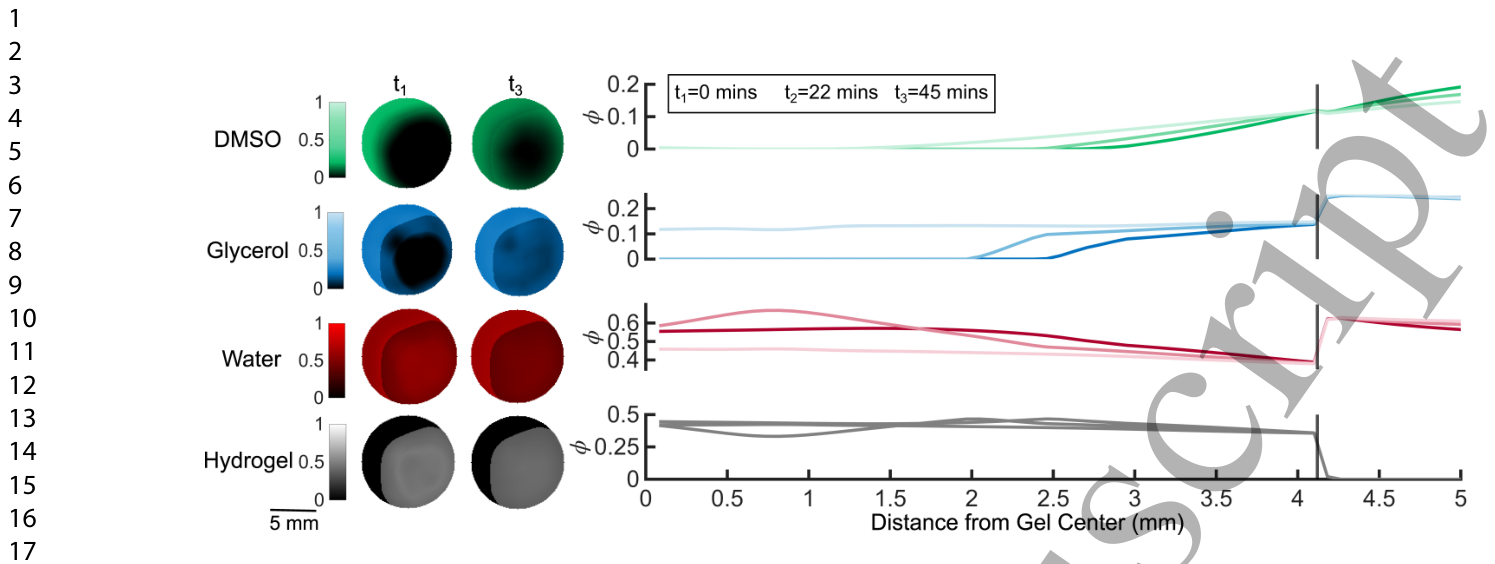
Figure 5. Figure 5: The average radial change in volume fractions inside and outside the gel. DMSO and glycerol are seen to increase within the gel over time whereas the water decreases. Lighter shades are at later times. The gel edge is denoted with a vertical black line. The volume fraction of the hydrogel is measured to be constant, as expected, since the hydrogel is not being transported. The ROI is a 10mm diameter circular region centered at the reconstruction center excluding tube walls and the edges.解説: ゲル内外の体積分率の平均的な半径方向変化を時間経過で示しています。ゲル内部ではDMSOとグリセロールが増加し、水が減少することが観察されます。ハイドロゲルの体積分率は輸送されないため一定に保たれていると測定されています。
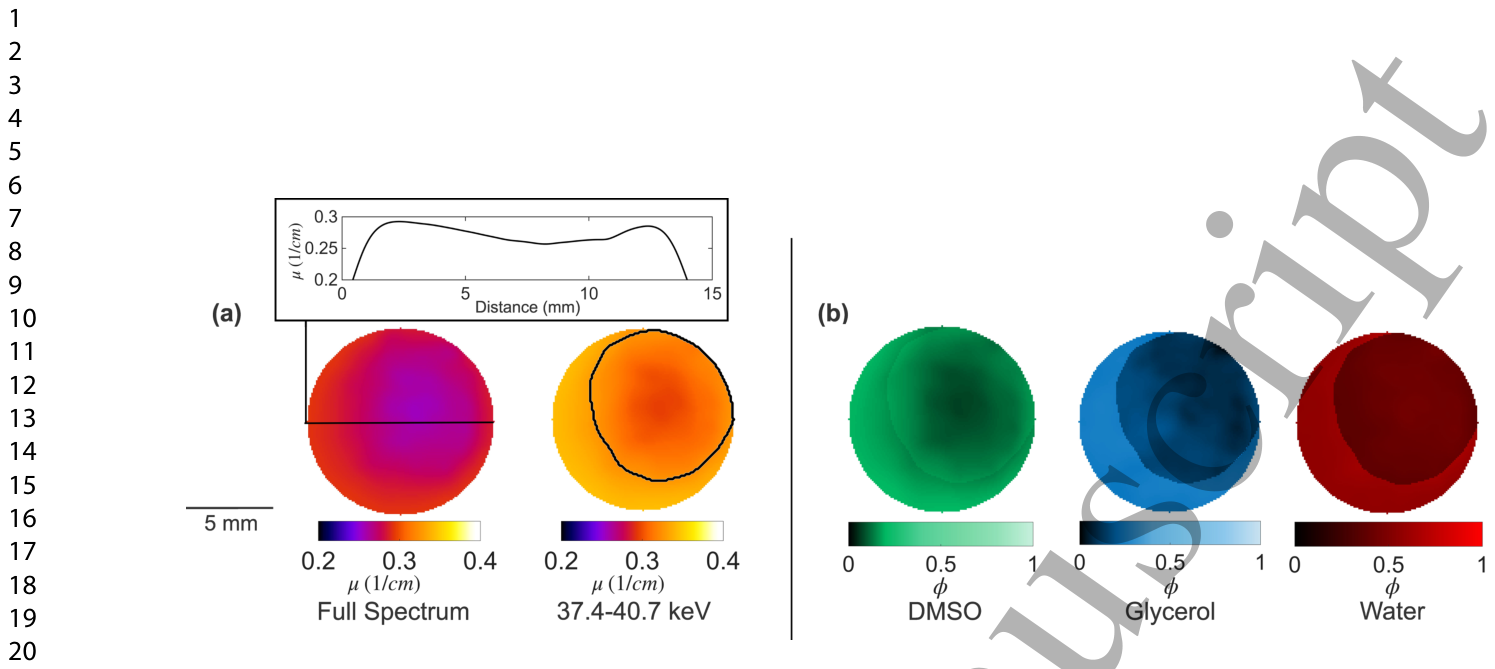
Figure 6. Figure 6: (a) Left: The full spectrum reconstruction of the hydrogel in solution after 90 min. The ROI is a 10 mm diameter circular region centered at the reconstruction center excluding tube walls and the edges. The hydrogel is segmented out based on its 59.4-64.9 keV reconstruction attenuation from the initial scan acquired upon insertion (t = 0 min).解説: (a)は、90分後に溶液中のハイドロゲルを再構成した全スペクトル画像と、37.4~40.7 keVのX線光子エネルギービンを用いた再構成画像を示しています。全スペクトル画像では、ハイドロゲルの内部に向かって画像強度が滑らかに減少しているように見えます。 (b)は、同じハイドロゲルの同じ時点における、分解されたDMSO、グリセロール、水の体積分率の画像を示しており、(a)から示唆されるような成分の滑らかな分布とは異なることが分かります。
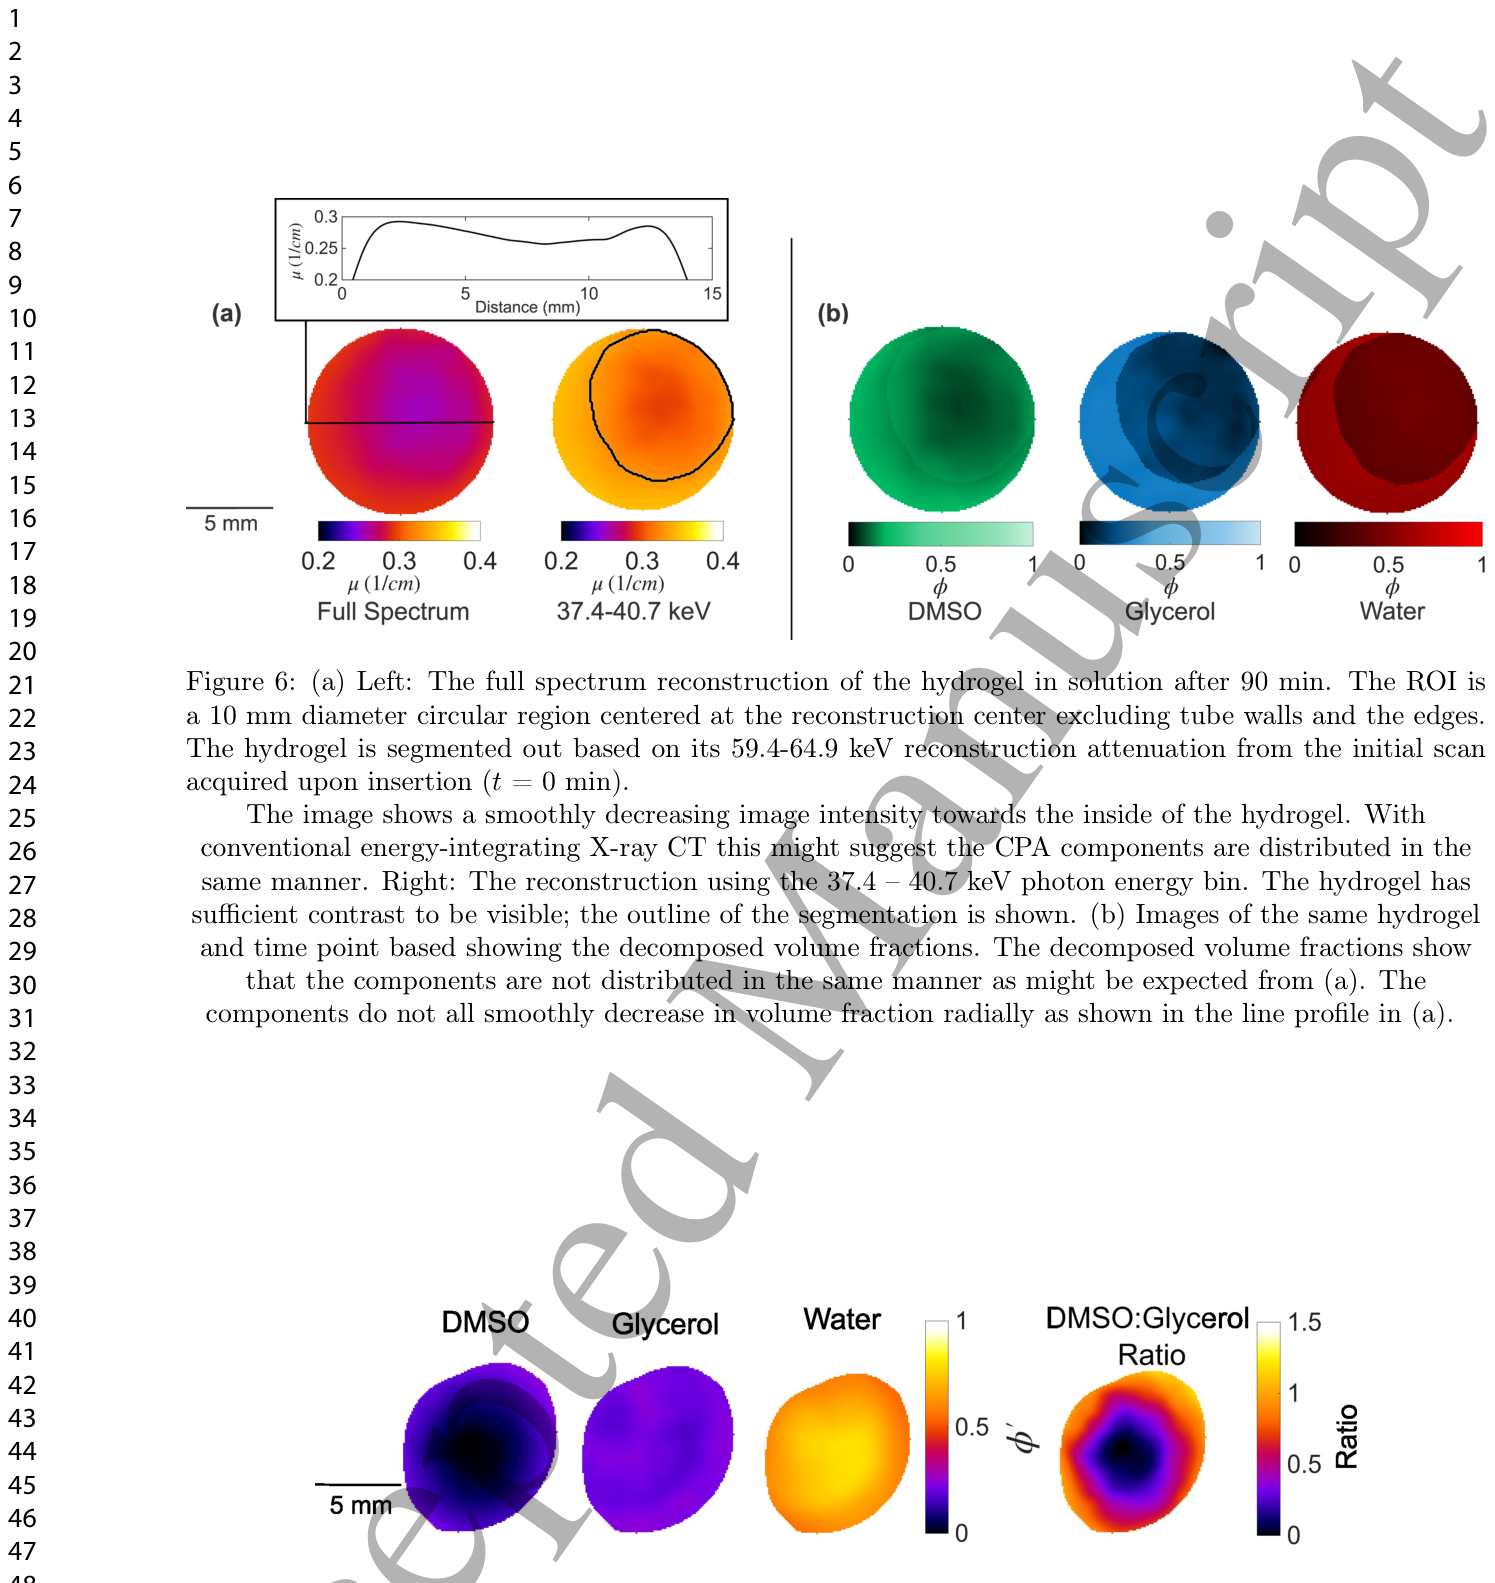
Figure 7. Figure 7: The solutal volume fraction, ϕ′, shown 45 min. after depositing the hydrogel in trial four that was used to plot the radial profiles. The ROI is the segmented hydrogel based on its 59.4-64.9 keV attenuation from the scan acquired upon insertion. The solutes are heterogeneously distributed. On the right, for example, is the ratio of DMSO volume fraction to glycerol volume fraction. Heterogeneous distribution of the solutal volume fractions means the combined solutal mass attenuation coefficient is non-constant.解説: ハイドロゲルを溶液に投入してから45分後の溶質体積分率(ϕ′)を示しています。溶質は不均一に分布しており、右の画像はDMSO体積分率とグリセロール体積分率の比率を示しており、不均一な分布が確認できます。

コメントを残す