どうも、Beyond the Pixelです。X線画像診断の分野では、光子計数型検出器(PCD)の登場により、大きな進化の波が押し寄せています。PCDは、X線光子を個別に検出し、そのエネルギーを測定できるため、従来の検出器では難しかった物質弁別(例えば、ヨウ素などの造影剤と軟部組織や骨を分離すること)を可能にします。これにより、造影剤を用いた血管画像診断において、病変の視認性を飛躍的に向上させる可能性を秘めています。すでに光子計数型CT(Computed Tomography)の臨床応用も進んでおり、この技術の重要性は日増しに高まっています。
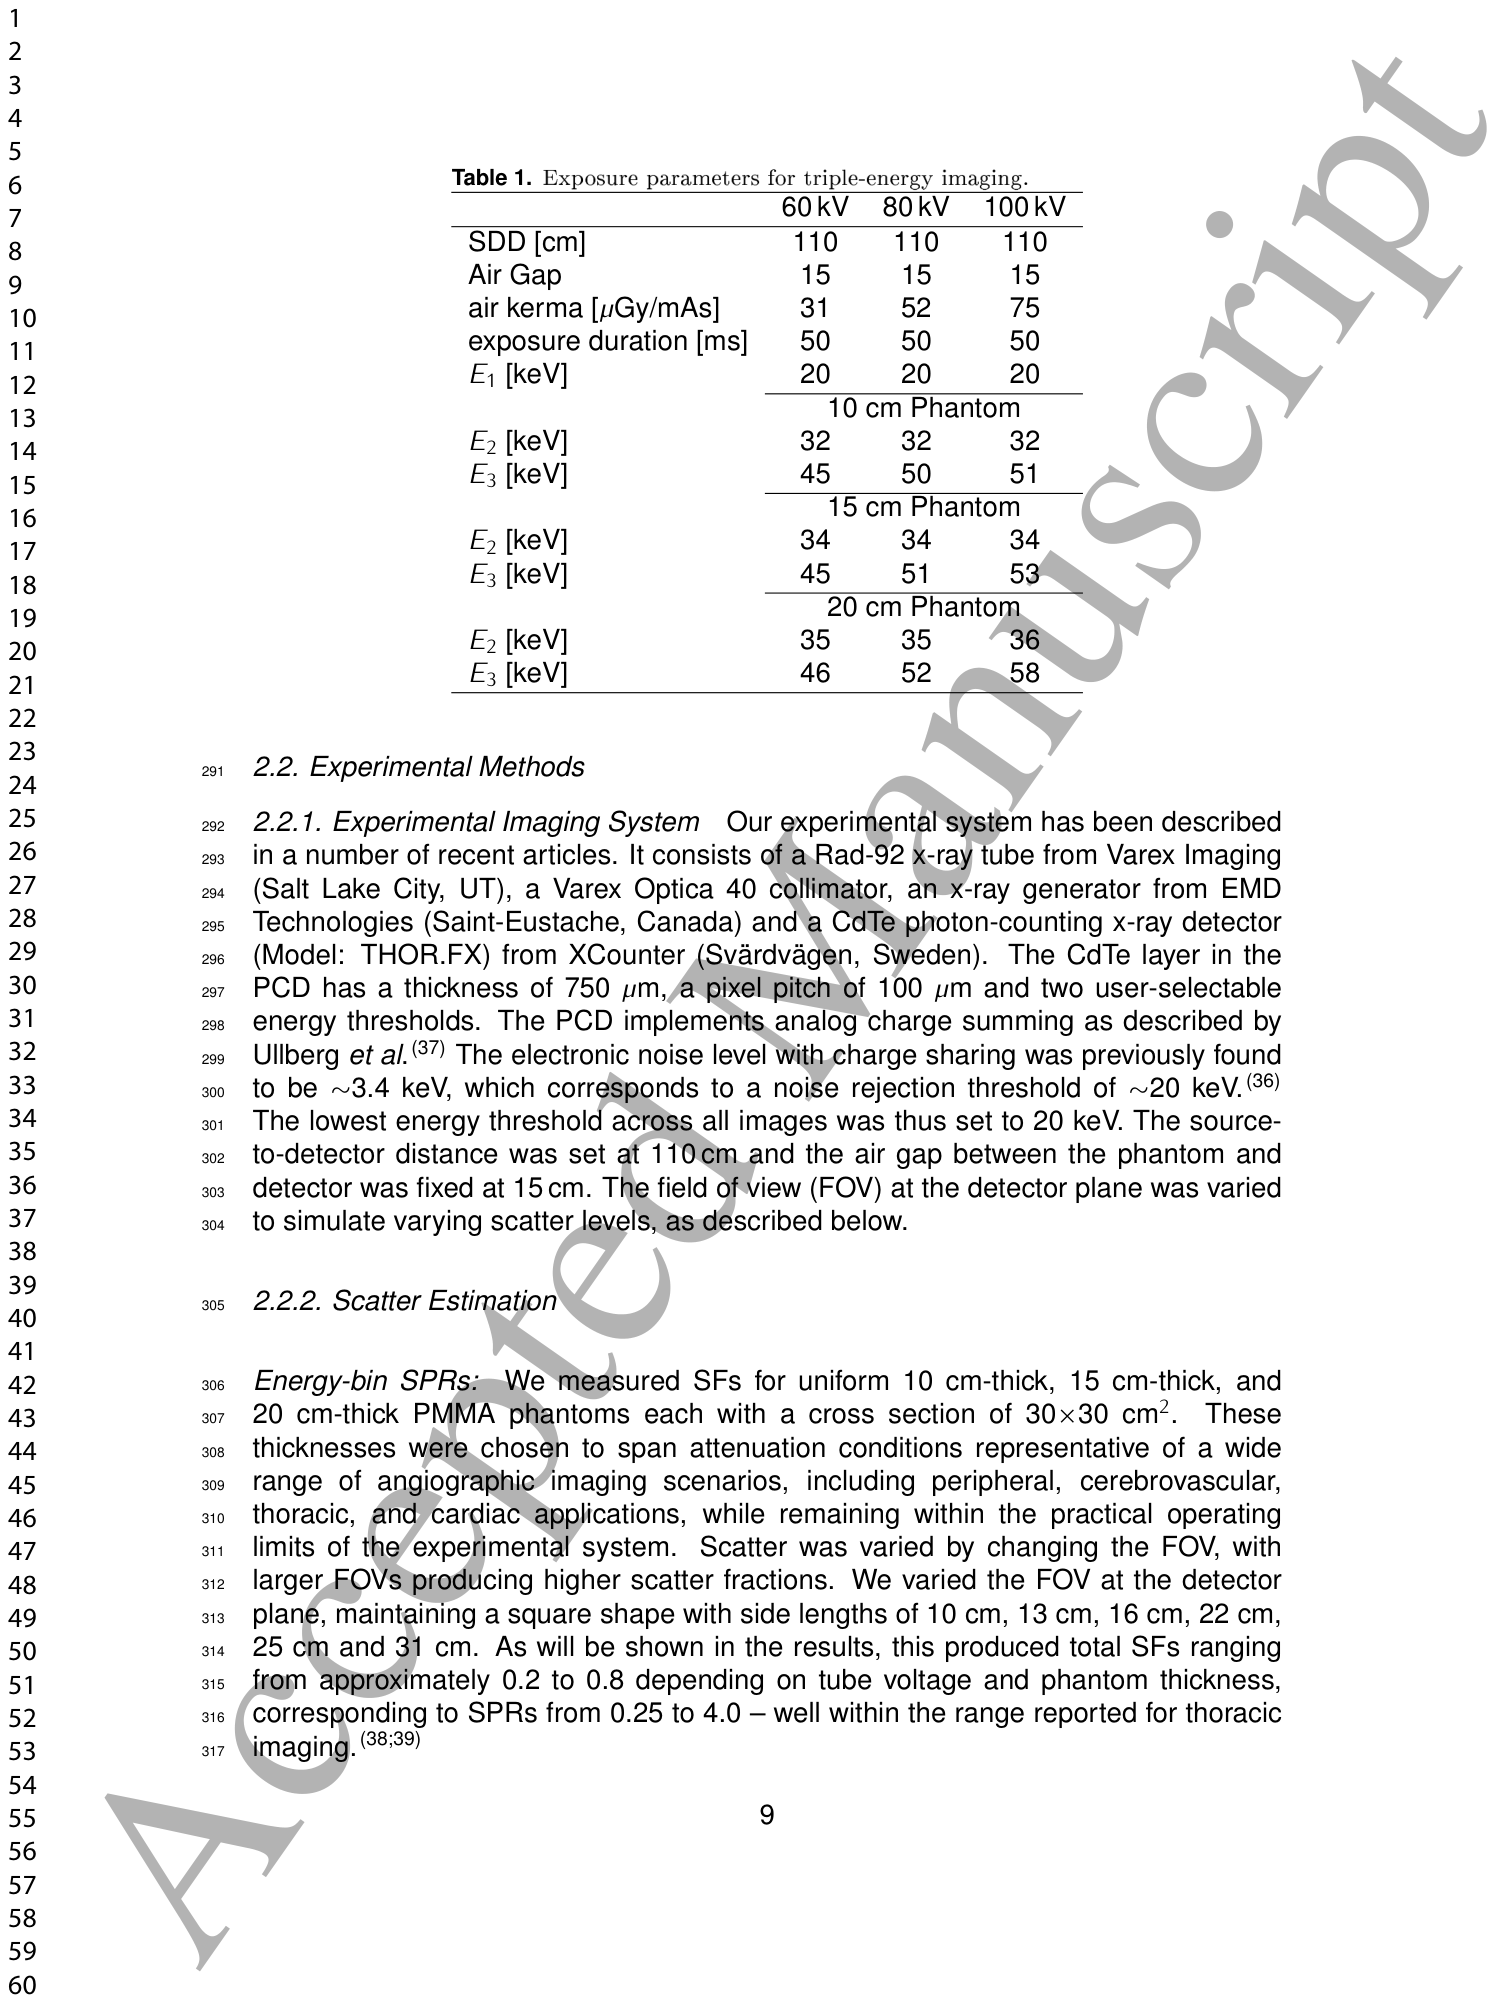
Table 1. Table 1. Exposure parameters for triple-energy imaging.解説: 三重エネルギー撮像の露出条件をまとめた表です。管電圧(60kV、80kV、100kV)ごとのSDD(光源から検出器までの距離)、エアギャップ、空気ケルマ、露出時間、および異なるファントム厚み(10cm、15cm、20cm)における各エネルギービン(E1、E2、E3)の閾値が示されています。
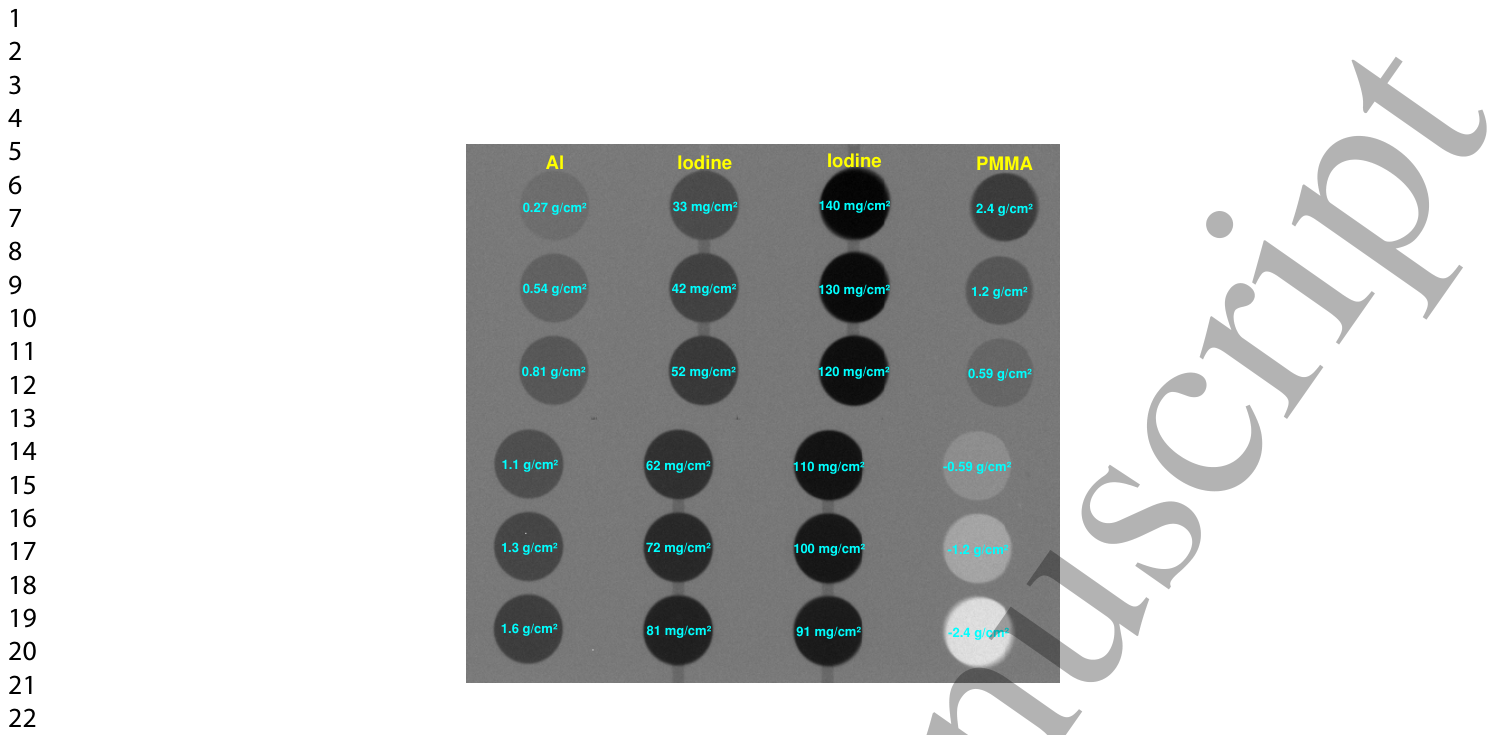
Figure 1. Figure 1. High-dose image of the phantom used for contrast and noise estimation. Left-most column: Al discs. Middle columns: iodine discs. Right-most column: PMMA discs.解説: コントラストとノイズ評価に使用されたファントムの高線量画像です。一番左の列はアルミニウムディスク、中央の列はヨウ素ディスク、一番右の列はPMMA(アクリル樹脂)ディスクを示しており、それぞれ異なる面積密度で構成されています。
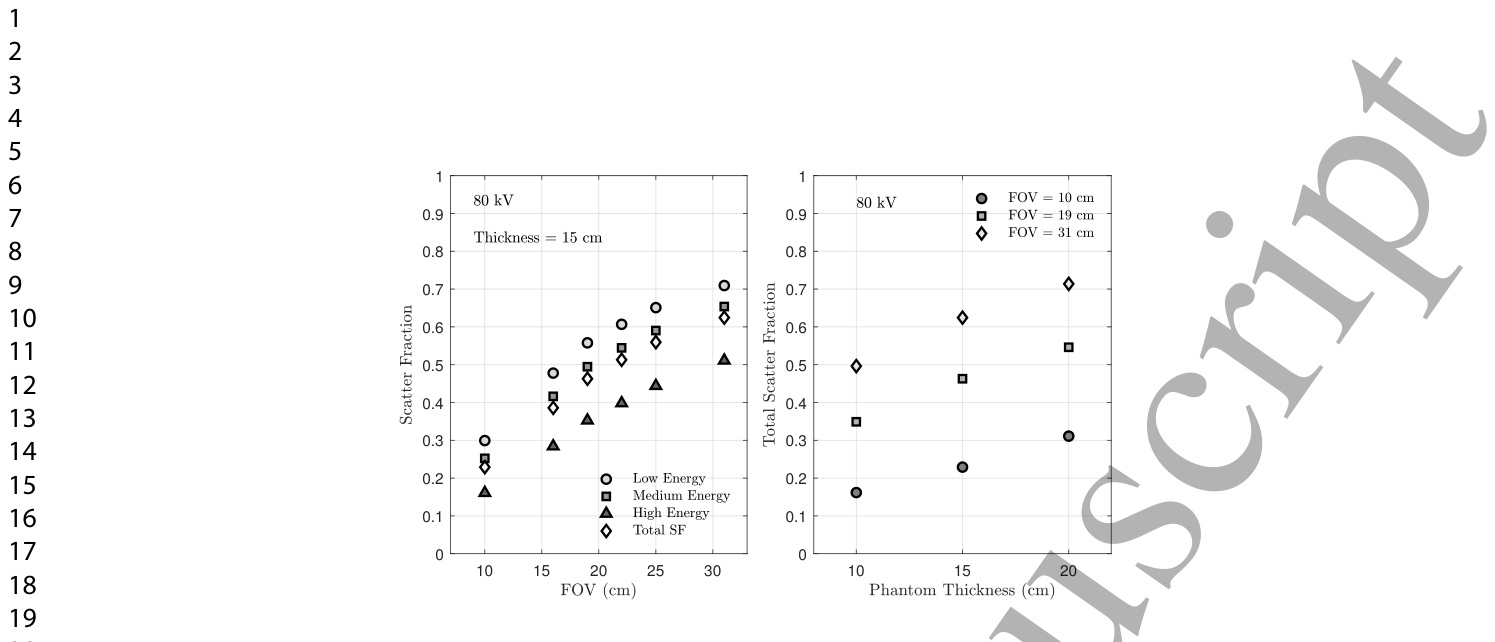
Figure 2. Figure 2. Scatter fraction trends across imaging conditions. (left) Energy-bin and total SF vs FOV (T = 15 cm, 80 kV). (Right) Total SF vs phantom thickness (80 kV, selected FOVs).解説: 様々な撮像条件における散乱線分率の傾向を示しています。左のグラフは、ファントム厚15cm、管電圧80kVの条件で、視野(FOV)のサイズに対する各エネルギービンおよび合計の散乱線分率(SF)の変化を表しています。右のグラフは、管電圧80kVで、ファントム厚に対する合計SFの変化を示しています。
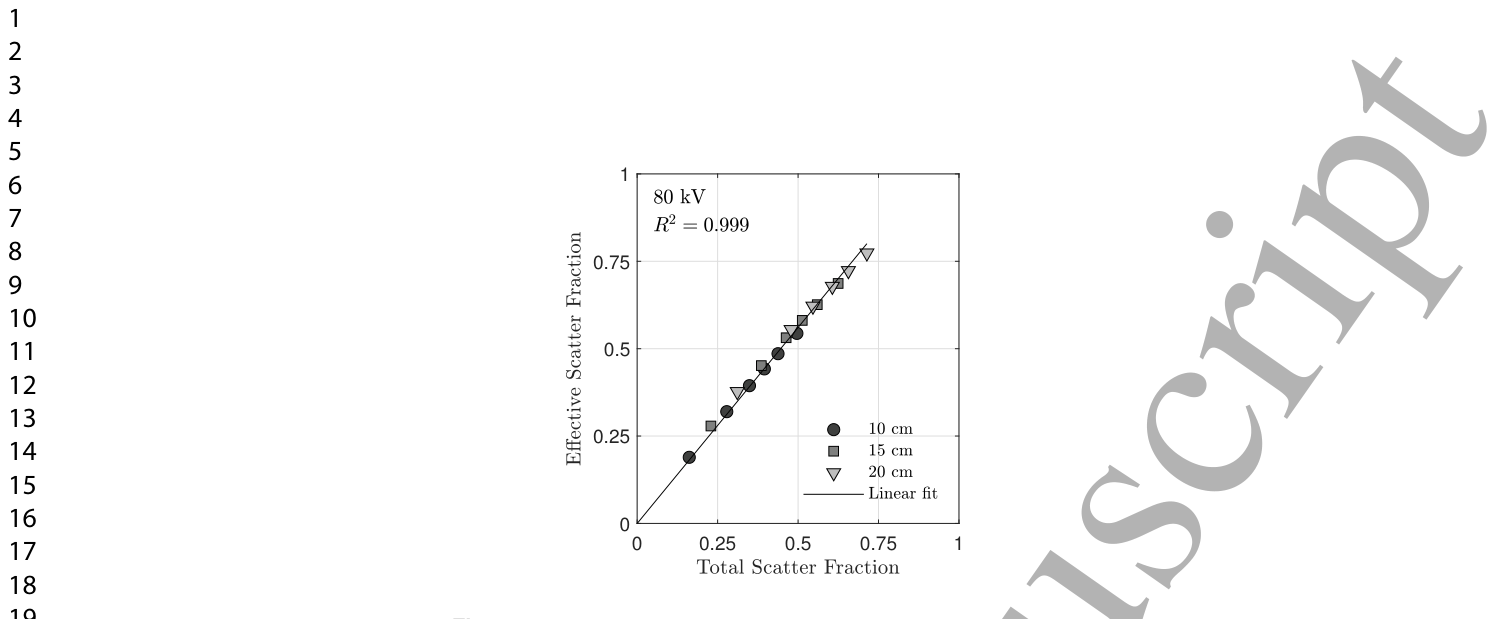
また、散乱線分率と合計散乱線分率の関係はほぼ線形であることが示されました。
Figure 3. Figure 3. Eective scatter fraction SFeff vs total scatter fraction SFtot for 80 kV. SFeff represents the weighted scatter fraction governing rst-order SDNR degradation in triple-energy imaging (Eqs. 21 – 22).解説: 80kVの条件における有効散乱線分率(SFeff)と合計散乱線分率(SFtot)の関係を示しています。SFeffは、三重エネルギー画像における一次SDNR劣化を支配する重み付けされた散乱線分率を意味します。グラフはほぼ線形(R² = 0.999)の関係を示しています。
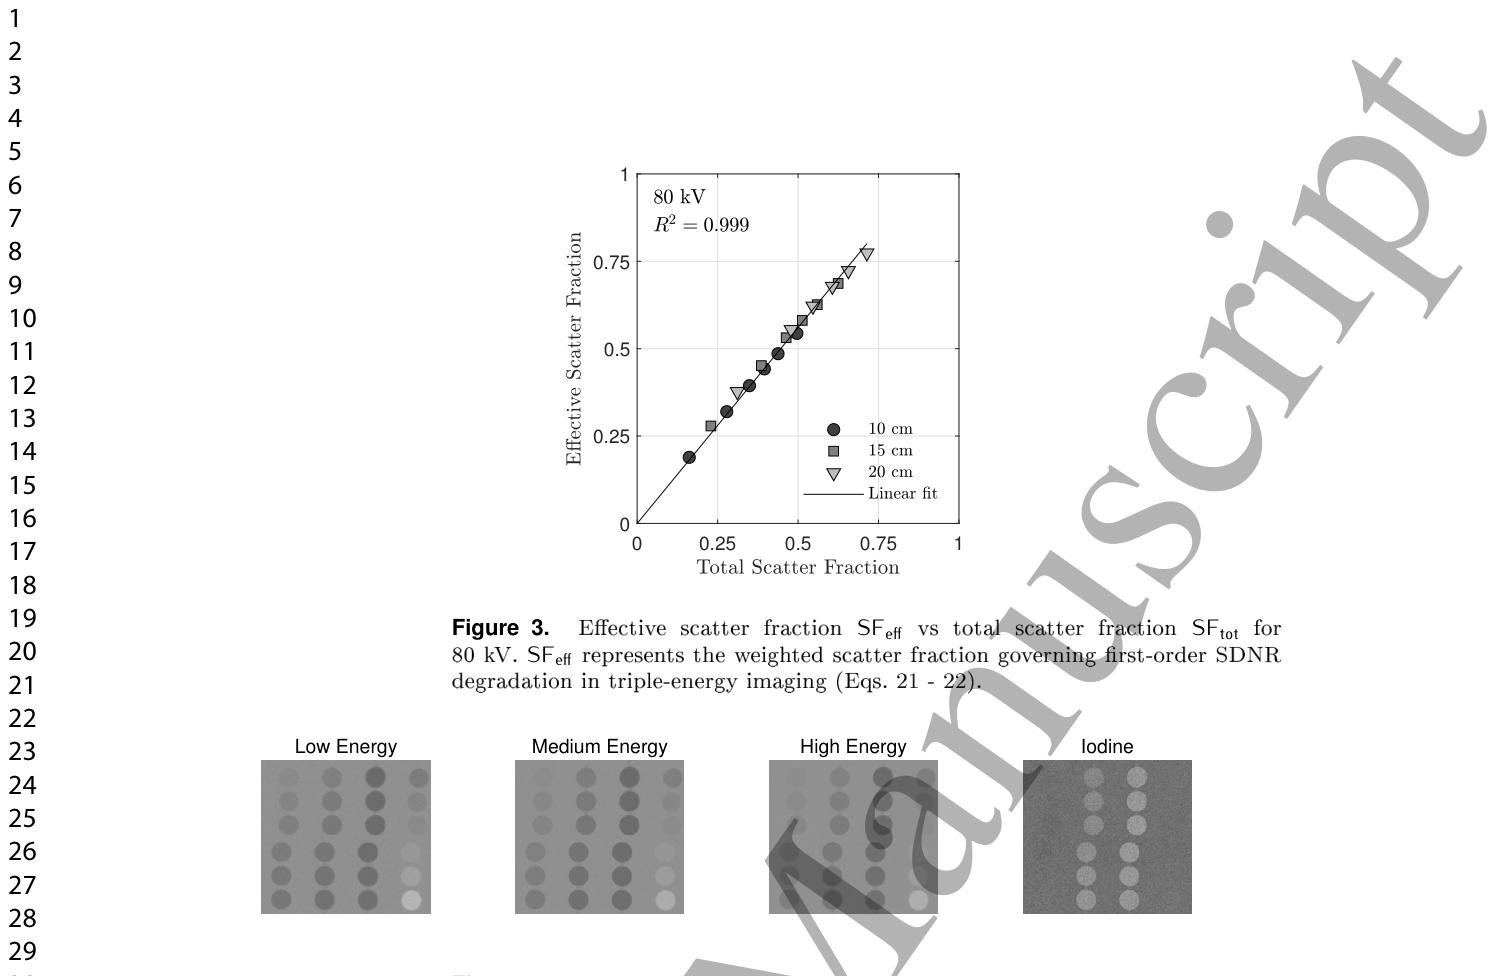
Figure 4. Figure 4. Images from low-, medium-, and high-energy bins and their logarithmic combination to produce an iodine-speci c image. Results are shown for 60 kV, 15 cm thickness, and 19×19 cm2 FOV.解説: 低エネルギー、中エネルギー、高エネルギーの各ビンから取得された画像と、それらを対数的に組み合わせて生成されたヨウ素特異的画像を示しています。管電圧60kV、ファントム厚15cm、FOV19×19cm²の条件での結果です。⚠ 自動抽出画像の検証で一致を確認できませんでした。正確な内容は元論文のFigure 4をご参照ください。
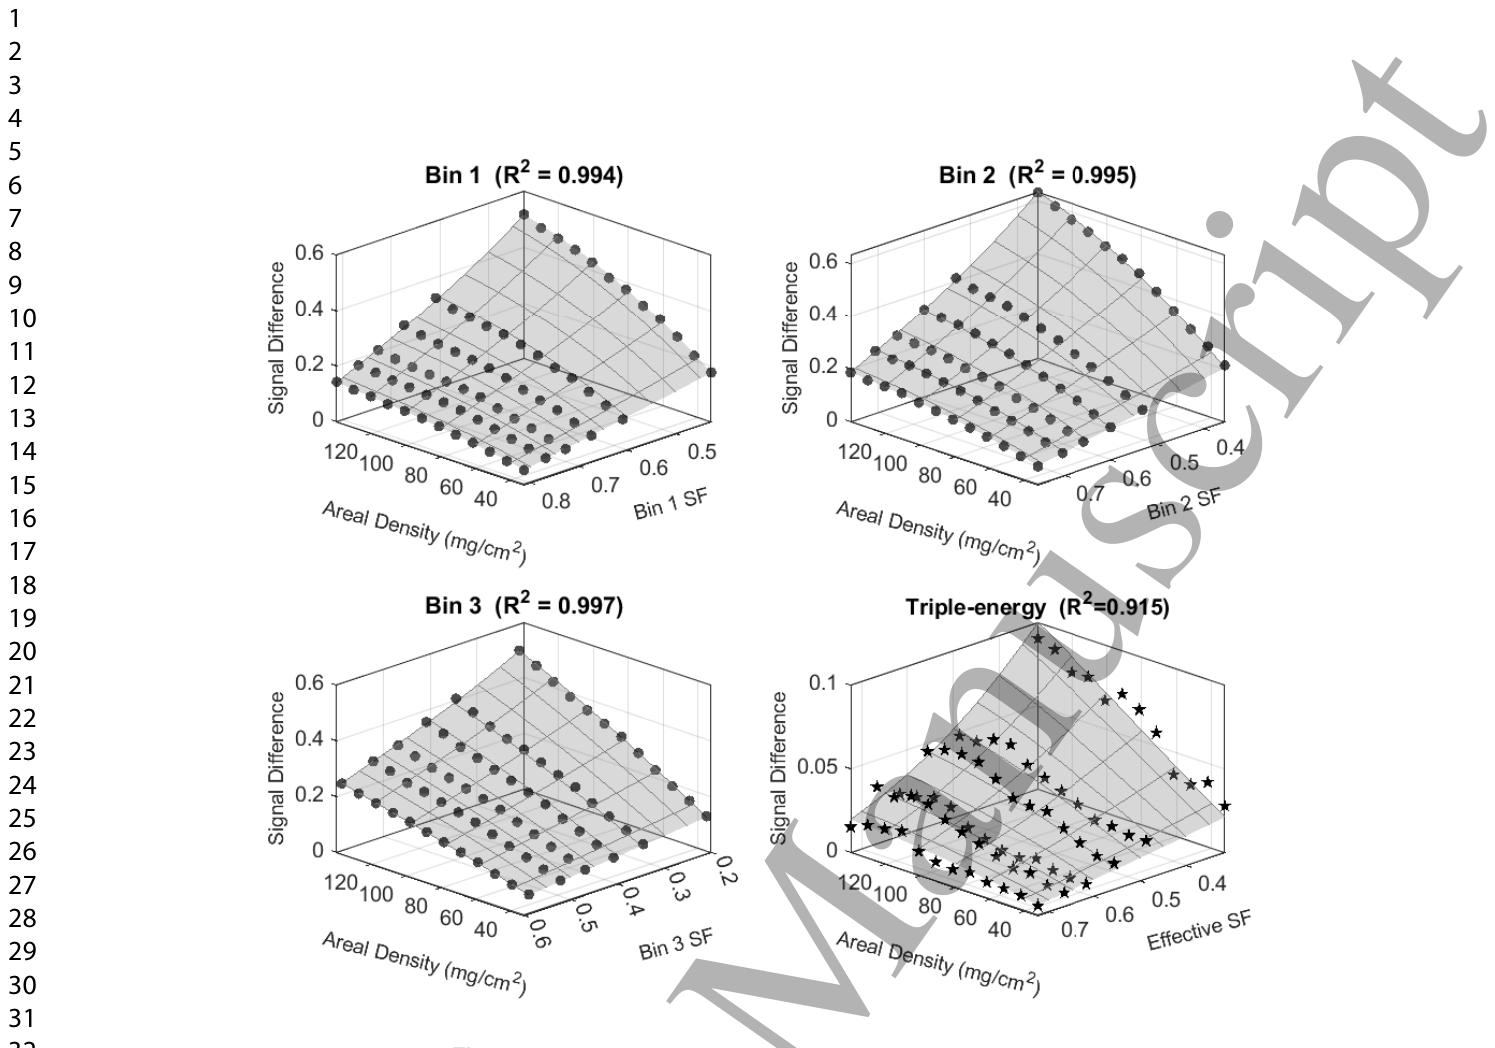
Figure 5. Figure 5. Signal dierences in log-transformed energy bin images and the triple energy images. Data are shown for an 80 kV tube voltage and a phantom thickness of 15 cm. Compression of the triple-energy signal emerges from diering curvature across energy bins, not from any single bin.解説: 対数変換されたエネルギービン画像と三重エネルギー画像における信号差を示しています。データは管電圧80kV、ファントム厚15cmの条件で取得されたものです。グラフは、ヨウ素面積密度と散乱線分率の関数として信号差がどのように変化するかを示しており、三重エネルギー信号の圧縮は個々のビンにおける曲率の違いから生じることを示唆しています。
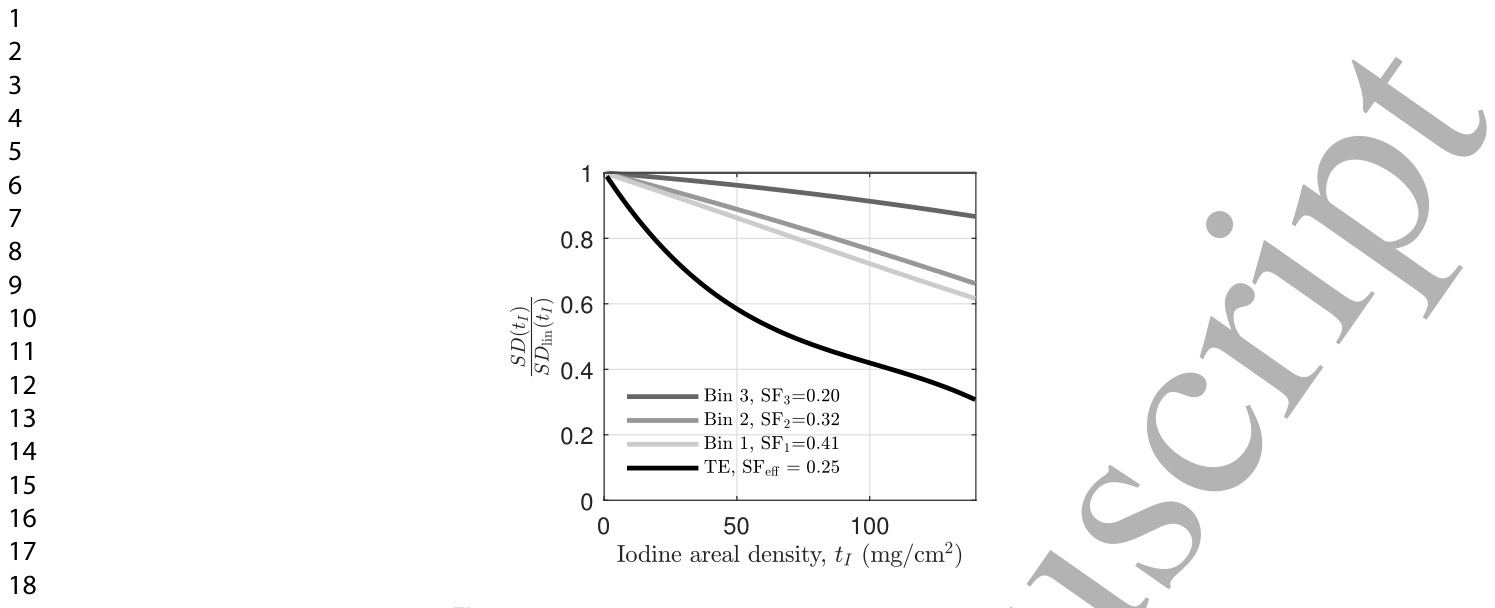
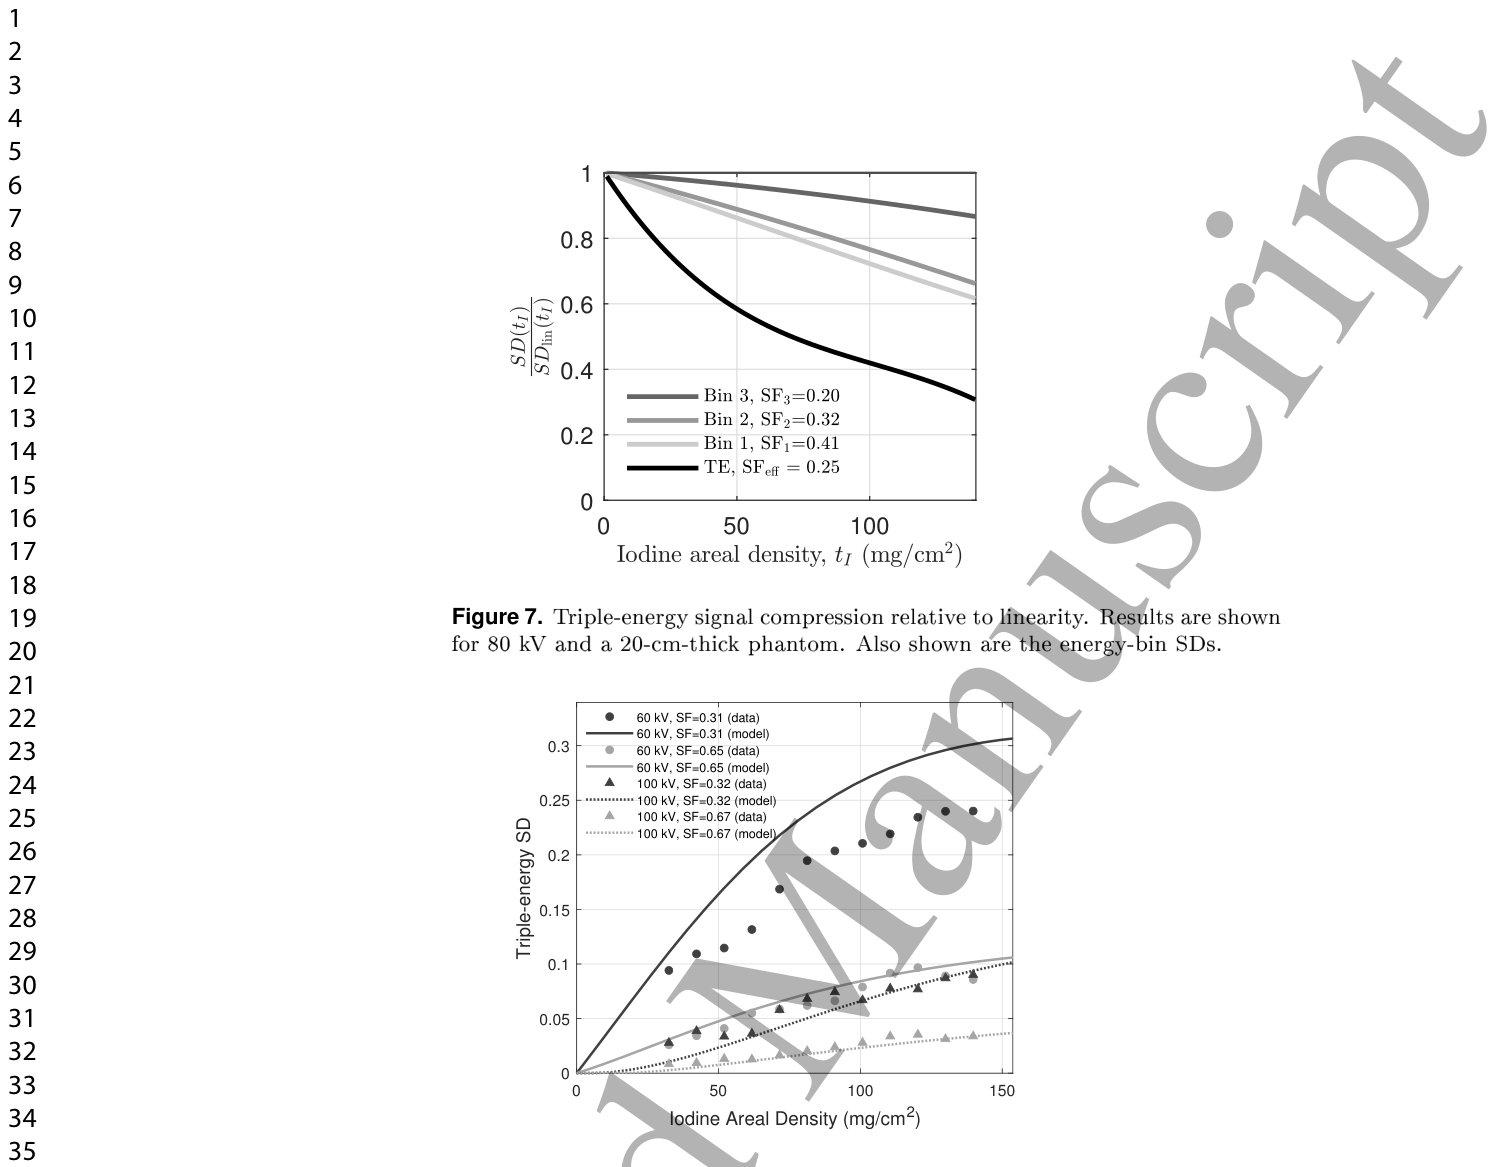
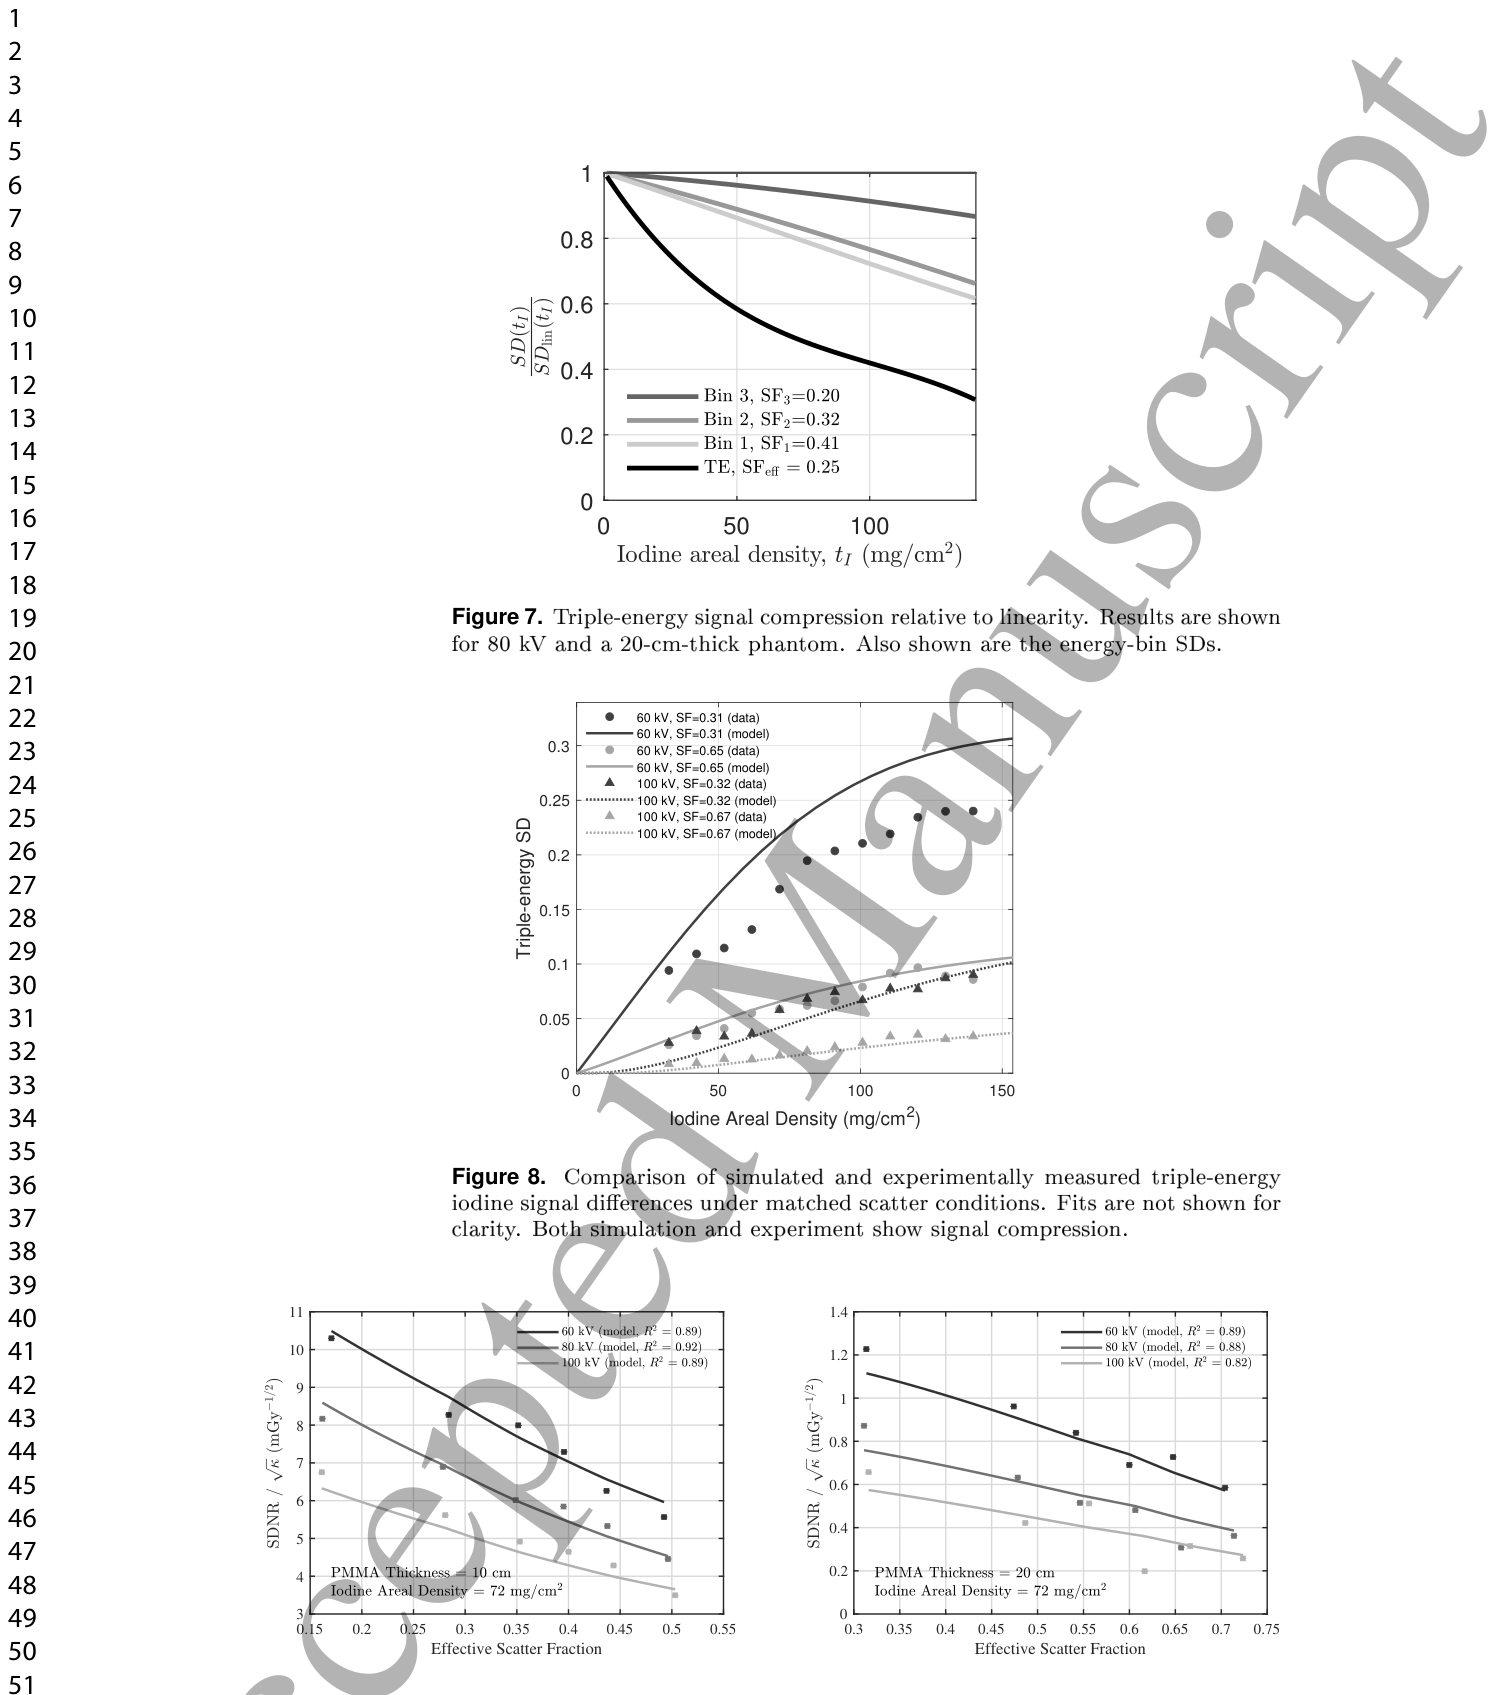
Figure 7. Figure 7. Triple-energy signal compression relative to linearity. Results are shown for 80 kV and a 20-cm-thick phantom. Also shown are the energy-bin SDs.解説: 線形性に対する三重エネルギー信号圧縮の度合いを示しています。管電圧80kV、ファントム厚20cmの条件での結果です。個々のエネルギービン(Bin 1、Bin 2、Bin 3)の信号差(SD)も示されており、三重エネルギー画像の信号圧縮が個々のビンよりもはるかに強いことがわかります。
Figure 8. Figure 8. Comparison of simulated and experimentally measured triple-energy iodine signal dierences under matched scatter conditions. Fits are not shown for clarity. Both simulation and experiment show signal compression.解説: シミュレーションと実験で測定された三重エネルギーヨウ素信号差の比較を示しています。散乱条件を一致させており、シミュレーションと実験の両方で信号圧縮が観察されています。
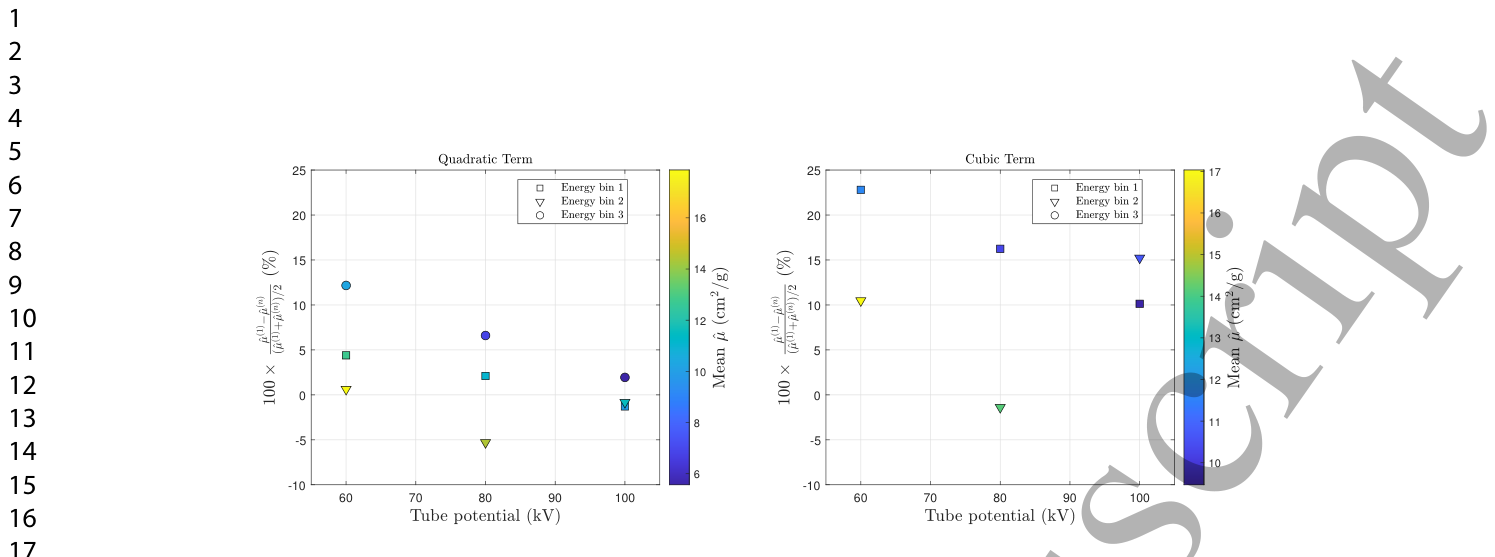
Figure 6. Figure 6. Percent dierence between the linear estimate ˆµ(1) and the higher-order estimates ˆµ(n) for n = 2 and 3. Results are shown for a PMMA thickness of 20 cm. Marker shape denotes energy bin and marker color encodes the mean attenuation(ˆµ(1) + ˆµ(n))/2 (cm2/g).解説: 線形推定値ˆµ(1)と、2次(n=2)および3次(n=3)の高次推定値ˆµ(n)との間のパーセント差を示しています。結果はPMMA厚20cmの条件で示されており、マーカーの形状はエネルギービンを、マーカーの色は平均減衰量(ˆµ(1) + ˆµ(n))/2 (cm²/g)を表しています。
Figure 9. Figure 9. Kerma-normalized SDNR as a function of eective scatter fraction. Lines correspond to pro les through the tted 2D surface across the areal-density × scatter-fraction domain. Only a subset of areal-densities is shown.解説: 有効散乱線分率の関数としてのケルマ正規化SDNRを示しています。線は、面積密度と散乱線分率の領域全体にわたる当てはめられた2D表面からのプロファイルに対応しています。⚠ 自動抽出画像の検証で一致を確認できませんでした。正確な内容は元論文のFigure 9をご参照ください。
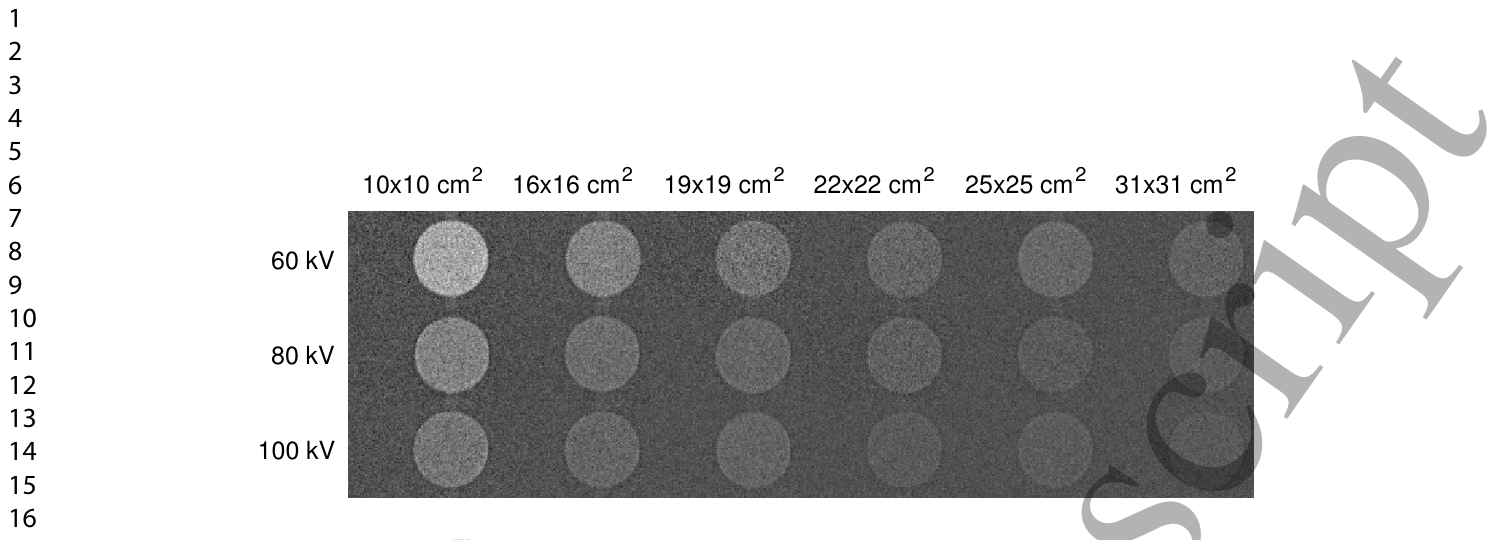
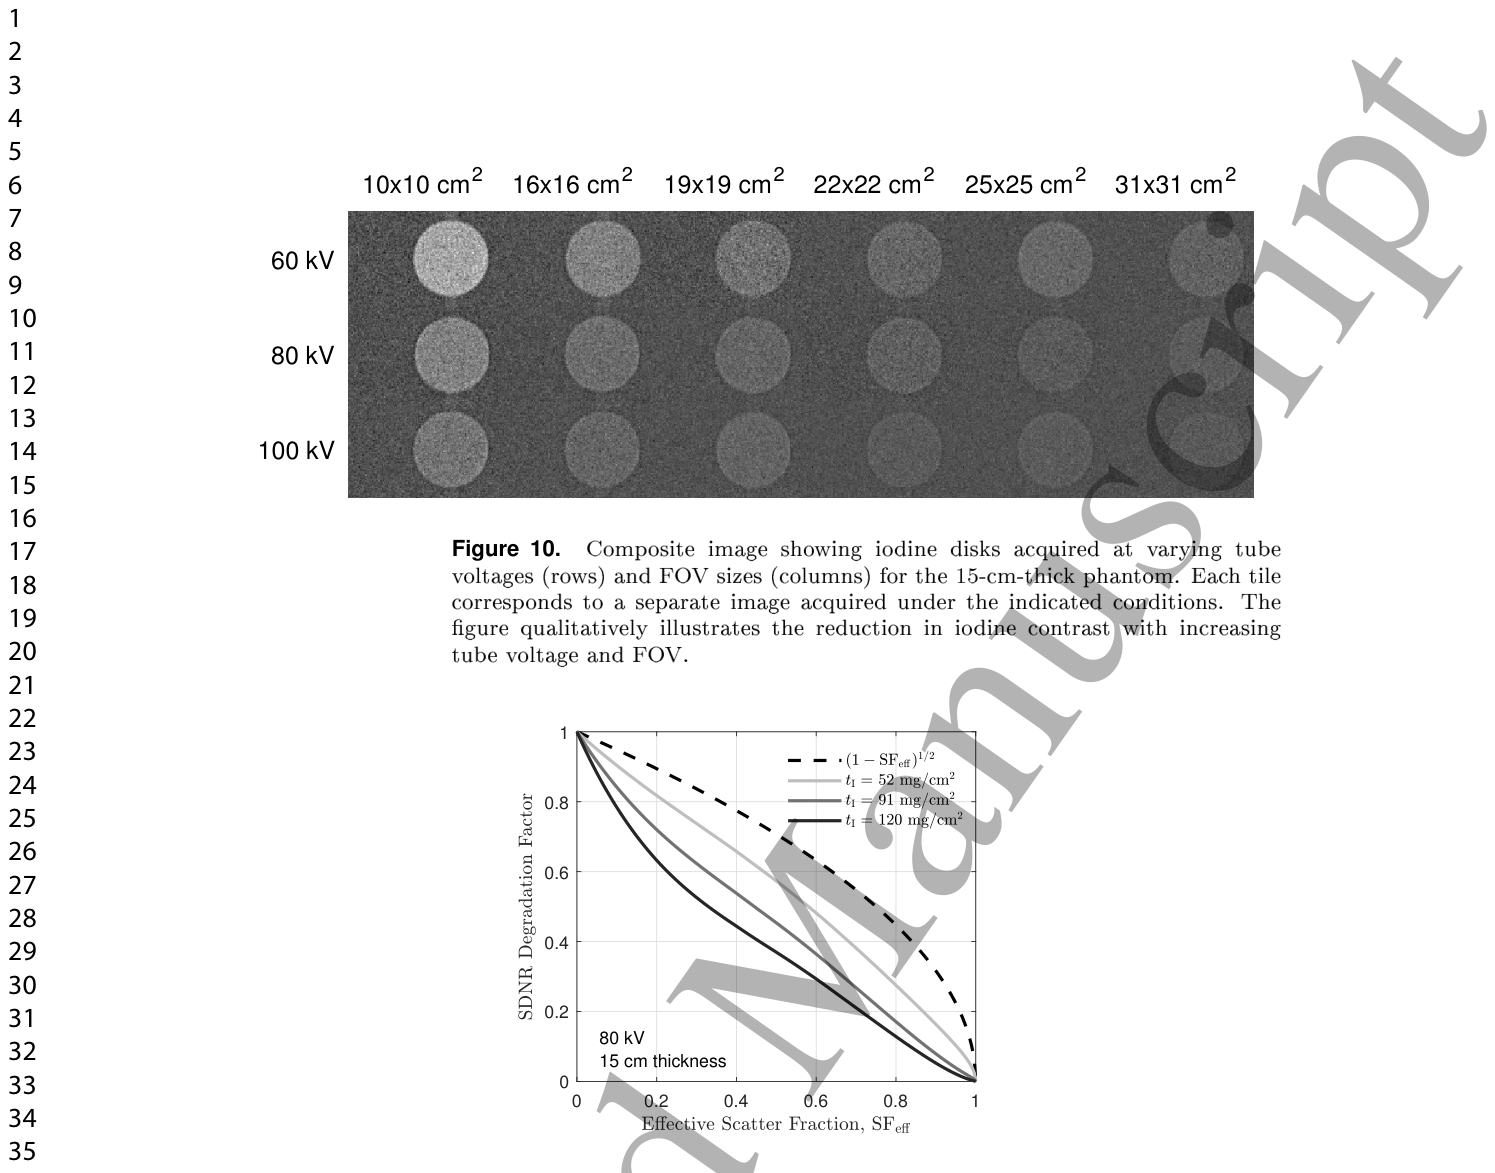
Figure 10. Figure 10. Composite image showing iodine disks acquired at varying tube voltages (rows) and FOV sizes (columns) for the 15-cm-thick phantom. Each tile corresponds to a separate image acquired under the indicated conditions. The gure qualitatively illustrates the reduction in iodine contrast with increasing tube voltage and FOV.解説: 15cm厚のファントムに対して、様々な管電圧(行)と視野(FOV)サイズ(列)で取得されたヨウ素ディスクの複合画像です。各タイルは、指定された条件下で取得された個別の画像に対応しており、管電圧およびFOVの増加に伴うヨウ素コントラストの低下を視覚的に示しています。
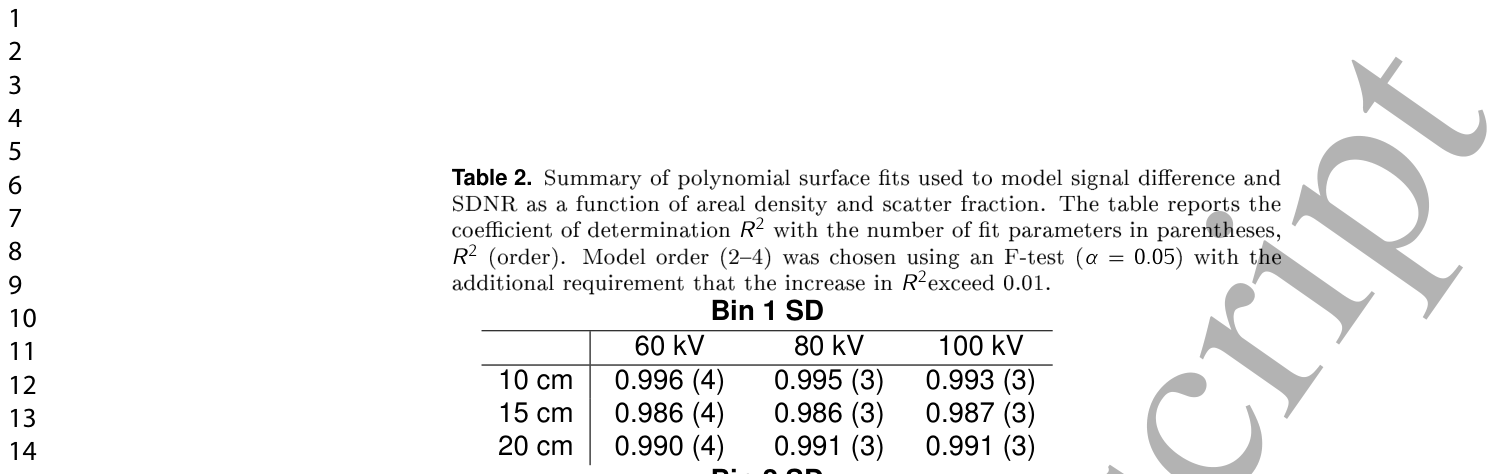
Table 2. Table 2. Summary of polynomial surface ts used to model signal dierence and SDNR as a function of areal density and scatter fraction. The table reports the coe cient of determination R2 with the number of t parameters in parentheses, R2 (order). Model order (24) was chosen using an F-test (α = 0.05) with the additional requirement that the increase in R2exceed 0.01.解説: 面積密度と散乱線分率の関数として、信号差とSDNRをモデル化するために使用された多項式曲面近似の要約表です。決定係数R²(モデルの次数)が示されており、モデルの次数はF検定(α=0.05)とR²の増加が0.01を超えるという追加要件に基づいて選択されました。
Figure 11. Figure 11. SDNR degradation factor as a function of eective scatter fraction, highlighting nonlinear behavior and the dependence of scatter degradation on areal density.

コメントを残す