どうも、Beyond the Pixelです。急性虚血性脳卒中における血管再開通の進歩にもかかわらず、治療後の臨床転帰は多様であり、大動脈の再開通以外の要因が脳組織の運命を決定する上で重要です。虚血性ペナンブラ(虚血に陥っているが、まだ壊死していない領域)に血液を供給する動脈側側副血行路は、梗塞の進行を左右する重要な修飾因子として伝統的に評価されてきました。しかし、動脈流入だけでは組織レベルの灌流を完全に把握することはできません。静脈ドレナージ(静脈からの血液排出)は、微小血管機能の補完的かつ統合的なマーカーとなります。静脈の造影は、虚血性微小循環をうまく通過した血液を反映するため、動脈流入、毛細血管灌流、微小血管の完全性の複合的な効果を取り込み、効果的な組織灌流の下流側の指標となります。この概念に基づき、皮質静脈造影スコア(COVES)や包括的静脈流出スコア(CVO)といった目視による静脈流出量評価システムが開発されてきました。これらのスコアは、梗塞の進行、再灌流の成功、血栓除去術後の臨床転帰との関連が示されています。しかし、目視によるスコアリングは主観性、序数評価(段階的な評価)、評価者間ばらつきといった課題があり、自動解析への適用が困難でした。これまでに、造影CTデータに基づく減弱値測定や灌流画像由来の静脈指標など、定量的アプローチが提案されていますが、これらは高度な撮像プロトコルや複雑な後処理を必要とすることが多く、日常診療で広く用いられる単相CTアンギオグラフィー(CTA)には直接適用できませんでした。この研究では、急性虚血性脳卒中におけるルーチンの単相CTAから、脳静脈流出量を定量的に評価するための半自動かつ評価者非依存的な手法の開発と検証を目指しています。
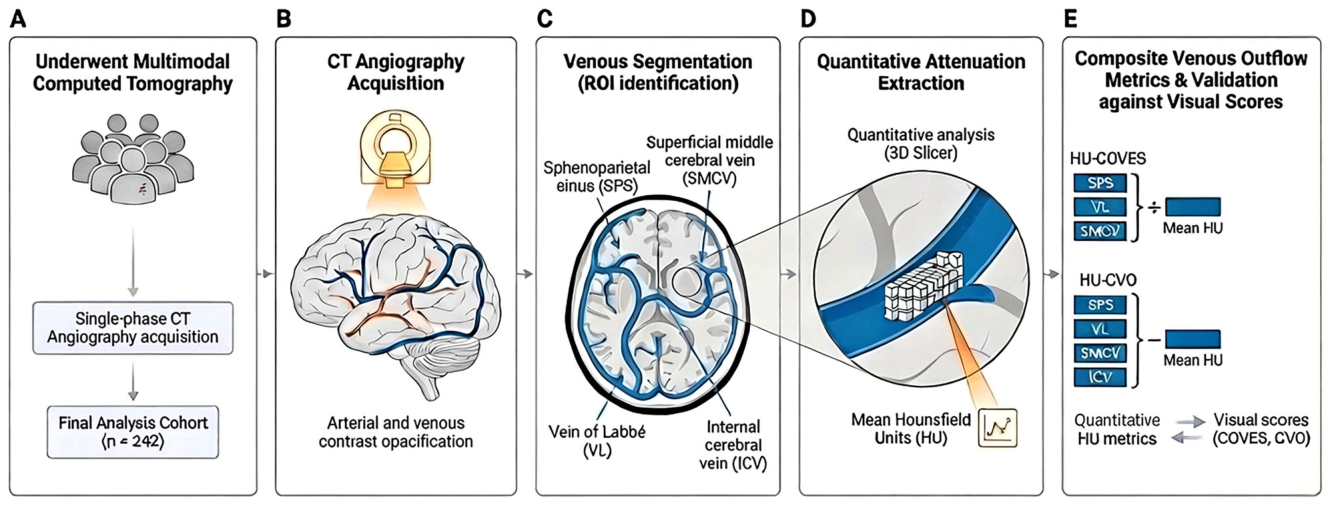
Figure 1. Fig. 1 Workflow for quantitative venous outflow analysis on CT angiography. The workflow overview illustrates the development of quantitative venous outflow metrics from CT angiography in patients with acute ischemic stroke due to large-vessel occlusion (AIS-LVO). A Following CT angiography acquisition (B), venous structures are identified and regions of interest are outlined along the course of the sphenoparietal sinus (SPS), superficial middle cerebral vein (SMCV), vein of Labbé (VL), and Internal cerebral veins (ICVs); C Quantitative venous attenuation is subsequently extracted from the segmented venous voxels as mean Hounsfield units (HU); D Composite quantitative venous outflow metrics are then calculated by averaging attenuation values across cortical veins (HU-COVES: SPS, VL, SMCV) or across cortical and deep venous structures (HU-CVO: SPS, VL, SMCV, ICV); E These quantitative metrics are subsequently compared with established visual venous outflow scores (COVES and CVO) to evaluate the relationship between automated attenuation-based measurements and conventional qualitative grading of venous outflow (E).解説: 本図は、急性虚血性脳卒中対象者のCTアンギオグラフィー(CTA)データから定量的静脈流出量指標を開発するワークフローを示しています。CTA画像取得後、蝶形頭頂洞(SPS)、浅い中大脳静脈(SMCV)、ラベ静脈(VL)、内頚静脈(ICV)などの静脈構造を特定し、関心領域を輪郭で示します。その後、セグメンテーションされた静脈のボクセルから平均Hounsfield単位(HU)として定量的な静脈減弱値を抽出し、皮質静脈(SPS, VL, SMCV)の平均減弱値(HU-COVES)や、皮質静脈と深部静脈(SPS, VL, SMCV, ICV)の平均減弱値(HU-CVO)として複合的な定量的静脈流出量指標を計算し、確立された目視スコア(COVESおよびCVO)と比較して評価します。
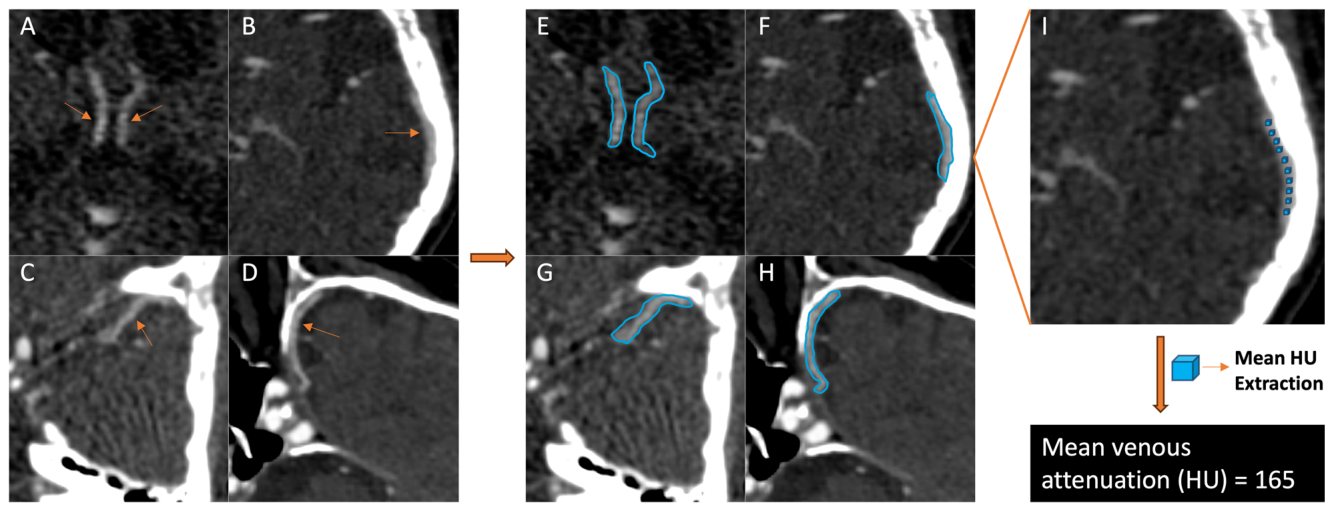
Figure 2. Fig. 2 Patient-level illustration of segmental venous assessment and quantitative attenuation extraction. Representative CT angiography (CTA) example demonstrating venous identification, segmentation, and quantitative attenuation extraction. Axial and angulated CTA images illustrating the anatomical location of the analyzed venous structures, including the internal cerebral veins (ICVs, A), vein of Labbé (VL, B), superficial middle cerebral vein (SMCV, C), and sphenoparietal sinus (SPS, D). E–H demonstrates the placement of venous regions of interest along the course of the corresponding veins, illustrated as centerline overlays within the venous lumen. I exemplifies quantitative attenuation sampling within a cortical vein, demonstrating voxel-based extraction of intraluminal Hounsfield unit (HU) values used to calculate mean venous attenuation for subsequent segmental and composite quantitative analysis解説: 本図は、個々の対象者における静脈セグメント評価と定量的な減弱値抽出の具体例を示しています。A~Dは内頚静脈(ICVs)、ラベ静脈(VL)、浅い中大脳静脈(SMCV)、蝶形頭頂洞(SPS)の解剖学的位置を示す軸位および傾斜CTA画像です。E~Hは、対応する静脈内腔に沿って中心線のオーバーレイとして示された静脈の関心領域の配置を示しています。Iは、皮質静脈内での定量的な減弱値サンプリングを例示しており、その後のセグメント別および複合的な定量分析に使用される、管腔内Hounsfield単位(HU)値のボクセルベースの抽出を示しています。
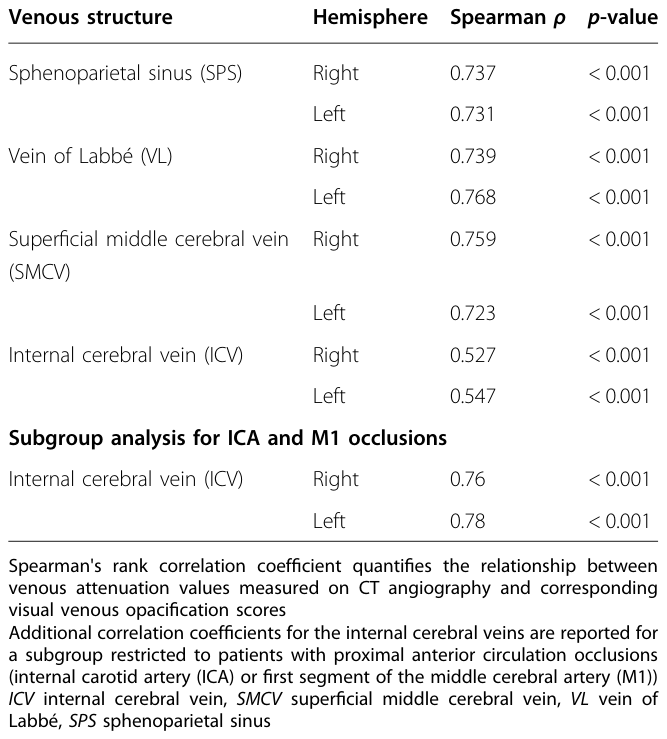
Table 2. Table 2 Segment-level correlation between quantitative venous attenuation and visual venous scores解説: 本表は、CTアンギオグラフィーで測定された定量的な静脈減弱値と、対応する目視による静脈造影スコアとのセグメントレベルでのスピアマン相関係数(ρ)を示しています。皮質静脈(蝶形頭頂洞、ラベ静脈、浅い中大脳静脈)では0.723~0.768と強い相関を示しましたが、内頚静脈では全体的に0.527~0.547と中程度の相関でした。しかし、内頚動脈(ICA)およびM1分節閉塞のサブグループ解析では、内頚静脈の相関は0.76~0.78と大幅に増加しました。
に詳細な相関関係が示され、
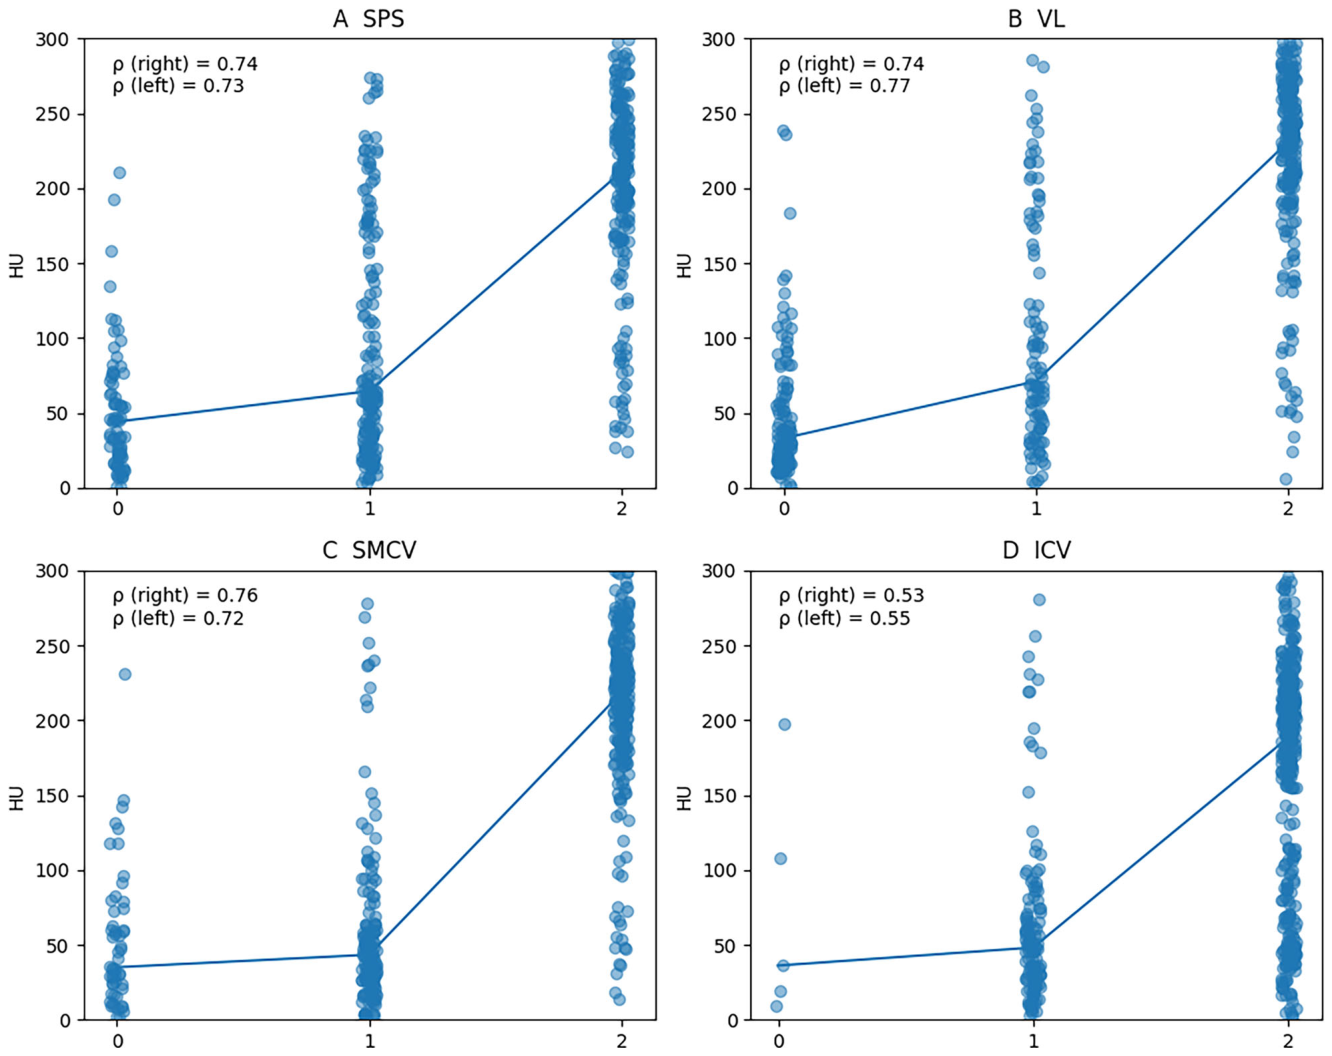
Figure 3. Fig. 3 Segment-level validation of quantitative venous attenuation. Scatterplots illustrate the relationship between visual venous outflow scores and quantitative attenuation measurements expressed as mean Hounsfield units (HU) extracted from individual venous structures on CT angiography. Measurements from the right and left hemispheres were combined for visualization but analyzed separately. Panels show the correlations for the sphenoparietal sinus (SPS; A), the vein of Labbé (VL; B), the superficial middle cerebral vein (SMCV; C), and the internal cerebral vein (ICV; D). Each point represents a single venous segment measurement. Spearman correlation coefficients (ρ) are reported separately for the right and left hemispheres解説: 本散布図は、目視による静脈流出量スコアと、CTアンギオグラフィーから個々の静脈構造から抽出された平均Hounsfield単位(HU)で表される定量的減弱値測定値との関係を示しています。Aは蝶形頭頂洞(SPS)、Bはラベ静脈(VL)、Cは浅い中大脳静脈(SMCV)、Dは内頚静脈(ICV)の相関を示しています。各点は単一の静脈セグメント測定値を表しており、スピアマン相関係数(ρ)が左右半球で個別に報告されています。
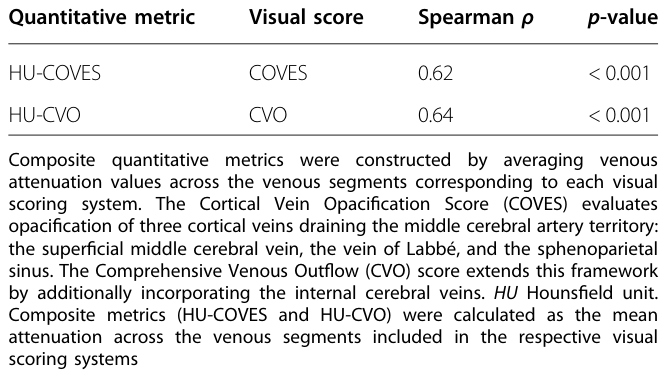
Table 3. Table 3 Correlation between composite quantitative venous attenuation metrics and visual venous outflow scores解説: 本表は、複合的な定量的静脈減弱値指標(HU-COVESおよびHU-CVO)と、目視による静脈流出量スコア(COVESおよびCVO)との相関関係を示しています。HU-COVESはCOVESと0.62のスピアマン相関係数を示し、HU-CVOはCVOと0.64の相関係数を示しました。両者ともp値は0.001未満であり、中程度の相関があることが示されました。
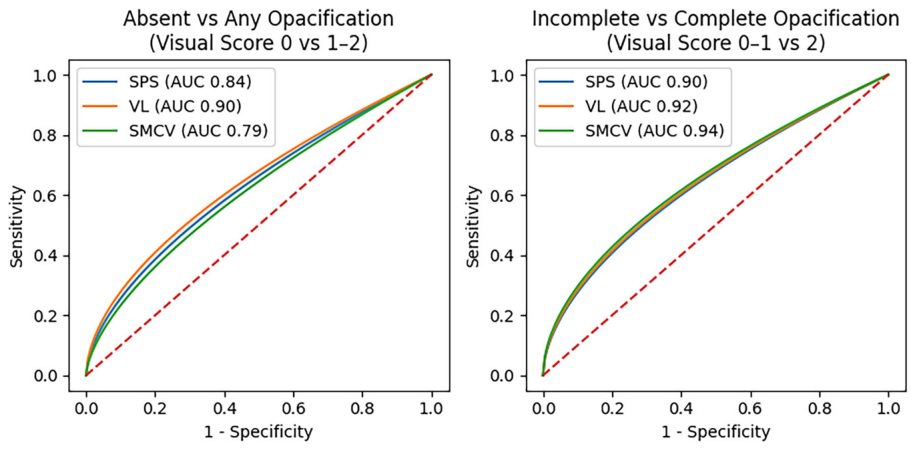
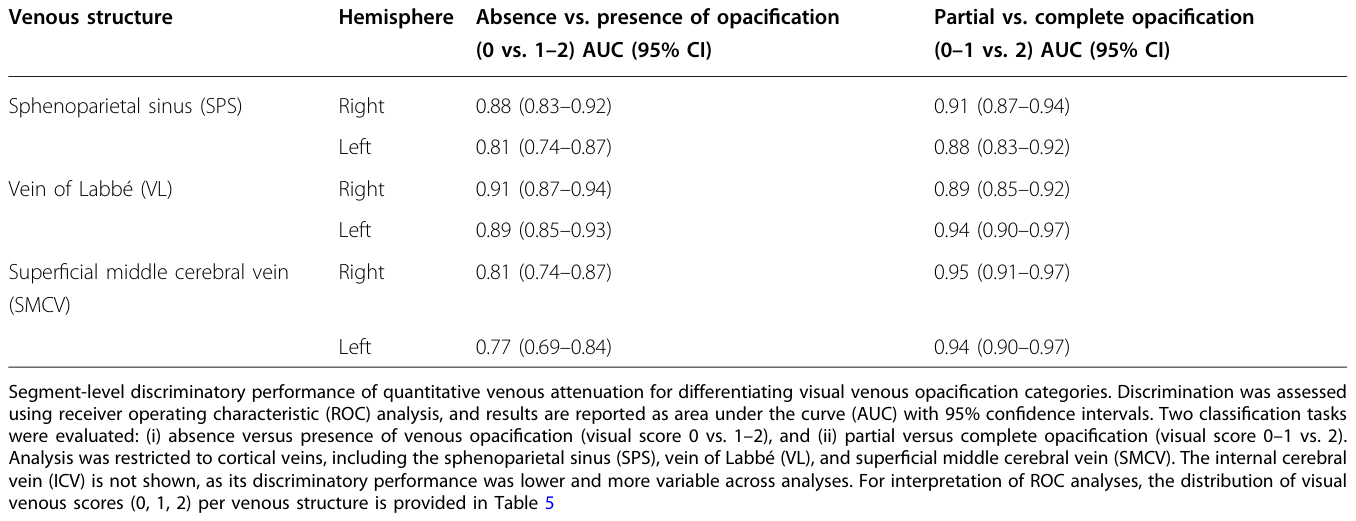
にこれらの複合指標間の相関がまとめられています。受信者動作特性(ROC)解析により、定量的な静脈減弱値が、目視で定義された静脈造影カテゴリを高い精度で判別できることが示されました。特に、造影の「有無」(視覚スコア0 vs. 1-2)の判別において、皮質静脈のAUC値は0.81から0.91の範囲でした。「部分的造影」と「完全造影」(視覚スコア0-1 vs. 2)の判別では、AUC値は0.88から0.95とさらに高くなりました。
Figure 4. Fig. 4 Segment-level ROC analysis of quantitative venous attenuation for visual venous opacification. Receiver operating characteristic (ROC) curves demonstrating the discriminatory performance of quantitative venous attenuation for differentiating categories of visually graded venous opacification at the segment level. Left Panel: Discrimination of absent versus present venous opacification, defined by visual scores of 0 (no visible contrast opacification) versus 1–2 (any degree of visible opacification). Right Panel: Discrimination of partial versus complete venous opacification, defined by visual scores of 0–1 (absent or incomplete opacification) versus 2 (complete opacification). ROC curves are shown for the sphenoparietal sinus (SPS), vein of Labbé (VL), and superficial middle cerebral vein (SMCV). Area under the curve (AUC) values reflect aggregated performance across hemispheres. The dashed diagonal line indicates chance-level discrimination解説: 本ROC曲線は、セグメントレベルでの視覚的に評価された静脈造影カテゴリを区別するための定量的静脈減弱値の判別性能を示しています。左のパネルは、視覚スコア0(造影剤が全く見えない)対1~2(何らかの造影剤が見える)で定義される「造影の有無」の判別を示しています。右のパネルは、視覚スコア0~1(造影剤がないか不完全)対2(完全な造影)で定義される「部分的造影と完全造影」の判別を示しています。ROC曲線は蝶形頭頂洞(SPS)、ラベ静脈(VL)、浅い中大脳静脈(SMCV)について示されており、AUC値は半球全体の総合的な性能を反映しています。
はこれらのROC曲線を示しており、
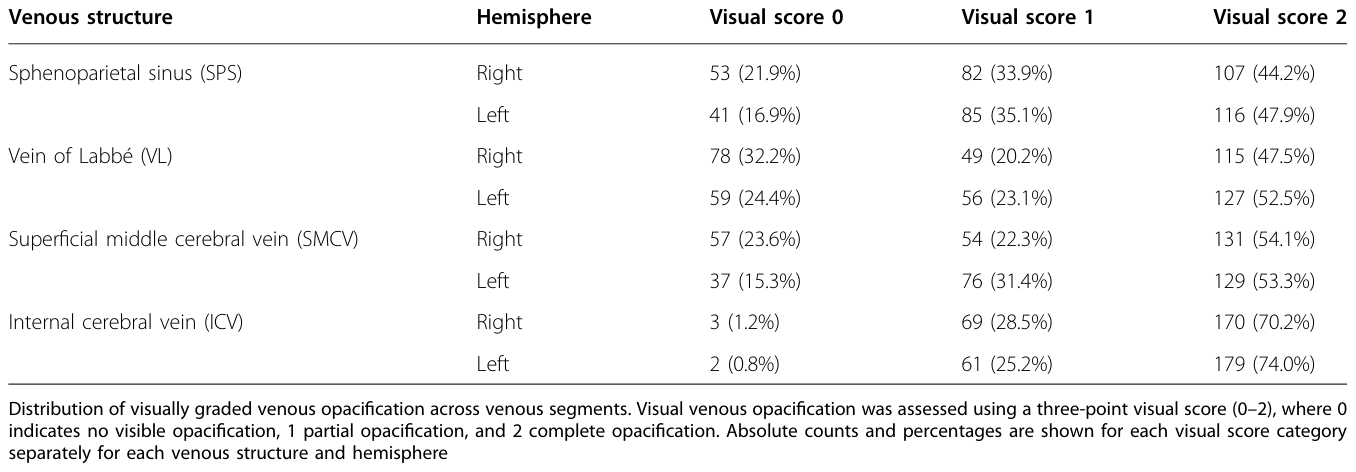
Table 4. Table 4 Segment-level discriminatory performance of quantitative venous attenuation解説: 本表は、定量的静脈減弱値が視覚的な静脈造影カテゴリをどの程度判別できるかを示す、セグメントレベルの判別性能をまとめています。造影の「有無」(視覚スコア0 vs. 1~2)の判別では、皮質静脈(蝶形頭頂洞、ラベ静脈、浅い中大脳静脈)のAUC値は0.77~0.91の範囲でした。「部分的造影」と「完全造影」(視覚スコア0~1 vs. 2)の判別では、AUC値は0.88~0.97とさらに高い性能を示しました。

コメントを残す