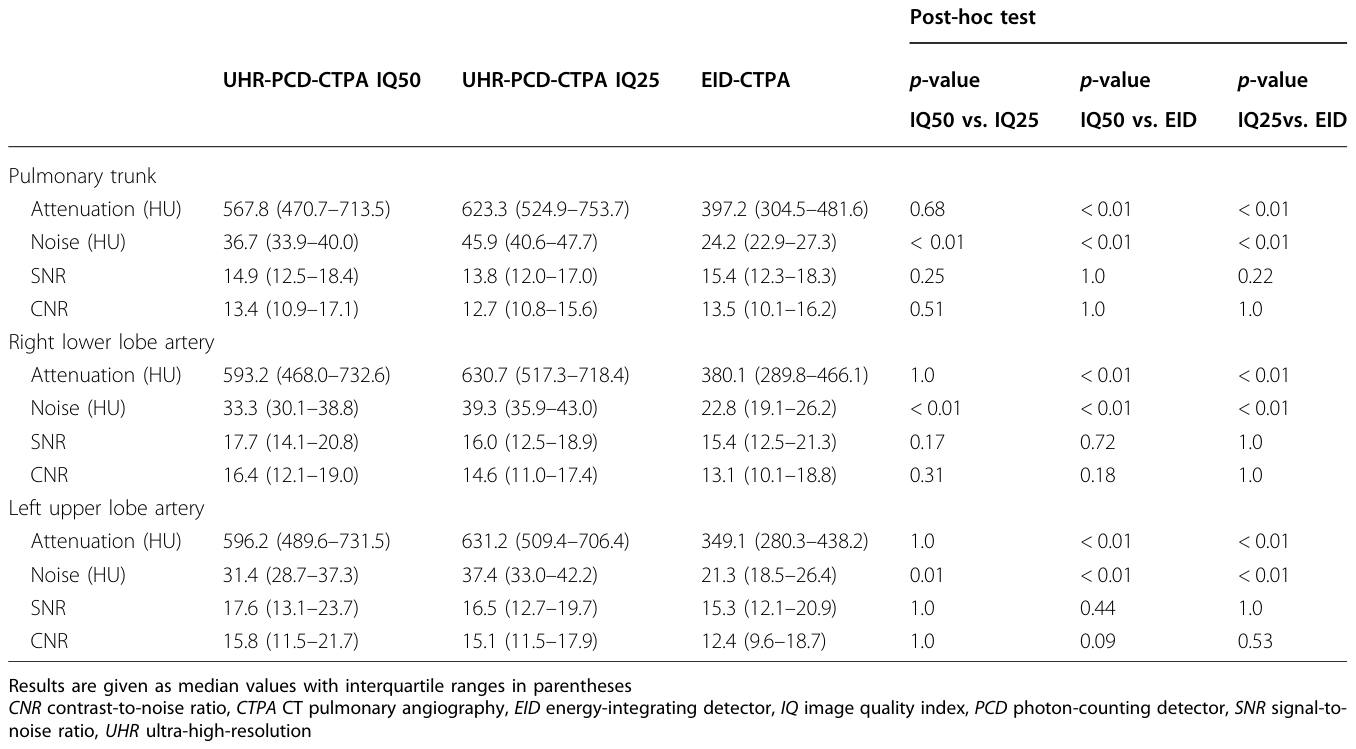
どうも、Beyond the Pixelです。肺塞栓症は、肺の血管が血栓で詰まる重篤な疾患であり、その迅速かつ正確な診断には画像診断が不可欠です。これまで、CT肺動脈造影(CTPA)は肺塞栓症の診断において最も選択される画像診断法として広く用いられてきました。特に、スペクトルCTの登場により、画像コントラストの向上が図られ、ヨードマップの生成によって肺実質の血流に関する機能的な情報も得られるようになり、小さな末梢肺塞栓の検出に有用であることが示されています。2020年には、従来のエネルギー積算型検出器(EID)技術に基づくスペクトルCTとは異なる、フォトンカウンティング検出器(PCD)技術を用いた新しいスペクトルイメージングアプローチが登場しました。このPCD-CTは、高ピッチ設定でのスキャンを可能にし、必要な放射線量や造影剤の大幅な削減を実現できる可能性が示唆されています。
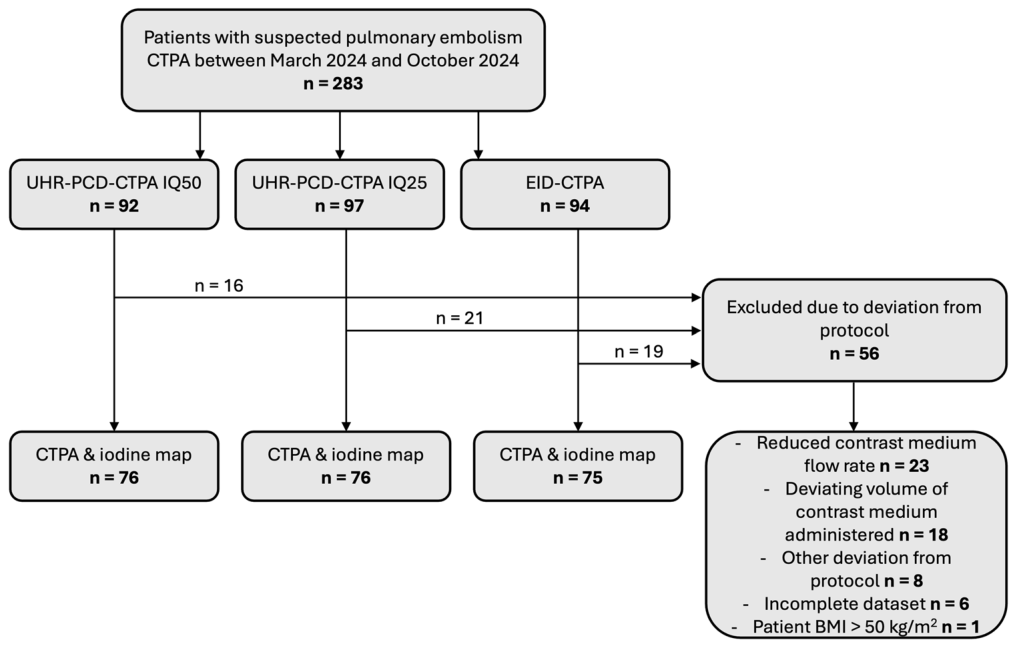
Figure 1. Fig. 1 Study sample. “Other deviations from protocol” include cases in which patients had received contrast agent immediately before the diagnostic CTPA or in which regions of interest in monitoring were malpositioned, among others. BMI, body mass index; CTPA, CT pulmonary angiography; EID, energy-integrating detector; IQ, image quality index; PCD, photon-counting detector; UHR, ultra-high resolution解説: 本図は、研究対象の選定プロセスを示すフローチャートです。2024年3月から10月にかけて肺塞栓症疑いでCTPAを受けた283名の対象者から、プロトコルからの逸脱など56名を除外した後、最終的に227名の検査が分析されました。内訳はUHR-PCD-CTPA IQ50群76名、UHR-PCD-CTPA IQ25群76名、EID-CTPA群75名です。
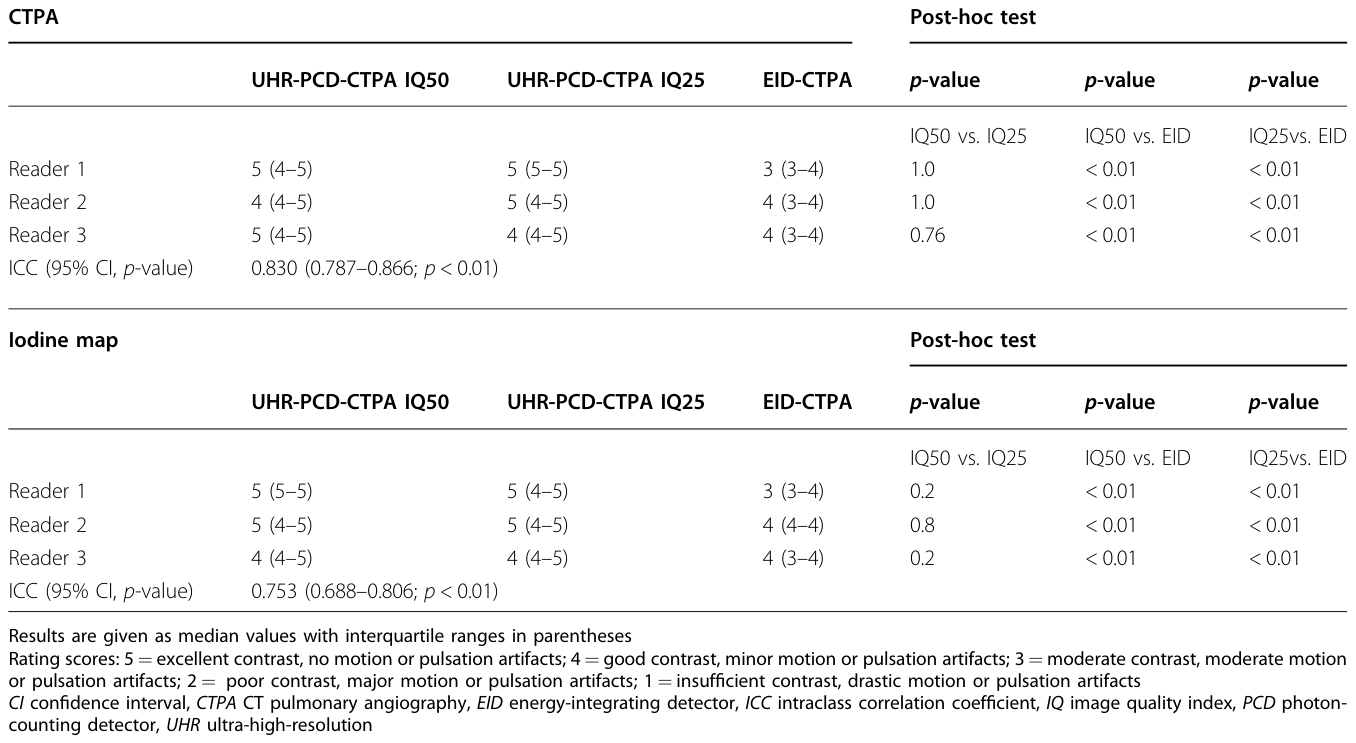
Table 3. Table 3 Subjective image quality of CT pulmonary angiographies and iodine maps解説: 本表は、CTPAおよびヨードマップの主観的画質評価結果を示しています。UHR-PCD-CTPAのIQ50群、IQ25群、およびEID-CTPA群における各専門家による画質スコアの中央値と四分位範囲が記載されています。評価スコアは、コントラストやアーチファクトの程度に基づき5段階で設定されており、専門家間の級内相関係数(ICC)も示されています。
末梢肺動脈の視認性と診断確信度
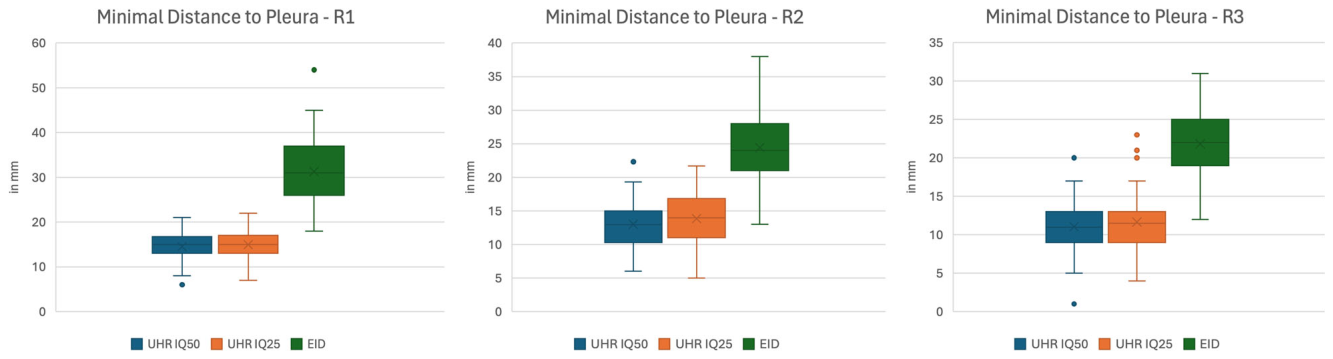
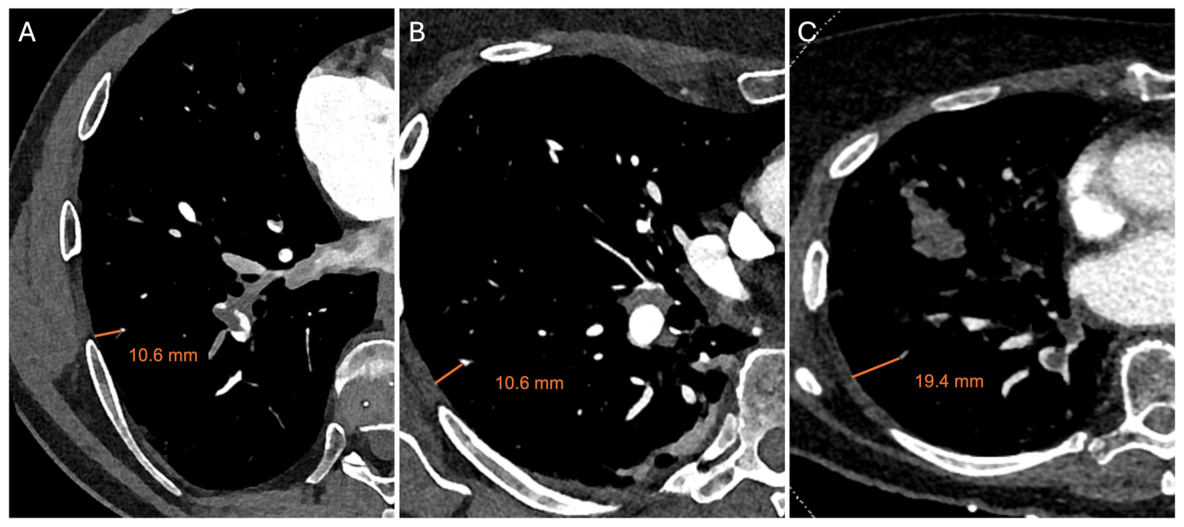
末梢肺血管の視認性も、両PCD-CTPA群でEID-CTPAと比較して高いと評価されました。最終的に明確に視認できる肺動脈枝から胸膜までの最小距離は、EID-CTPA群で最も長い中央値を示し(R1: 31.0 mm, R2: 24.0 mm, R3: 22.0 mm)、UHR-PCD-CTPA群では有意に短い距離でした(IQ50: R1: 15.0 mm, R2: 13.0 mm, R3: 11.0 mm; IQ25: R1: 15.0 mm, R2: 14.0 mm, R3: 11.5 mm)(いずれもp < 0.01)。
Figure 3. Fig. 3 Lower distance from the peripheral pulmonary artery to pleura measured with ultra-high resolution photon-counting CT. Boxplots demonstrate median values of minimal distance from the last clearly discernible peripheral pulmonary artery branch to the visceral pleura as measured by readers 1-3 (R1-3). Irrespective of dose level, readers consistently measured a lower distance in the UHR-PCD-CPTA groups than in the EID CTPA group. CTPA, CT pulmonary angiography; EID, energy-integrating detector; IQ, image quality index; PCD, photon-counting detector; UH, ultra-high resolution解説: 超高解像度フォトンカウンティングCTで測定された末梢肺動脈から胸膜までの距離が短いことを示すボックスプロットです。専門家1~3(R1-3)が測定した、最後に明確に識別できる末梢肺動脈枝から臓側胸膜までの最小距離の中央値を示しています。線量レベルに関わらず、専門家はEID-CTPA群よりもUHR-PCD-CPTA群で一貫して短い距離を測定しました。
Figure 4. Fig. 4 Increased peripheral pulmonary artery visibility with ultra-high-resolution photon-counting CT. UHR-PCD-CTPA at IQ50 (A) and IQ25 (B) vs. EID- CTPA (C). Representative measurements of the minimal distance of the last discernible pulmonary artery branch to the pleura are shown (orange line, in mm). CTPA, CT pulmonary angiography; EID, energy-integrating detector; IQ, image quality index; PCD, photon-counting detector; UHR, ultra-high resolution解説: 超高解像度フォトンカウンティングCTによる末梢肺動脈の視認性向上を示す画像です。UHR-PCD-CTPAのIQ50(A)とIQ25(B)、およびEID-CTPA(C)の代表的な画像が示されています。最後に識別できる肺動脈枝から胸膜までの最小距離の測定値(オレンジ色の線、mm単位)が示されています。
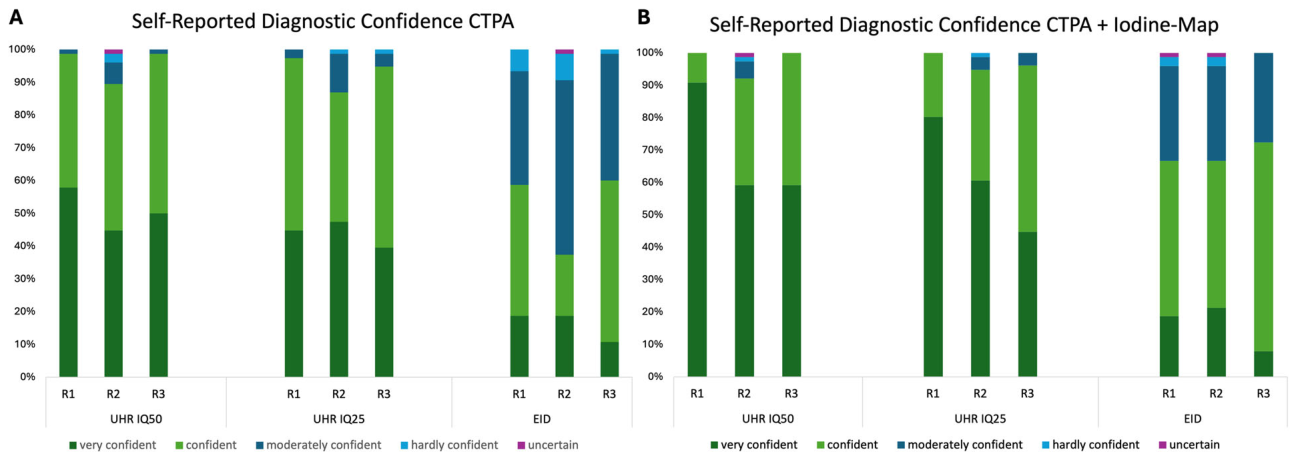
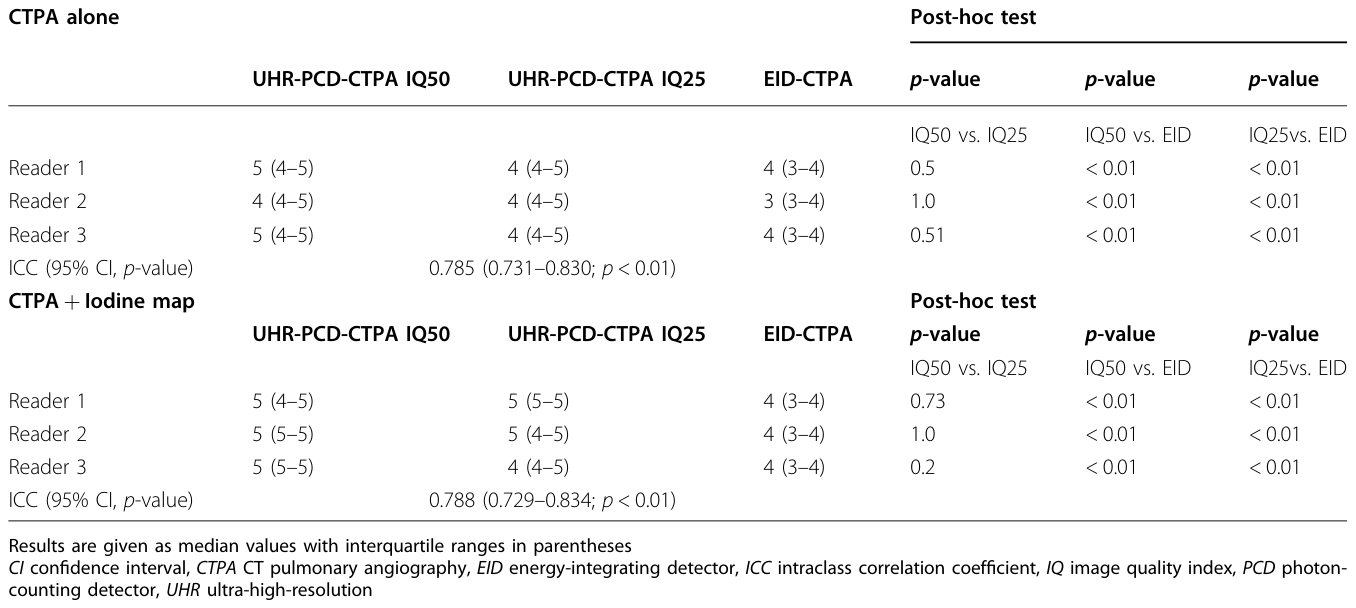
Figure 5. Fig. 5 Higher self-reported diagnostic confidence with ultra-high resolution photon-counting CT. Stacked bar charts demonstrating self-reported diagnostic confidence levels of readers 1-3 (R1-3). Readers reported higher confidence levels in confirming or excluding pulmonary embolism for UHR- PCD-CTPAs at IQ50 and IQ25 than for EID-CTPAs, after reading CTPA alone (A) as well as CTPA and iodine-maps combined (B, the two highest confidence scores reported by readers after viewing CTPAs and iodine-maps in 92.1–100% of IQ50, 94.6–100% of IQ25 and 66.6–73.3% of EID cases). CTPA, CT pulmonary angiography; EID, energy-integrating detector; IQ, image quality index; PCD, photon-counting detector; UHR, ultra-high resolution解説: 超高解像度フォトンカウンティングCTによる自己申告診断確信度の向上を示す棒グラフです。専門家1~3(R1-3)の自己申告診断確信度レベルを示しています。CTPA単独(A)およびCTPAとヨードマップの組み合わせ(B)で、専門家はEID-CTPAよりもUHR-PCD-CTPA(IQ50およびIQ25)に対して、肺塞栓症の確認または除外において高い確信度レベルを報告しました。Table 4. Table 4 Self-reported diagnostic confidence解説: 本表は、専門家が自己申告した診断確信度の結果をまとめたものです。CTPA単独の読影、およびCTPAとヨードマップを組み合わせた読影それぞれについて、UHR-PCD-CTPAのIQ50群、IQ25群、およびEID-CTPA群における各専門家の確信度スコアの中央値と四分位範囲が記載されています。専門家間の級内相関係数(ICC)も示されています。
肺塞栓症陰性の研究のサブグループ分析でも同様の結果が示されました。
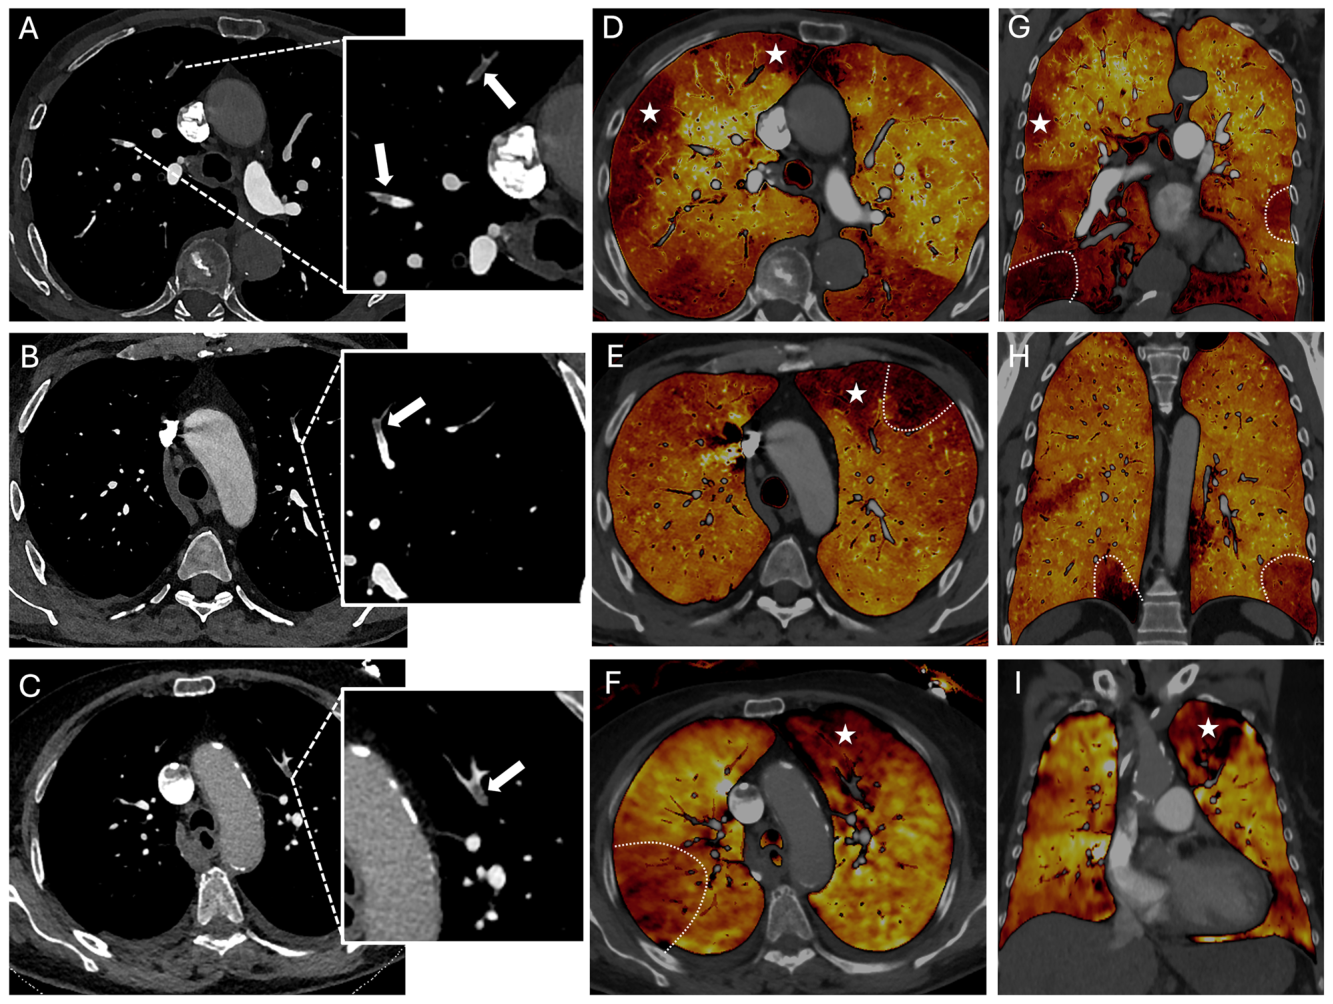
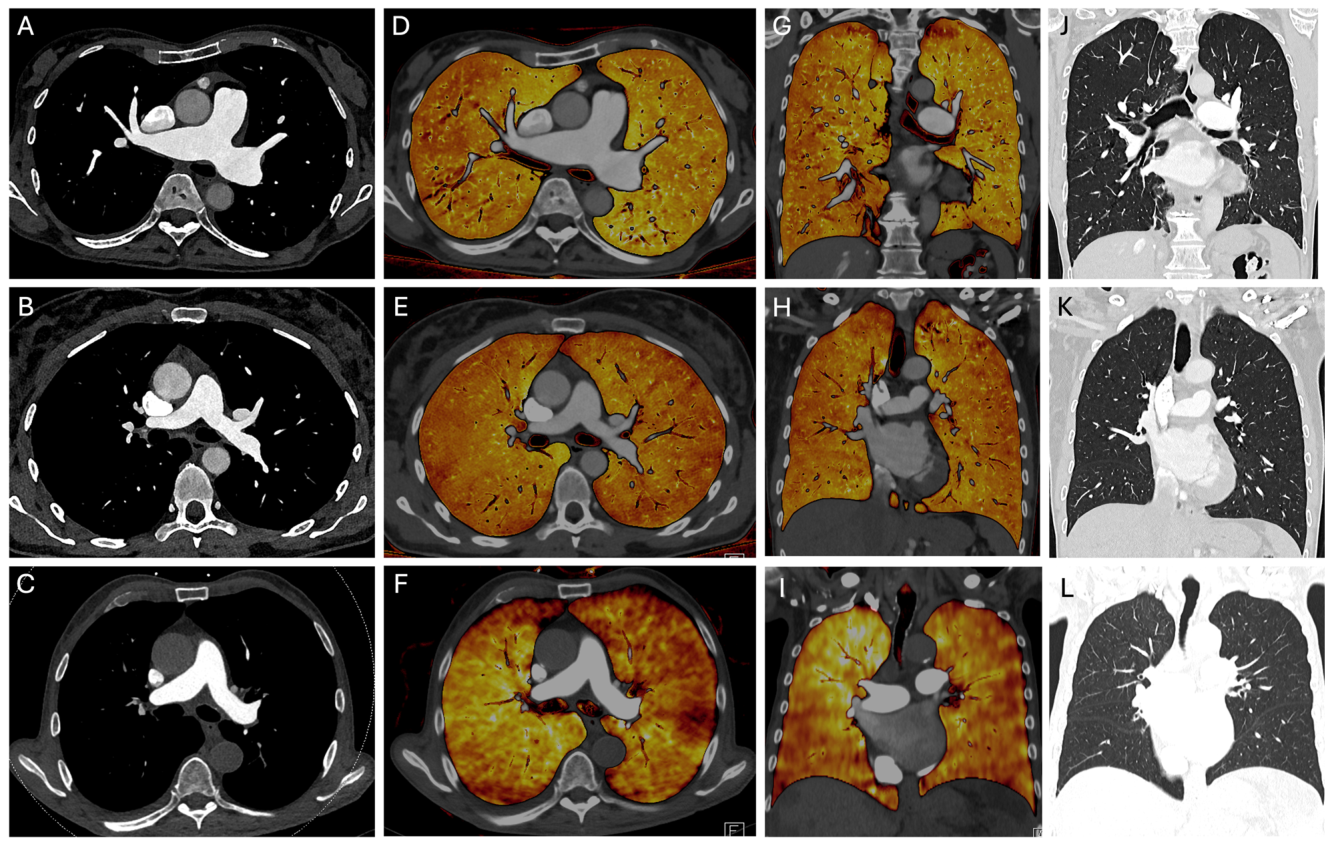
Figure 2. Fig. 2 Multifocal peripheral pulmonary embolism. Axial images of UHR-PCD-CTPA at IQ50 (A) and IQ25 (B) vs. EID-CTPA (C) showing peripheral pulmonary embolism (magnified boxes, arrows) with consecutive perfusion deficits (asterisks) in the corresponding axial (D–F) and coronal (G–I) iodine maps. Perfusion deficits resulting from additional pulmonary emboli not depicted in the selected representative images are marked with dashed bows. Note the excellent spatial resolution of CTPA images and iodine maps with PCD in UHR mode, irrespective of IQ level. CTPA, CT pulmonary angiography; EID, energy-integrating detector; IQ, image quality index; PCD, photon-counting detector; UHR, ultra-high resolution解説: 多発性末梢肺塞栓症の症例を示す画像です。UHR-PCD-CTPAのIQ50(A)とIQ25(B)、およびEID-CTPA(C)の軸位画像が、対応する軸位(D–F)および冠状位(G–I)のヨードマップと共に提示されています。拡大されたボックスと矢印で末梢肺塞栓症が示され、対応するヨードマップでは灌流異常(アスタリスク)が見られます。Figure 6. Fig. 6 Exclusion of pulmonary embolism. Axial images of UHR-PCD-CTPA at IQ50 (A) and IQ25 (B) vs. EID-CTPA (C) with corresponding axial (D–F) and coronal (G–I) iodine maps, as well as coronal slices of the corresponding lung window (J–L). Note the excellent homogeneity of iodine maps of PCD- CTPA in UHR mode, irrespective of IQ level, while EID-CTPA iodine maps show some inhomogeneous spots that are not explained by underlying parenchymal pathologies like emphysema (see corresponding coronal lung window, L). CTPA, CT pulmonary angiography; EID, energy-integrating detector; IQ, image quality index; PCD, photon-counting detector; UHR, ultra-high resolution解説: 肺塞栓症を除外した症例を示す画像です。UHR-PCD-CTPAのIQ50(A)とIQ25(B)、およびEID-CTPA(C)の軸位画像が、対応する軸位(D–F)および冠状位(G–I)のヨードマップ、ならびに肺野条件の冠状位スライス(J–L)と共に示されています。UHRモードのPCD-CTPAヨードマップは、IQレベルに関わらず優れた均一性を示し、EID-CTPAヨードマップに見られる不均一な斑点(基底となる肺実質病変では説明できない)と対照的です。

コメントを残す