どうも、Beyond the Pixelです。がん治療の分野では、重粒子線治療がその精密さと効果から注目を集めています。特に炭素イオンビームは、がん組織に集中してエネルギーを放出する特性(ブラッグピーク)を持ち、周囲の正常組織へのダメージを最小限に抑えることが期待されています。この高精度な治療を安全かつ効果的に実施するためには、照射される線量を正確に測定する「線量測定(ドシメトリー)」が不可欠です。本記事では、この線量測定において頻繁に用いられる「アラニン線量計」に関する重要な研究についてご紹介します。
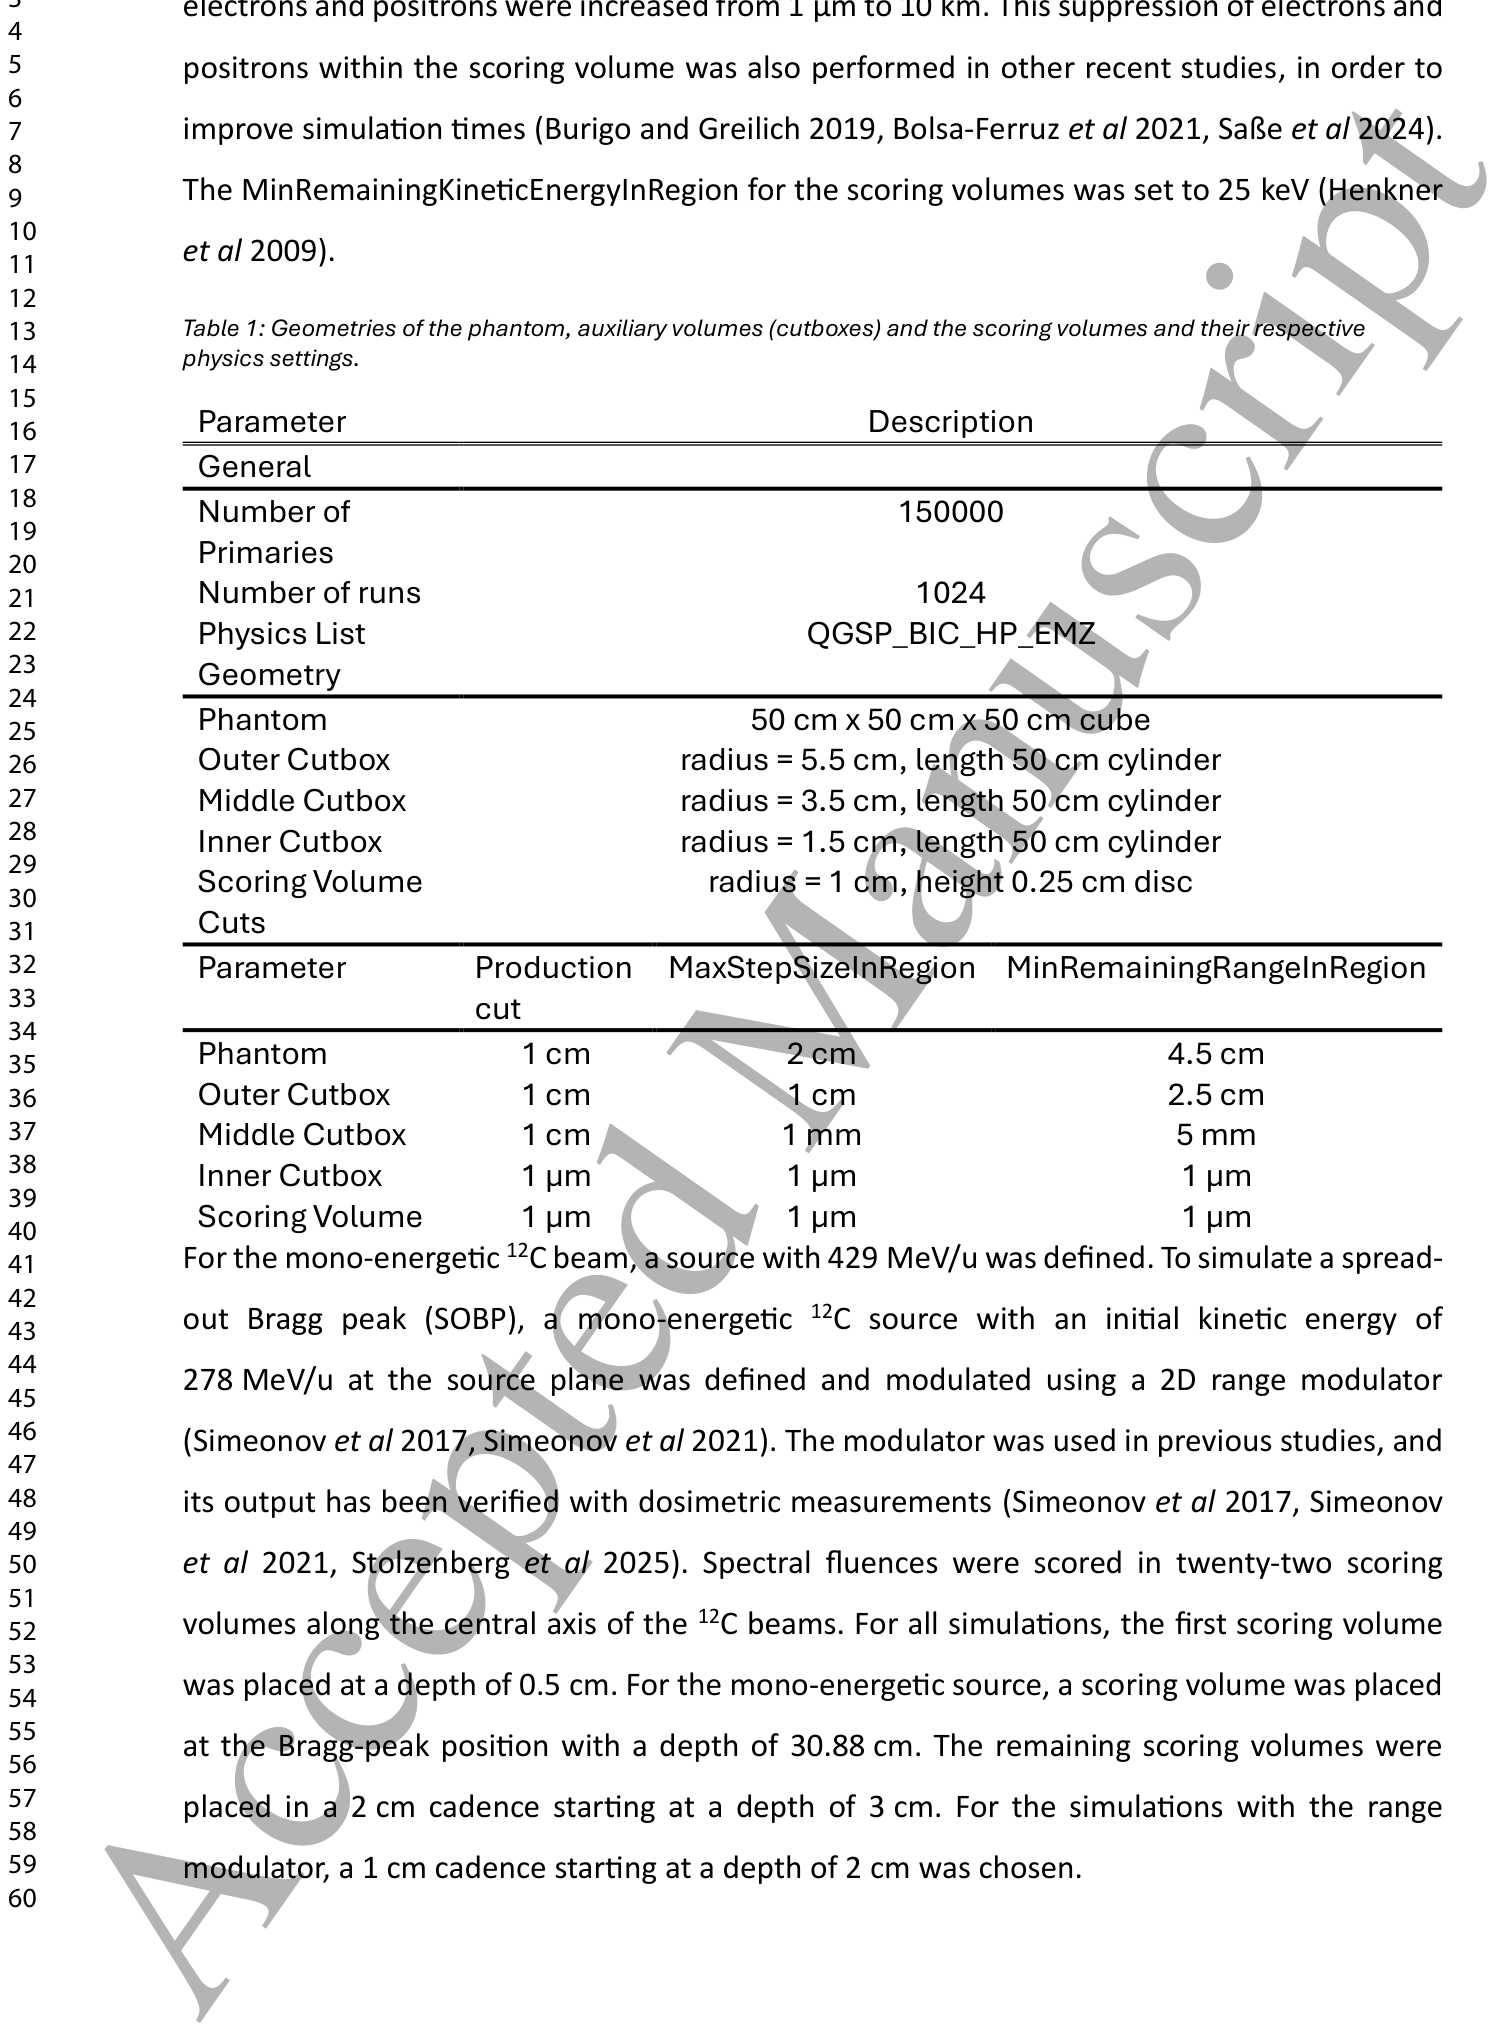
Table 1. Table 1: Geometries of the phantom, auxiliary volumes (cutboxes) and the scoring volumes and their respective physics settings.解説: ファントム、補助ボリューム(カットボックス)、スコアリングボリュームの幾何学的設定と、それぞれの物理設定に関するパラメーターを示しています。例えば、ファントムは50 cm x 50 cm x 50 cmの立方体で、一次粒子の数は150000、実行回数は1024です。
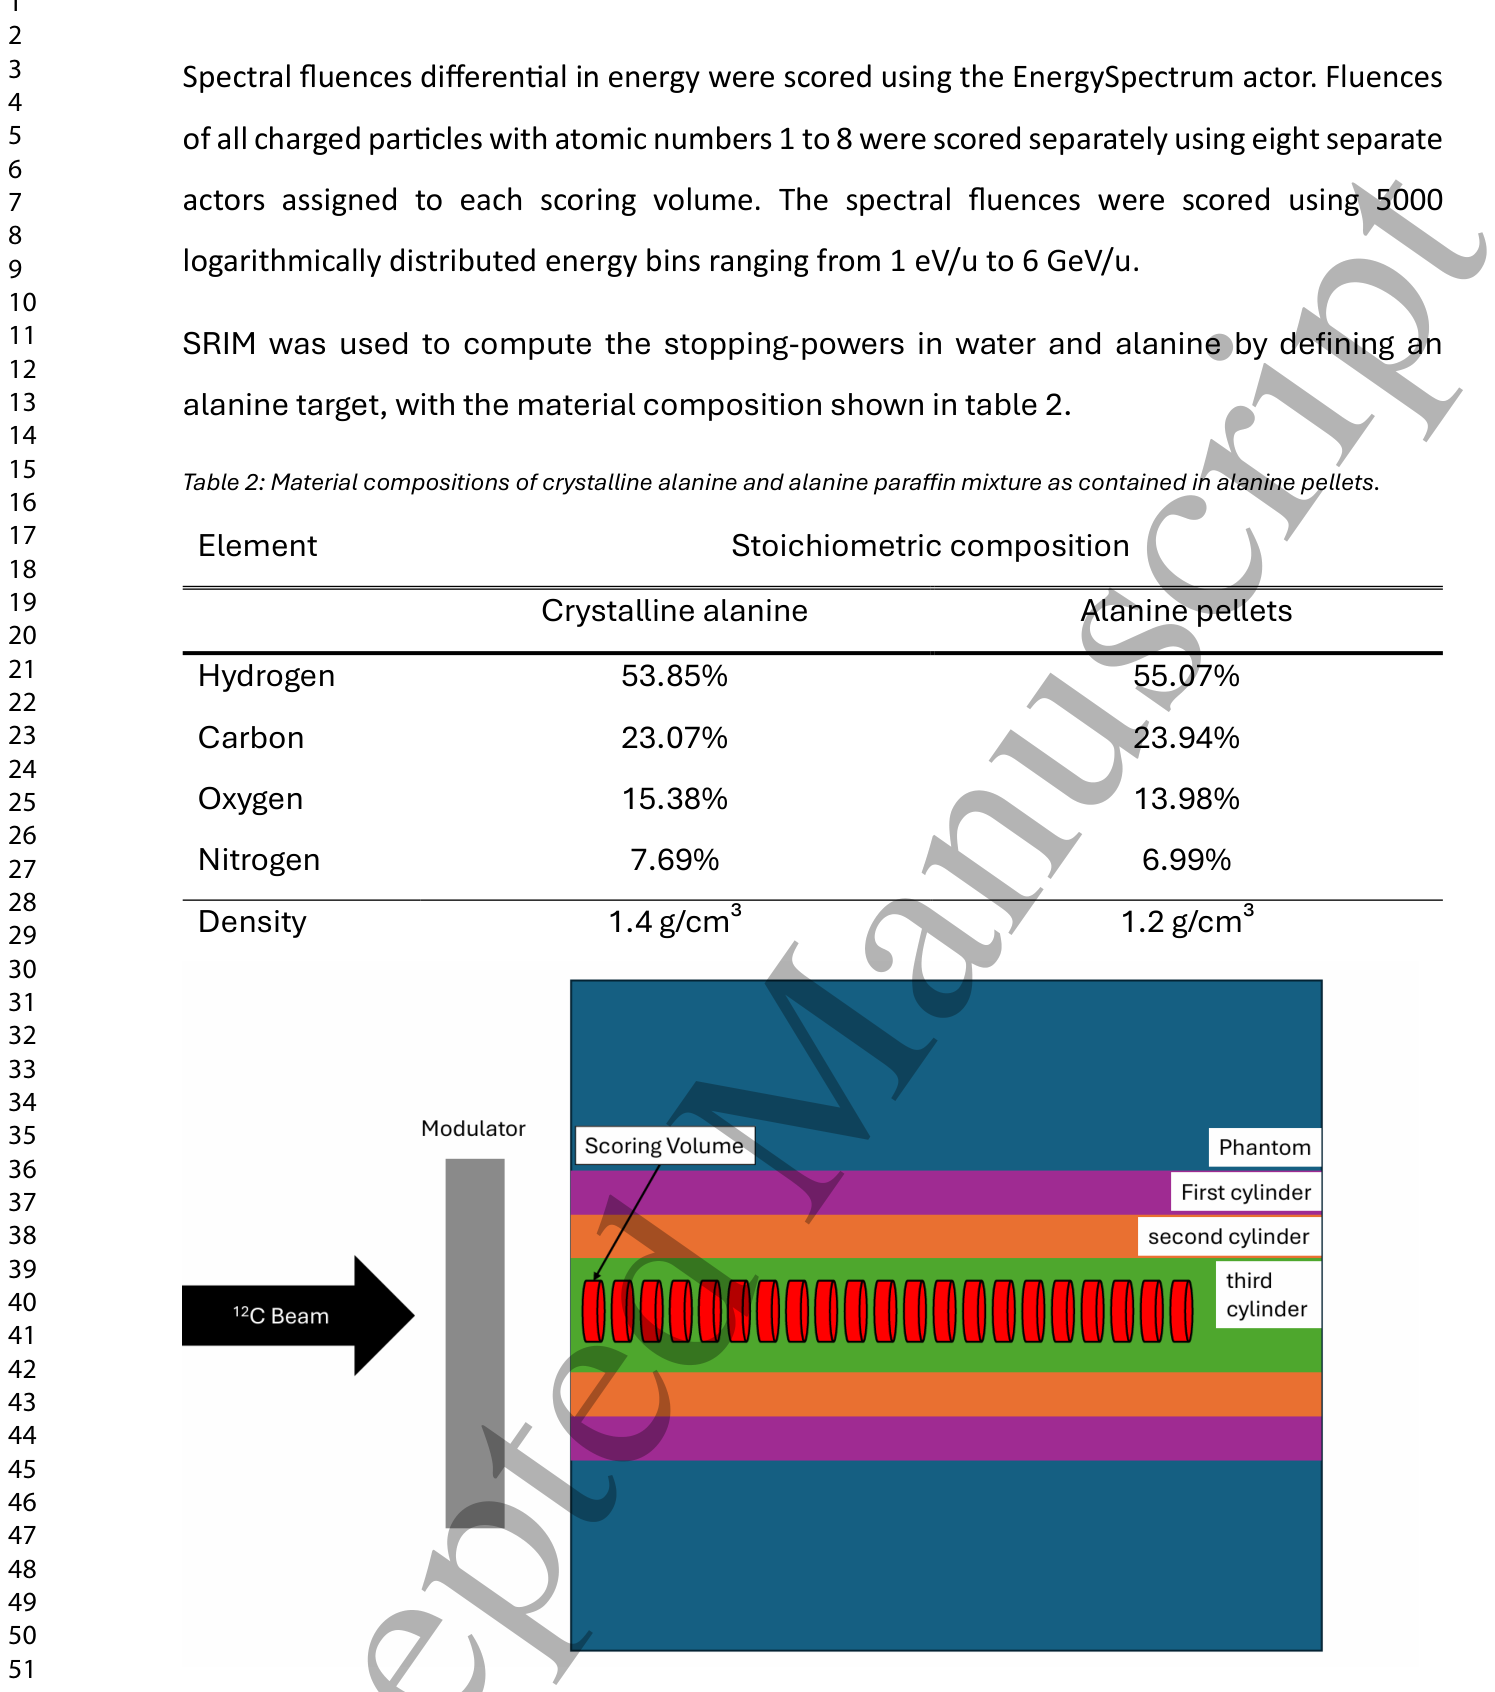
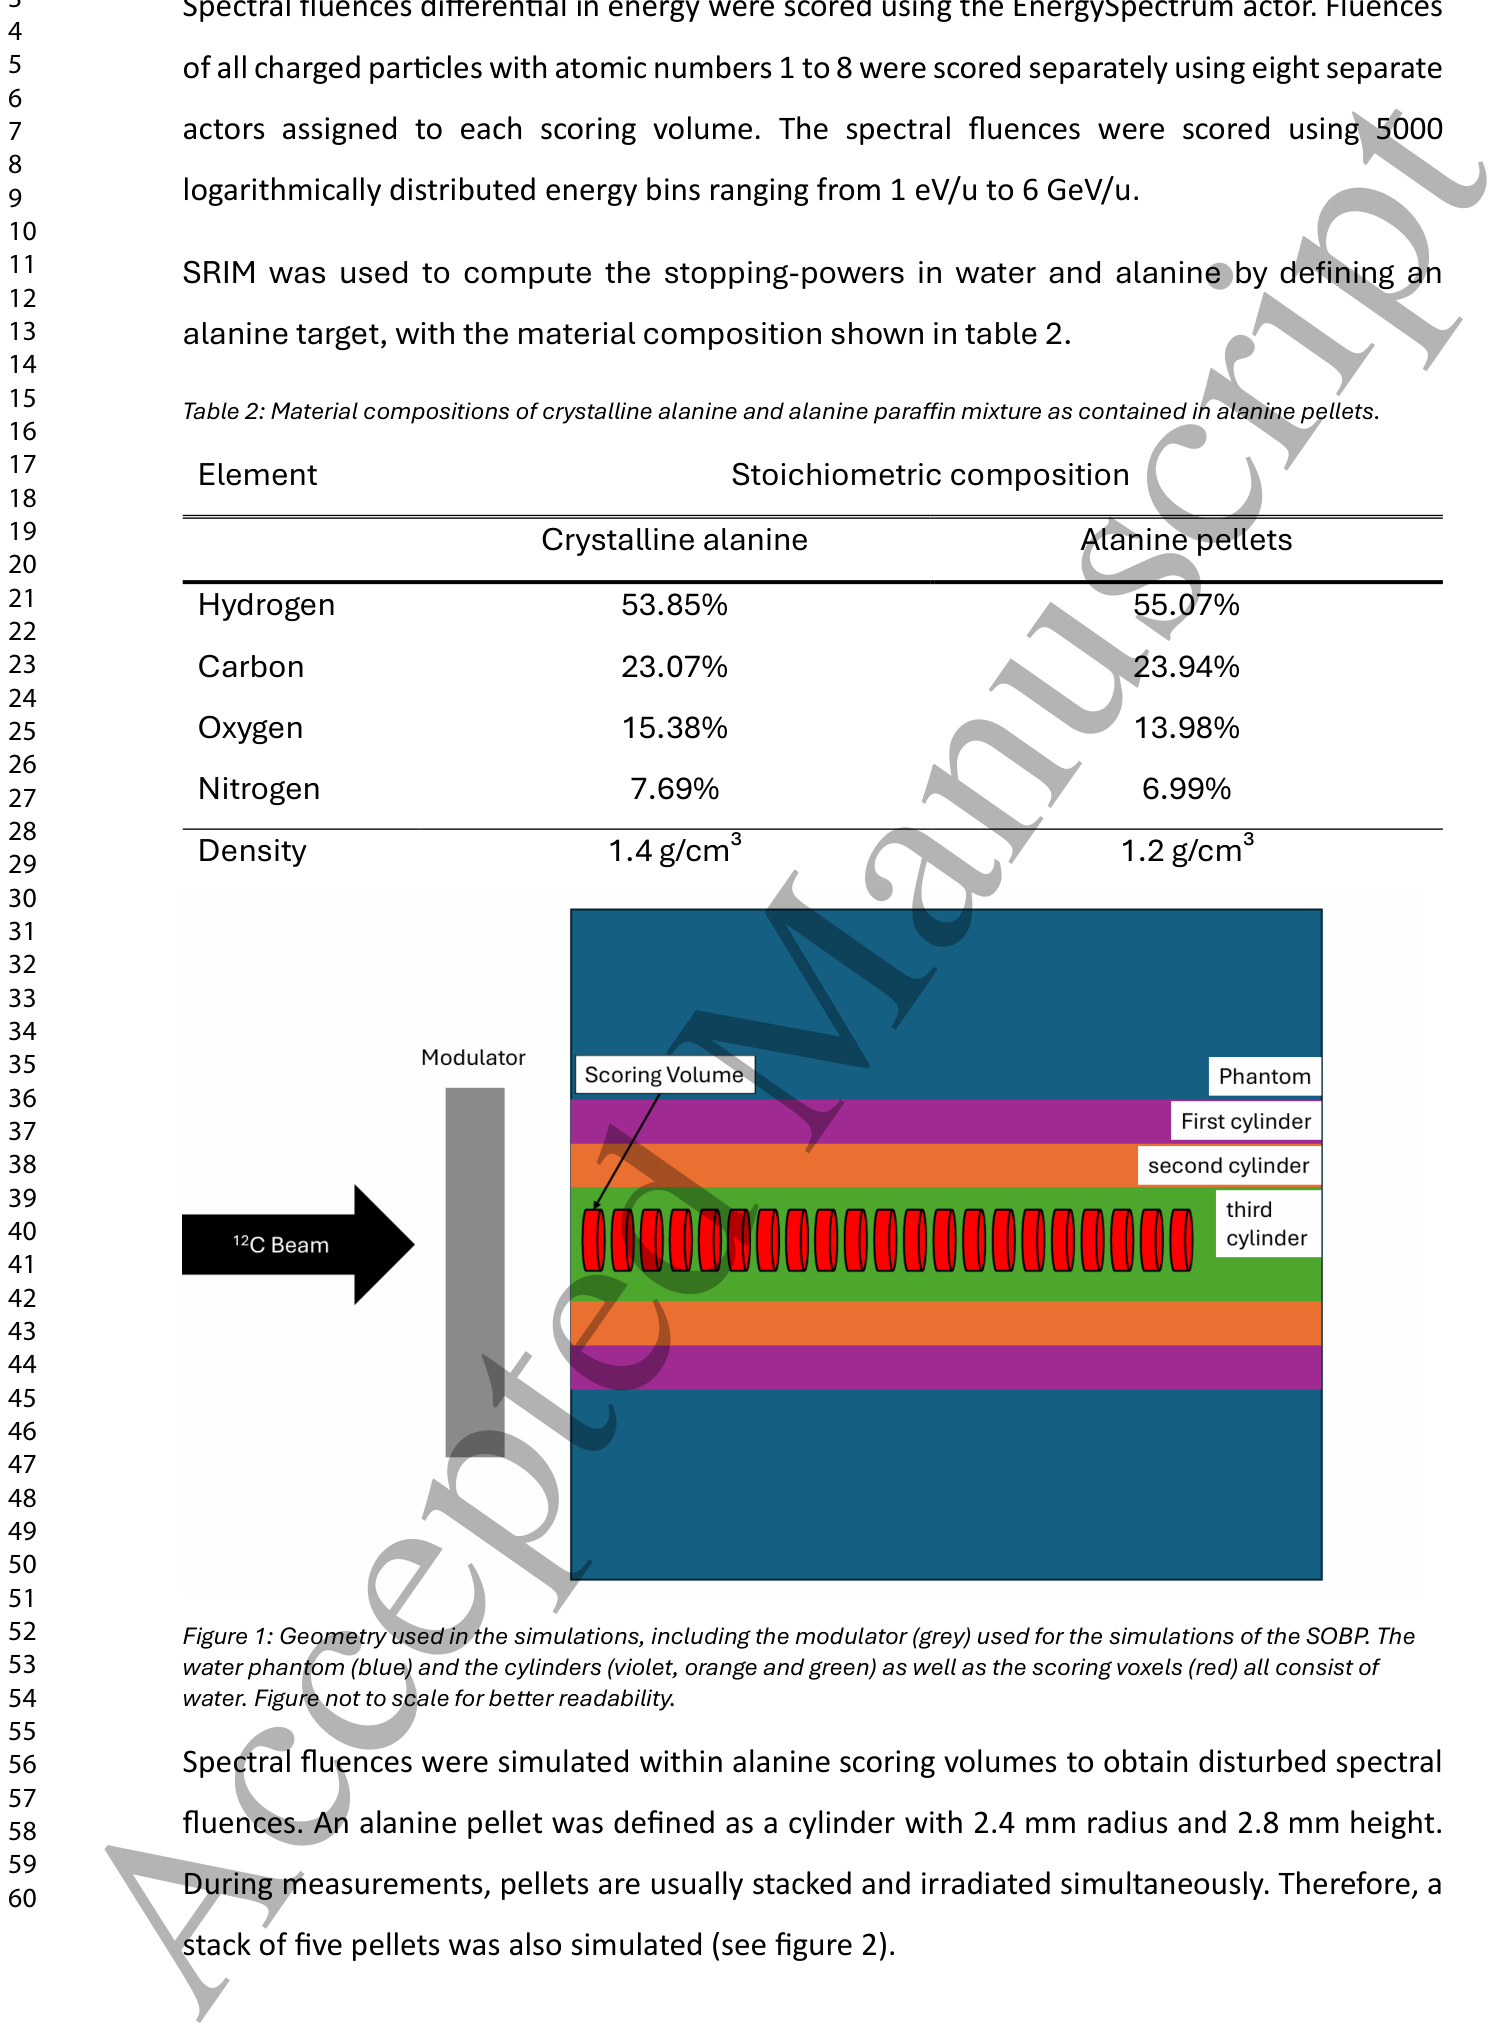
はこのシミュレーションで使用されたファントム、補助ボリューム、スコアリングボリュームの形状と物理設定を示しています。シミュレーションは、50 cm x 50 cm x 50 cmの均一な水ファントムに対して、6 cm x 6 cmの平行な炭素イオンビームを照射する形で実施されました。
Figure 1. Figure 1: Geometry used in the simulations, including the modulator (grey) used for the simulations of the SOBP. The water phantom (blue) and the cylinders (violet, orange and green) as well as the scoring voxels (red) all consist of water. Figure not to scale for better readability.解説: シミュレーションで使用された幾何学的設定を示しています。灰色はモジュレーター、青色は水ファントム、紫、オレンジ、緑色の円筒は補助ボリューム、赤色のボックスはスコアリングボリュームをそれぞれ表しています。スケールは読みやすさのために調整されています。
Table 2. Table 2: Material compositions of crystalline alanine and alanine paraffin mixture as contained in alanine pellets.解説: アラニンペレットに含まれる結晶性アラニンとアラニン-パラフィン混合物の材料組成を示しています。水素、炭素、酸素、窒素の質量パーセンテージと、それぞれの密度が記載されています。結晶性アラニンの密度は1.4 g/cm³、アラニンペレットの密度は1.2 g/cm³です。
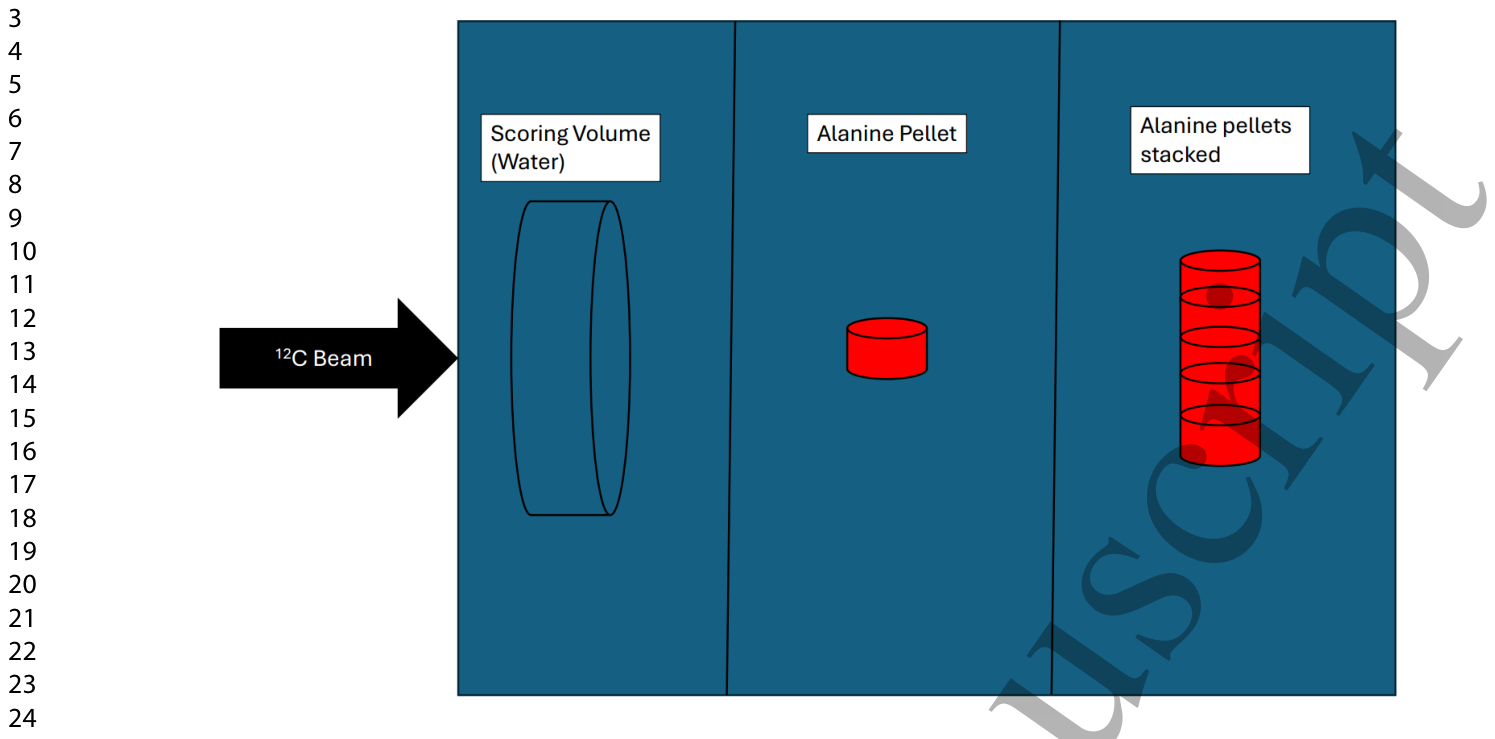
Figure 2. Figure 2: Schematic representation of the three different scoring volumes. On the left the water scoring volume (black wireframe) in the middle the singular alanine pellet (red cylinder) and on the right a stack of alanine pellets (red cylinder with black subsections). Figure not to scale.解説: 3種類のスコアリングボリュームを模式的に示しています。左は水スコアリングボリューム(黒いワイヤーフレーム)、中央は単一のアラニンペレット(赤い円筒)、右は積み重ねられたアラニンペレット(黒いサブセクションを持つ赤い円筒)です。図はスケールに合わせていません。
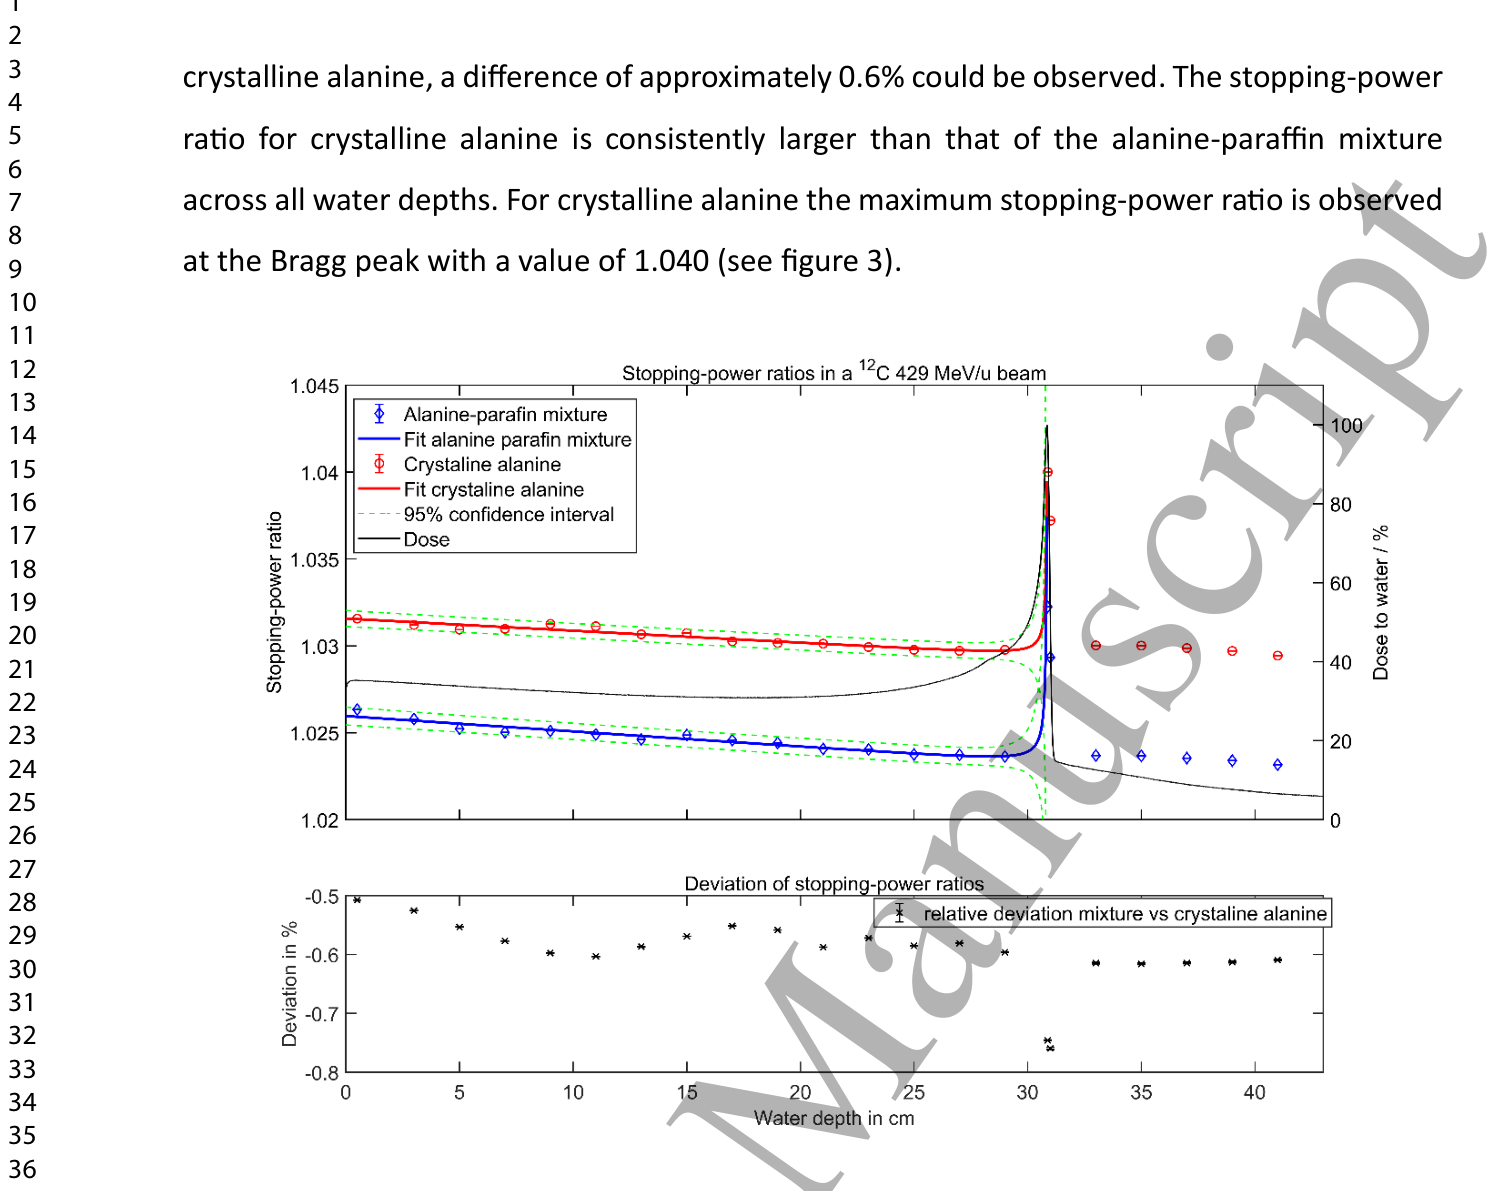
Figure 3. Figure 3: Water-to-alanine stopping-power ratios for crystalline alanine (red) and an alanine-paraffin mixture (blue) along the normalized depth curve of the 12C 429 MeV/u beam (black) in the top panel. Relative deviation of stopping- power ratio from the crystalline alanine (black) in the lower panel.解説: 単一エネルギー429 MeV/uの炭素イオンビームにおける、結晶性アラニン(赤)とアラニン-パラフィン混合物(青)の水とアラニン間の阻止能比を、正規化された深さ曲線(黒)に沿って上部パネルに示しています。下部パネルでは、阻止能比の結晶性アラニンからの相対偏差(黒)をパーセンテージで示しています。ブラッグピークでは結晶性アラニンの阻止能比が最大で1.040でした。
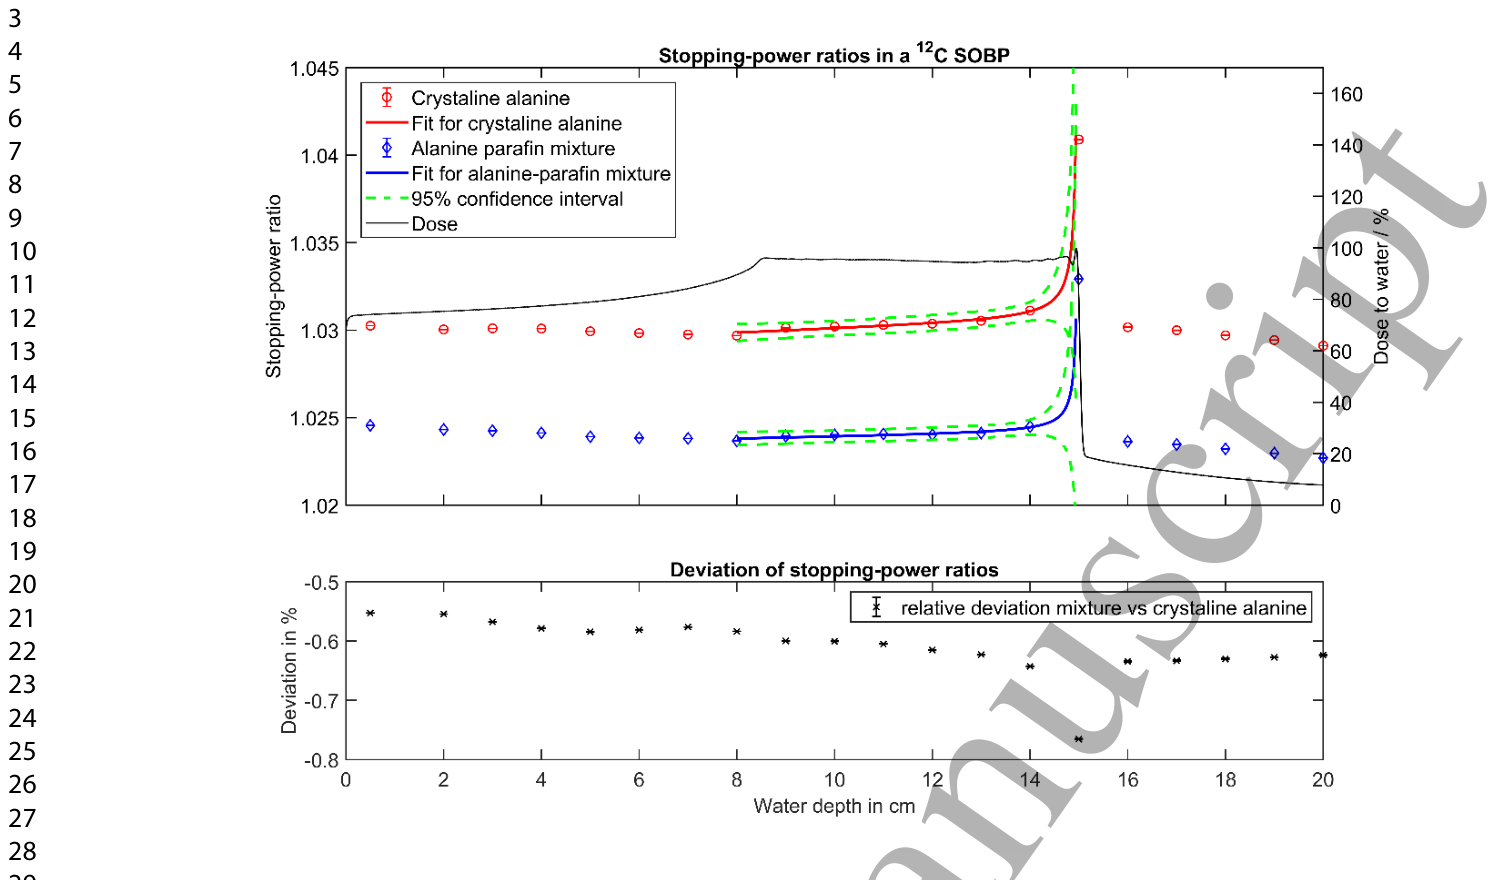
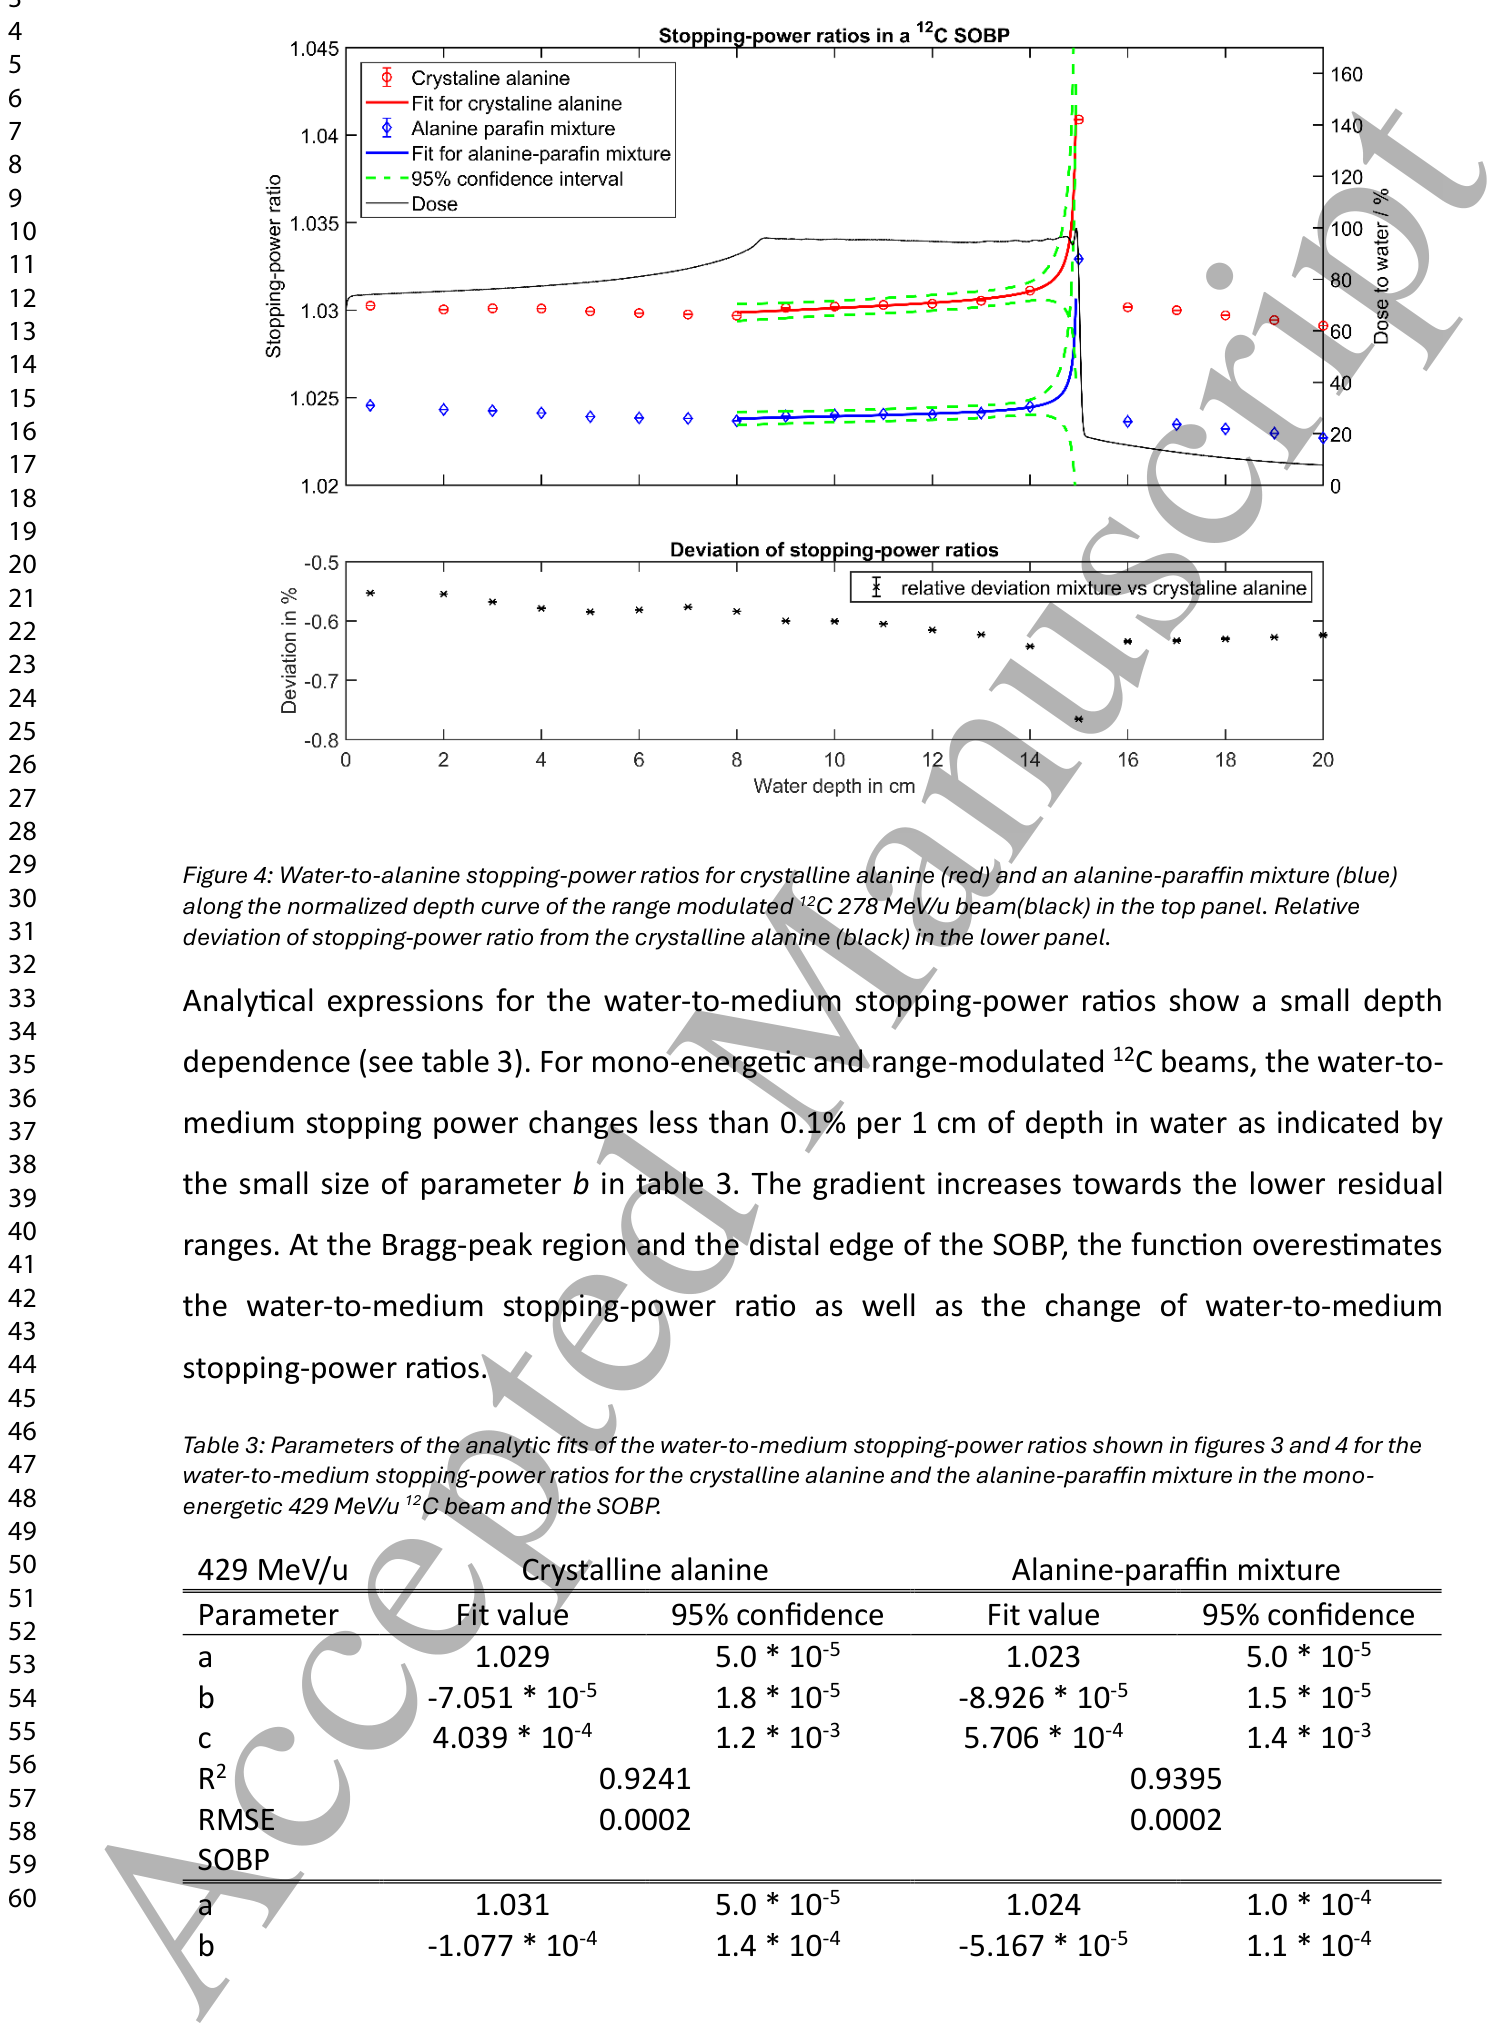
Figure 4. Figure 4: Water-to-alanine stopping-power ratios for crystalline alanine (red) and an alanine-paraffin mixture (blue) along the normalized depth curve of the range modulated 12C 278 MeV/u beam(black) in the top panel. Relative deviation of stopping-power ratio from the crystalline alanine (black) in the lower panel.解説: レンジ変調された278 MeV/uの炭素イオンビームにおける、結晶性アラニン(赤)とアラニン-パラフィン混合物(青)の水とアラニン間の阻止能比を、正規化された深さ曲線(黒)に沿って上部パネルに示しています。下部パネルでは、阻止能比の結晶性アラニンからの相対偏差(黒)をパーセンテージで示しています。SOBPの遠位端で結晶性アラニンの阻止能比が最大で1.041でした。
Table 3. Table 3: Parameters of the analytic fits of the water-to-medium stopping-power ratios shown in figures 3 and 4 for the water-to-medium stopping-power ratios for the crystalline alanine and the alanine-paraffin mixture in the mono- energetic 429 MeV/u 12C beam and the SOBP.解説: 図3および図4に示されている水と媒質間の阻止能比の解析的フィットのパラメーターを示しています。単一エネルギー429 MeV/u炭素イオンビームとSOBPにおける、結晶性アラニンおよびアラニン-パラフィン混合物の阻止能比に対するフィット値と95%信頼区間が記載されています。
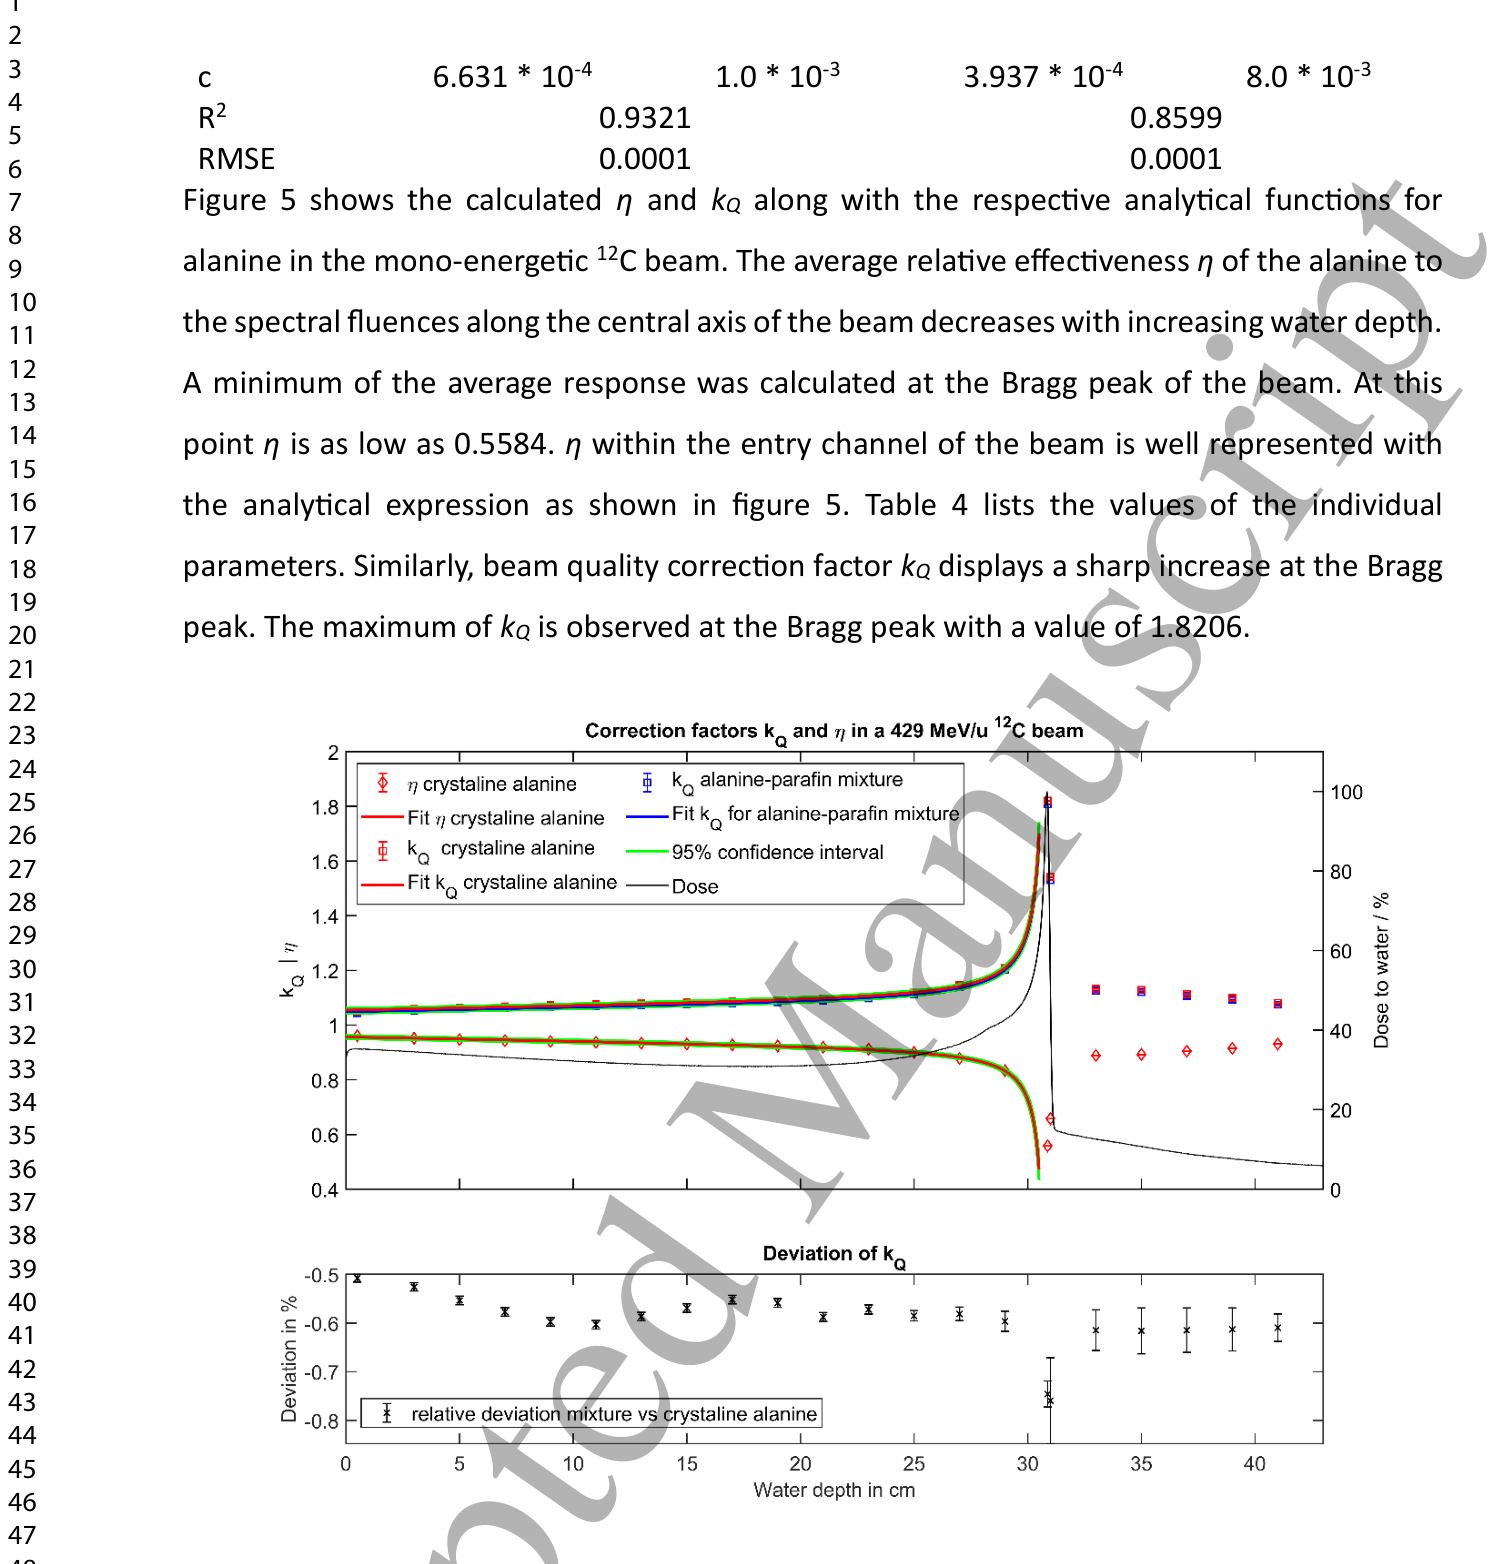
Figure 5. Figure 5: Average response η (diamonds) and the resulting beam quality correction factor kQ (squares) for crystalline alanine (red) and an alanine-paraffin mixture (blue) along the normalized depth curve of the 12C 429 MeV/u beam(black) in the top panel.解説: 単一エネルギー429 MeV/uの炭素イオンビームにおける、結晶性アラニン(赤)とアラニン-パラフィン混合物(青)の平均応答η(ひし形)と結果として得られるビーム品質補正因子kQ(四角)を、正規化された深さ曲線(黒)に沿って上部パネルに示しています。下部パネルでは、kQの相対偏差をパーセンテージで示しています。
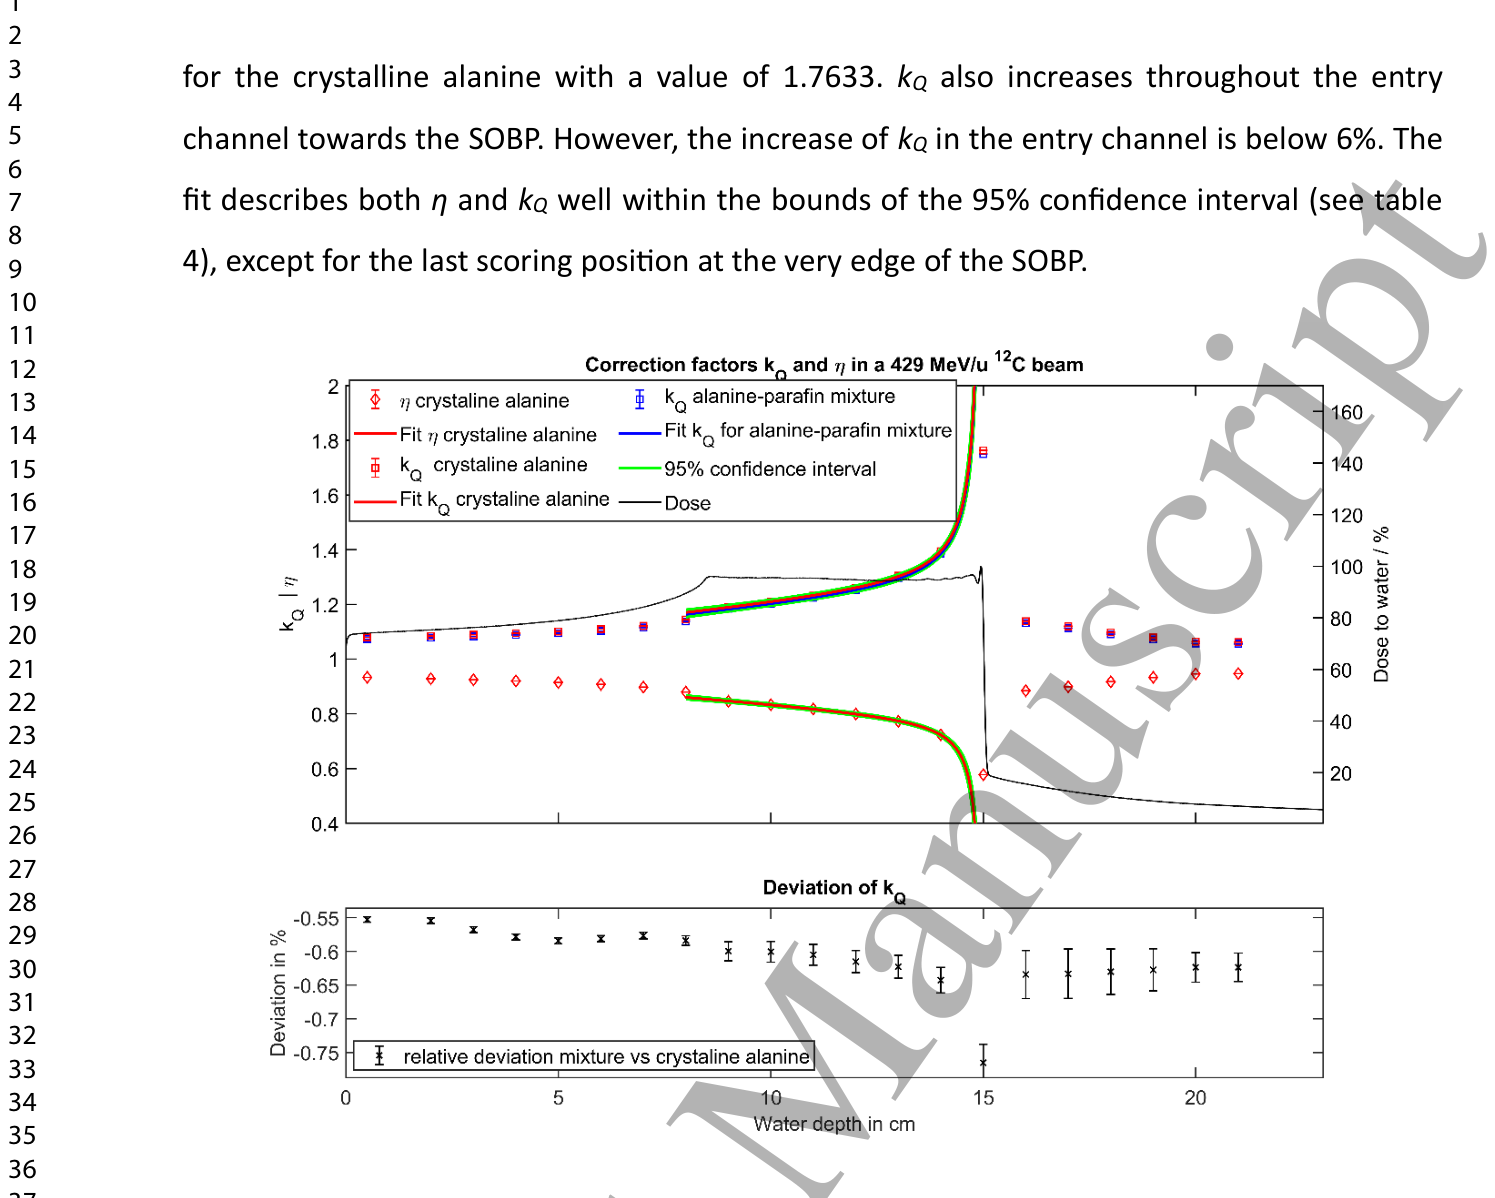
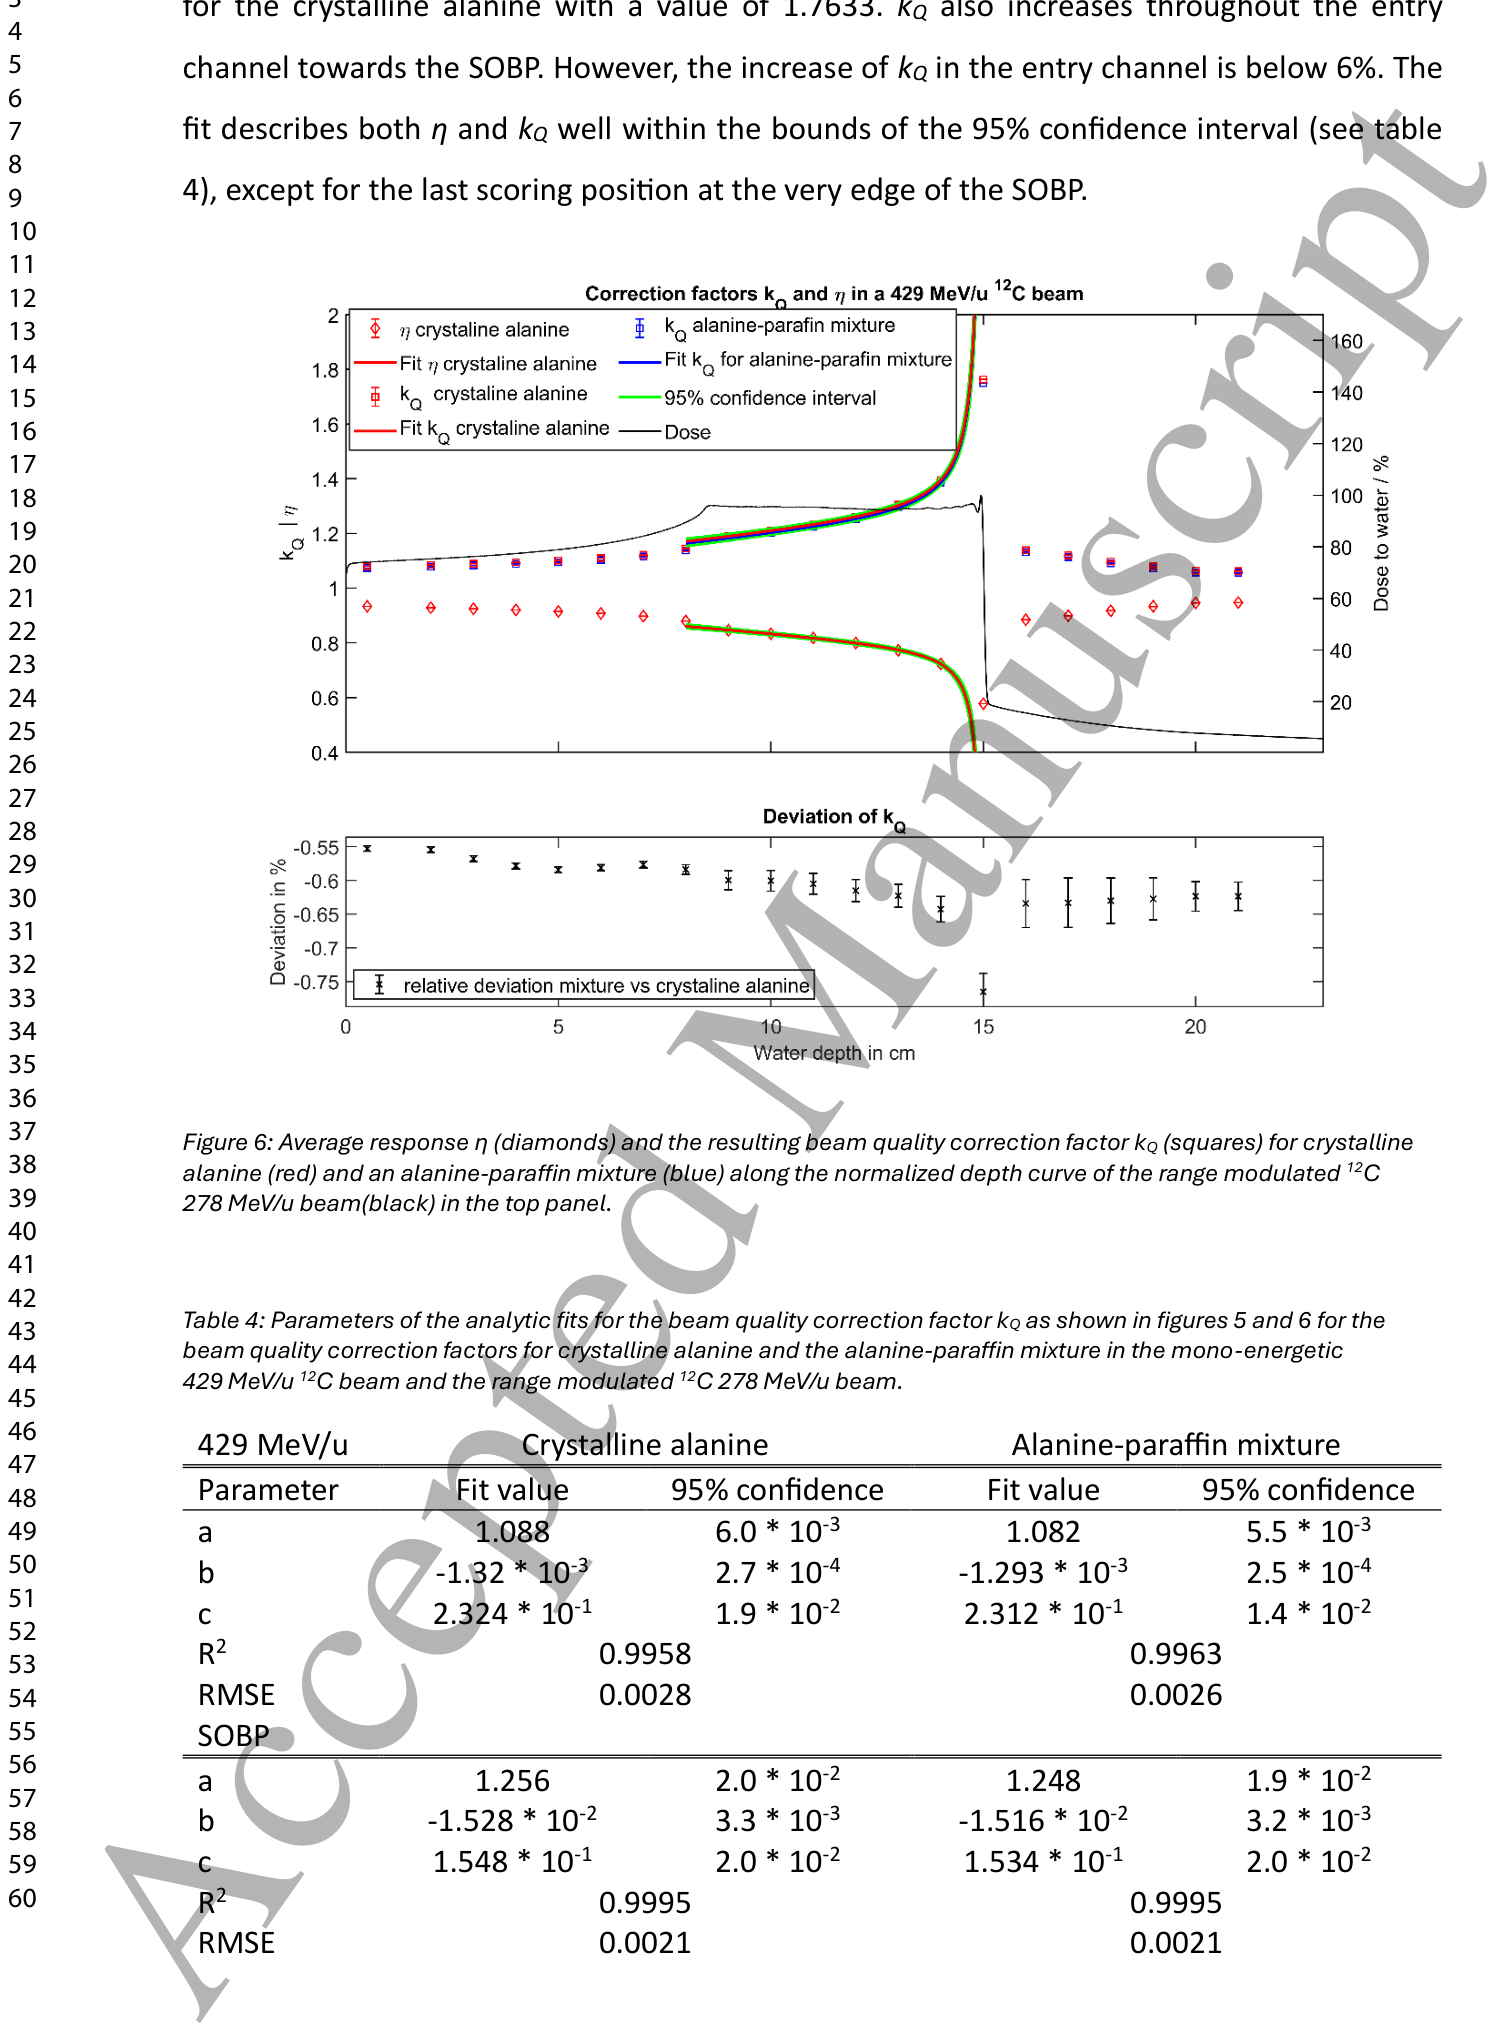
Figure 6. Figure 6: Average response η (diamonds) and the resulting beam quality correction factor kQ (squares) for crystalline alanine (red) and an alanine-paraffin mixture (blue) along the normalized depth curve of the range modulated 12C 278 MeV/u beam(black) in the top panel.解説: レンジ変調された278 MeV/uの炭素イオンビームにおける、結晶性アラニン(赤)とアラニン-パラフィン混合物(青)の平均応答η(ひし形)と結果として得られるビーム品質補正因子kQ(四角)を、正規化された深さ曲線(黒)に沿って上部パネルに示しています。下部パネルでは、kQの相対偏差をパーセンテージで示しています。
は、レンジ変調された炭素イオンビームにおけるこれらの値の深さ方向の変化を示しています。
Table 4. Table 4: Parameters of the analytic fits for the beam quality correction factor kQ as shown in figures 5 and 6 for the beam quality correction factors for crystalline alanine and the alanine-paraffin mixture in the mono-energetic 429 MeV/u 12C beam and the range modulated 12C 278 MeV/u beam.解説: 図5および図6に示されているビーム品質補正因子kQの解析的フィットのパラメーターを示しています。単一エネルギー429 MeV/u炭素イオンビームとレンジ変調278 MeV/u炭素イオンビームにおける、結晶性アラニンおよびアラニン-パラフィン混合物のビーム品質補正因子kQに対するフィット値と95%信頼区間が記載されています。
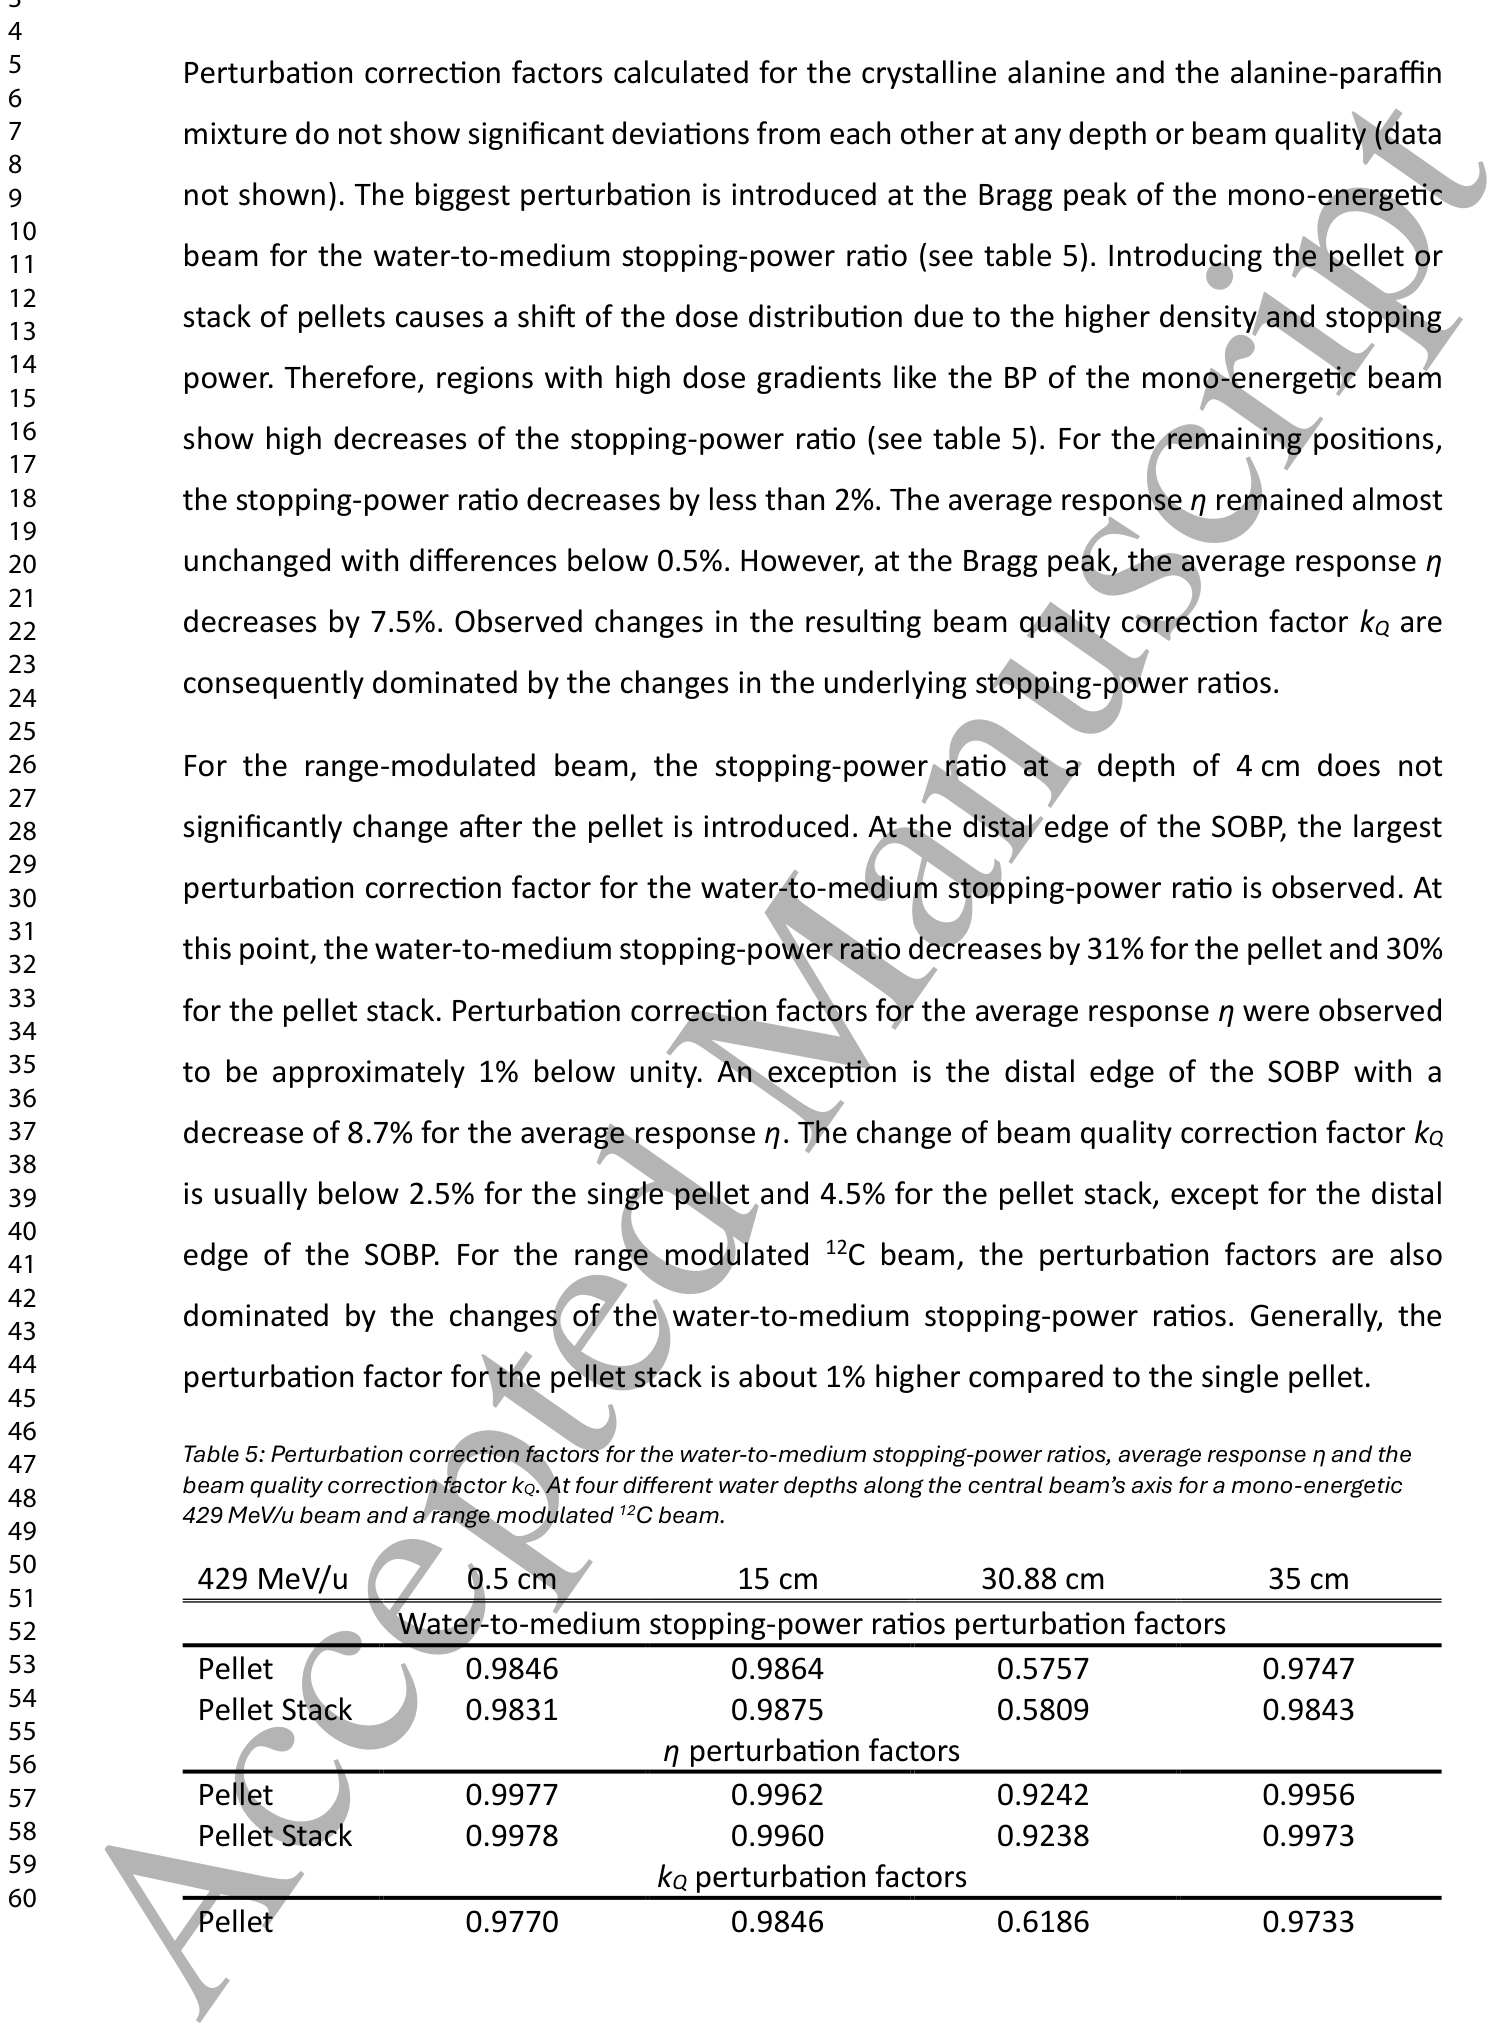
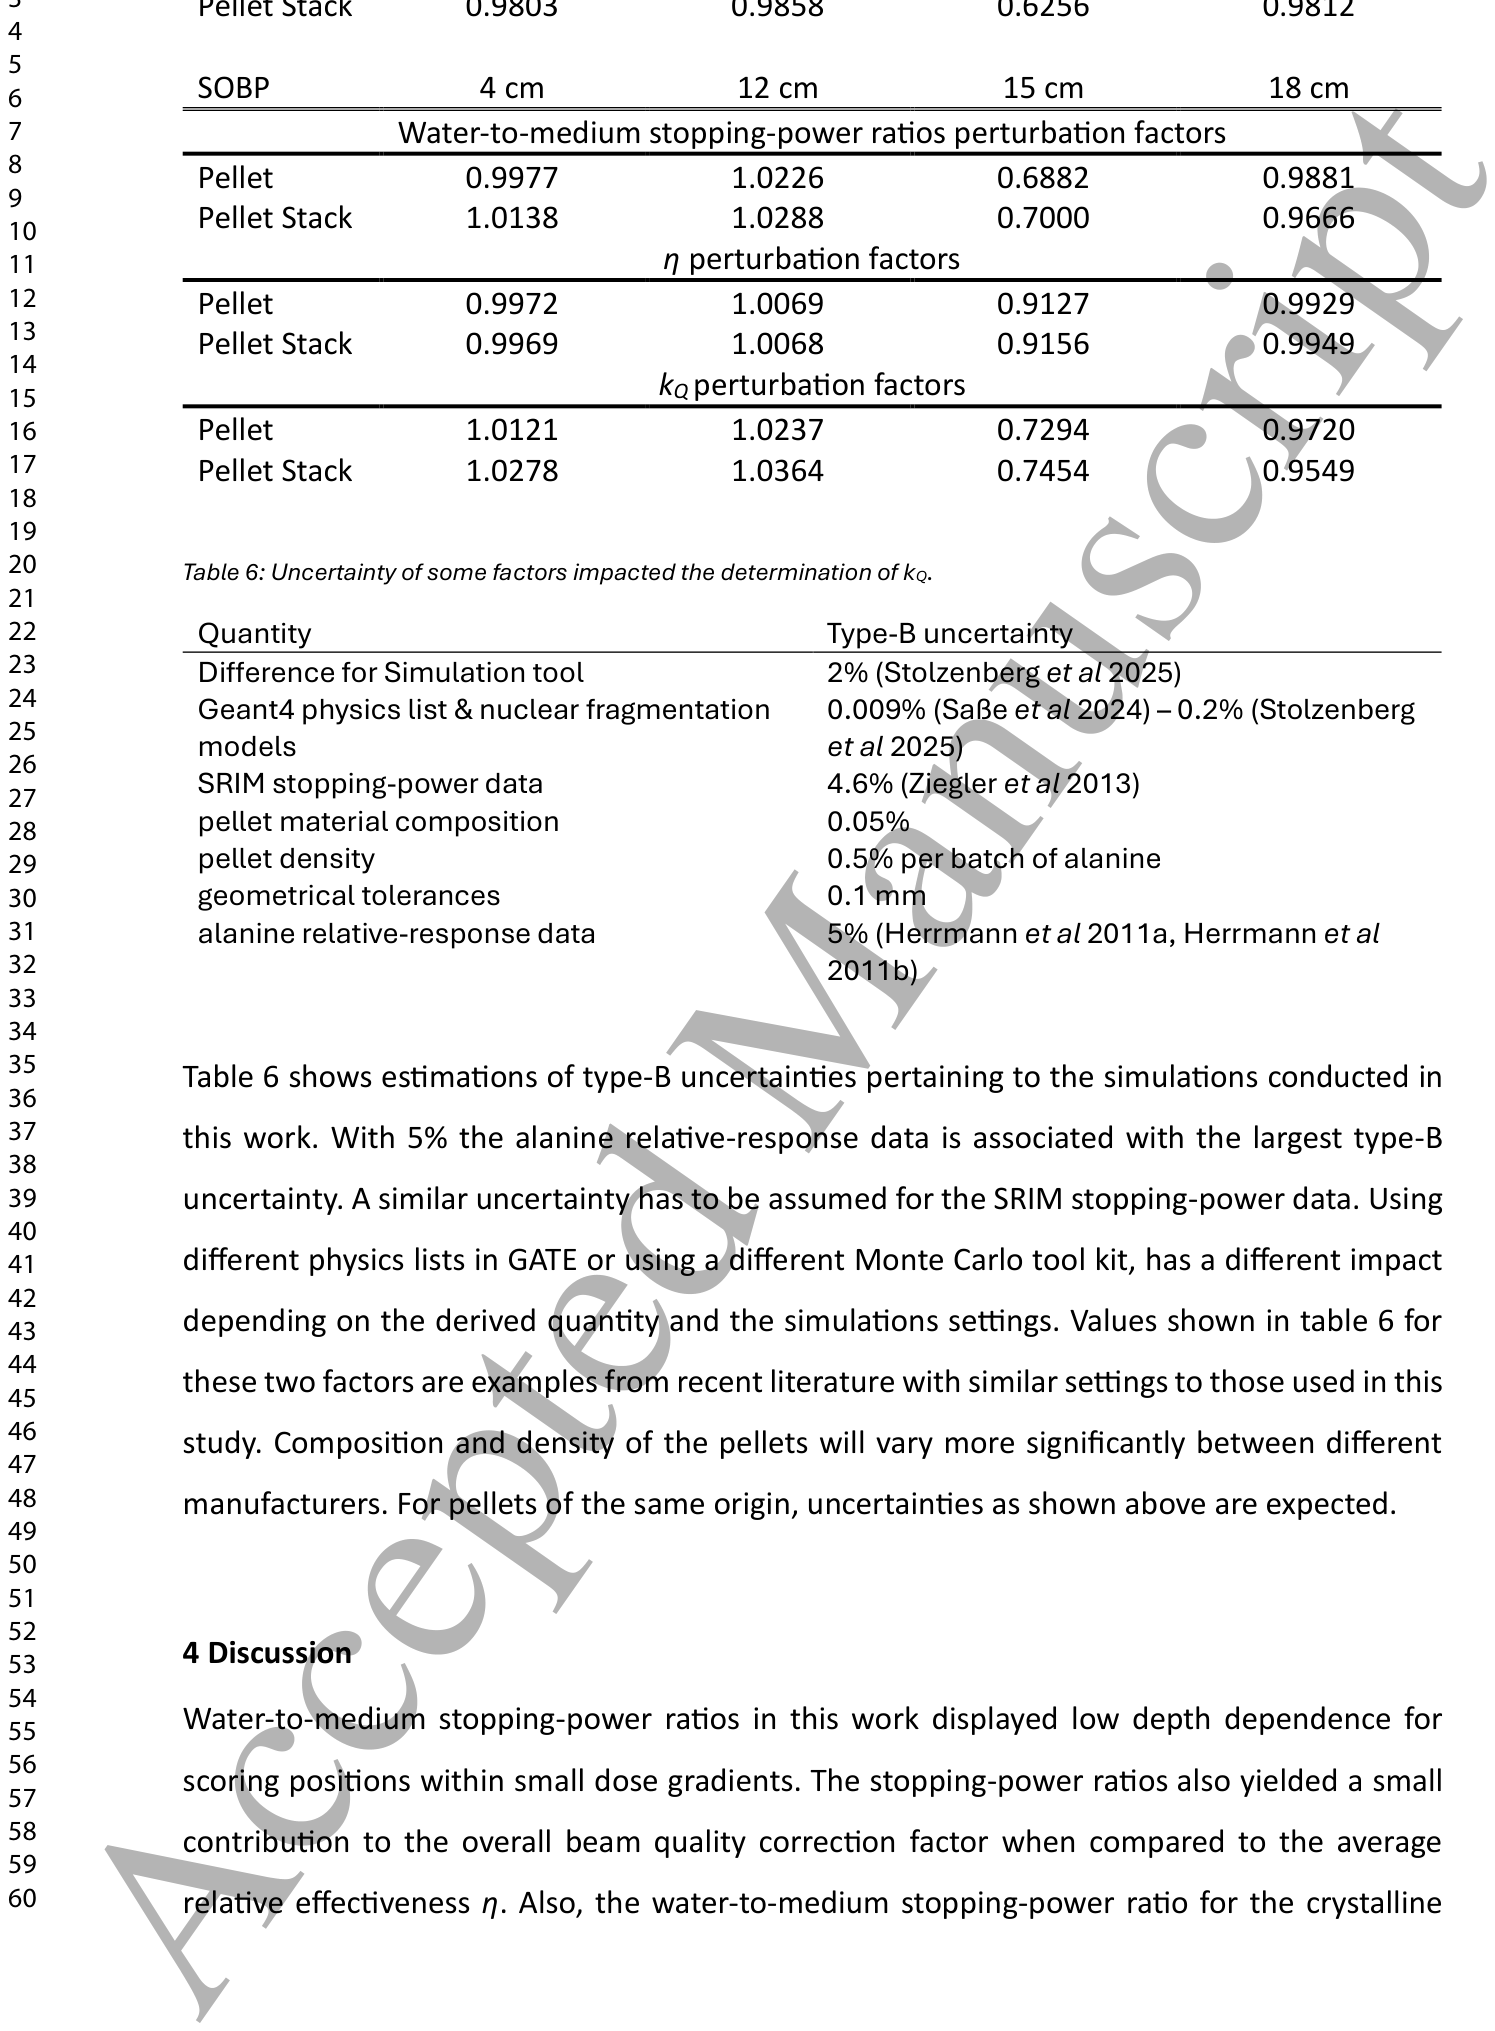
Table 5. Table 5: Perturbation correction factors for the water-to-medium stopping-power ratios, average response η and the beam quality correction factor kQ. At four different water depths along the central beam’s axis for a mono-energetic 429 MeV/u beam and a range modulated 12C beam.解説: 水と媒質間の阻止能比、平均応答η、およびビーム品質補正因子kQの摂動補正因子を示しています。単一エネルギー429 MeV/uビームとレンジ変調炭素イオンビームの異なる水深における値が、単一ペレットとペレットスタックそれぞれについて記載されています。
Table 6. Table 6: Uncertainty of some factors impacted the determination of kQ.解説: kQの決定に影響を与えるいくつかの因子のタイプB不確実性(Systematic Uncertainty)の推定値を示しています。シミュレーションツール間の差異、Geant4物理リスト、SRIM阻止能データ、ペレット材料組成、密度、幾何学的許容誤差、アラニン相対応答データなどが含まれます。
コメントを残す