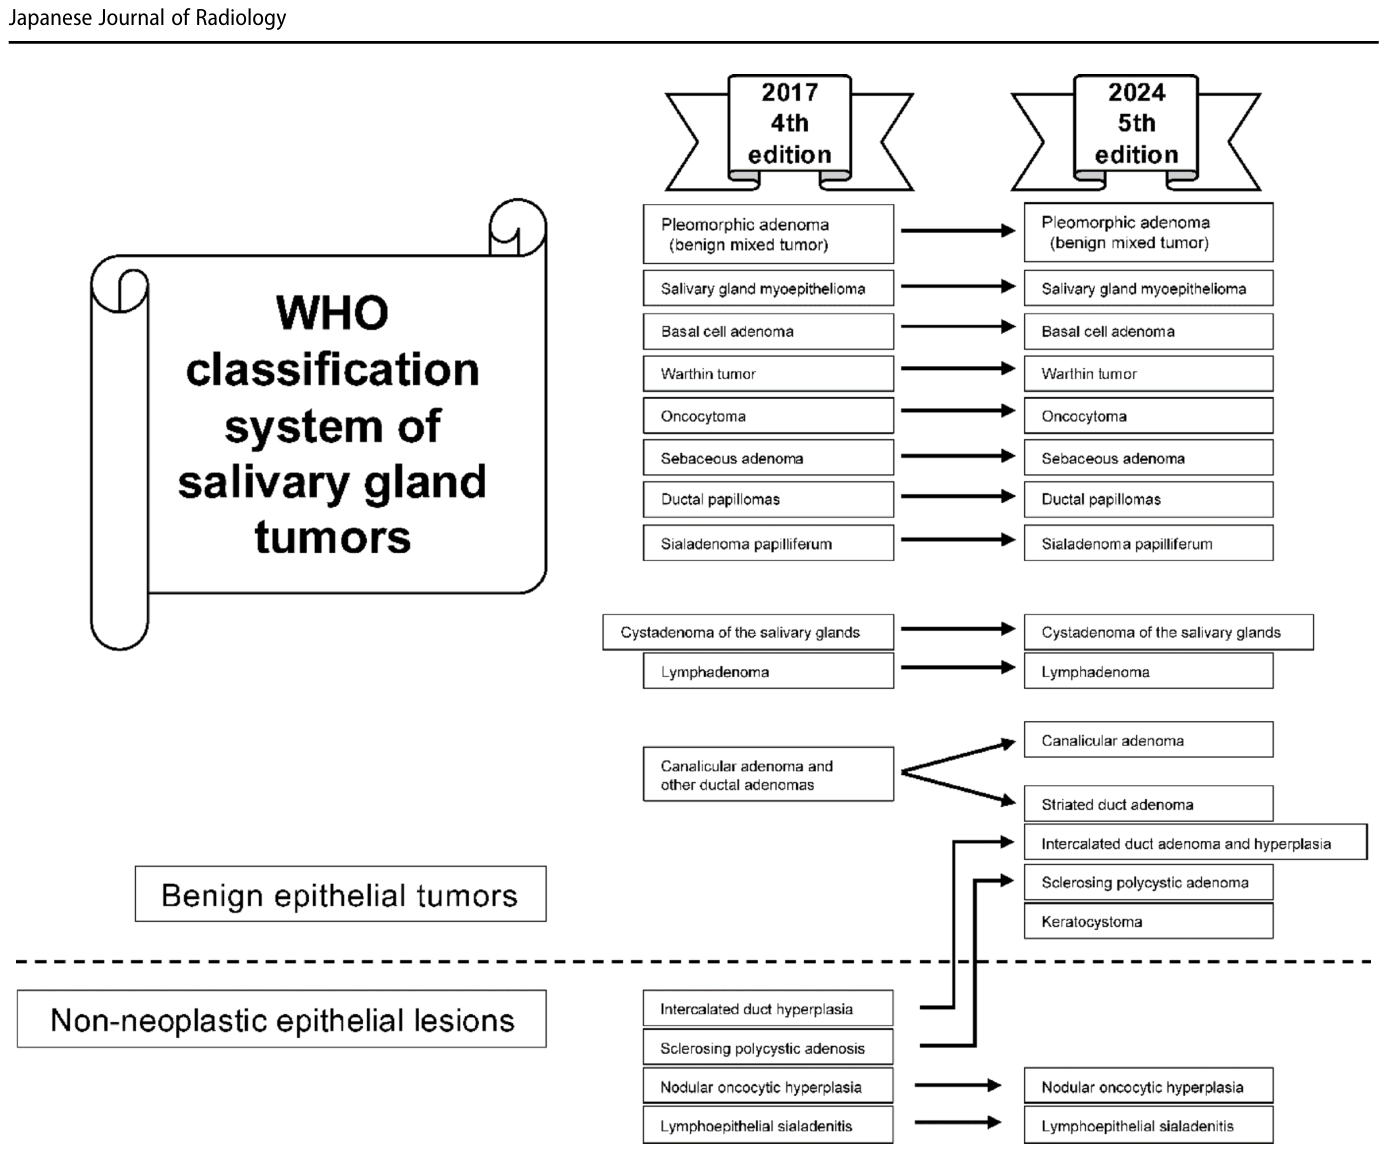
Figure 1. Fig. 1 Changes in the WHO classification of salivary gland tumors from the fourth edition to the fifth edition. The diagram illustrates changes in tumor entities from the fourth edition (published in 2017) to解説: 本図は、WHO唾液腺腫瘍分類の第4版(2017年発行)から第5版(2024年発行)への腫瘍分類の変化を示しています。特に、良性上皮性腫瘍の項目において、非腫瘍性上皮性病変から移行した疾患や、新規にリストされた疾患の追加が確認できます。
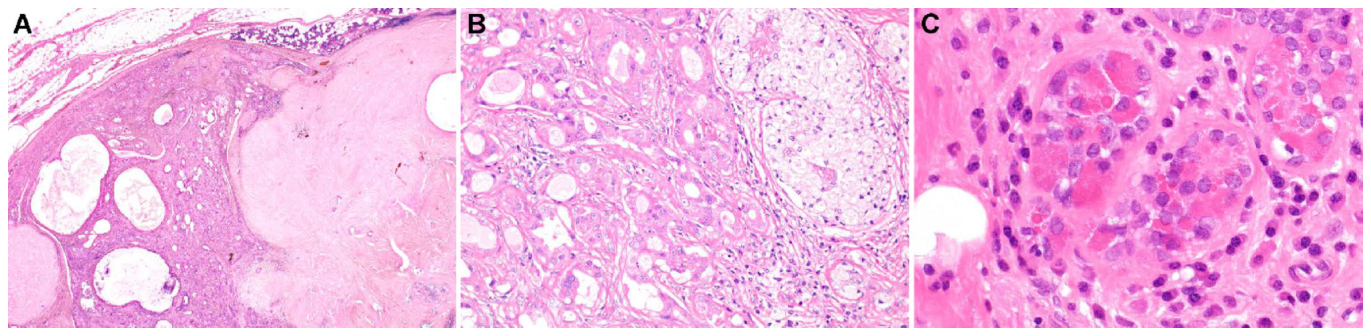
Figure 2. Fig. 2 Histopathology of sclerosing polycystic adenoma. a Low-power hematoxylin and eosin (H&E) staining shows a well-defined tumor with extensive stromal fibrosis and hyalinization. b Medium-power H&E staining shows cystically dilated ducts lined by cells with diverse cytologic appearances, including eosinophilic and foamy changes. c High-power H&E staining shows acinar cells containing coarse hyper-解説: 本図は、硬化性多嚢胞性腺腫の組織病理学的所見を示しています。aは低倍率のヘマトキシリン・エオジン(H&E)染色像で、広範な間質線維化と硝子化を伴う境界明瞭な腫瘍を示します。bは中倍率のH&E染色像で、好酸性および泡沫状の変化を含む多様な細胞学的外観を持つ細胞に裏打ちされた嚢胞状に拡張した導管を示します。cは高倍率のH&E染色像で、粗大な好酸性顆粒を含む腺房細胞を示しています。
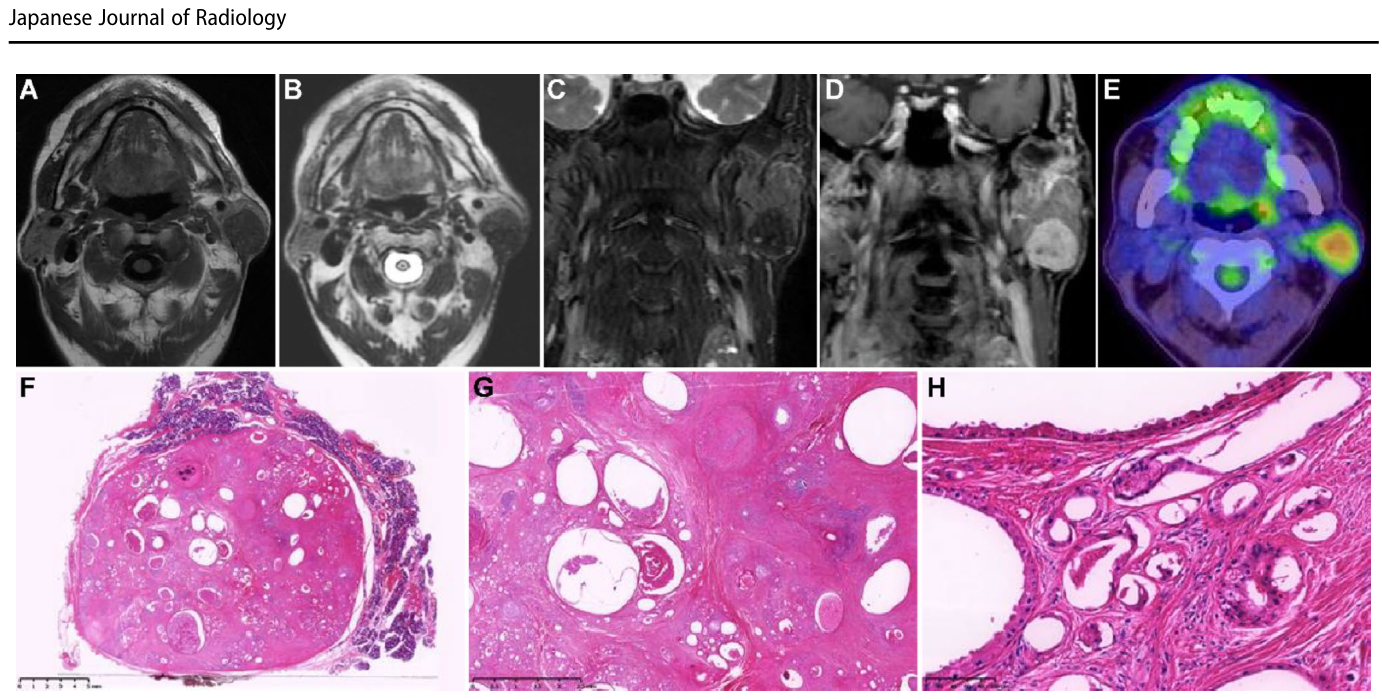
Figure 3. Fig. 3 Imaging and histopathologic findings of sclerosing polycys tic adenoma in a man in his 60 s. a T1-weighted MR image shows a mass with lower signal intensity than the surrounding parotid tissue. b T2-weighted MR image shows a mass with lower signal intensity than the surrounding parotid tissue. c Fat-suppressed coronal T2-weighted MR image shows a mass with lower signal intensity than the surround ing parotid tissue, with a tiny cyst visible as a small hyperintense focus. d Contrast-enhanced coronal MR image shows marked enhancement, with persistent nonenhancement of the tiny cyst. e FDG-PET/CT shows increased FDG uptake in the mass (SUVmax, 4.57). f Low- magnification view shows a well-defined 27 × 23-mm tumor in the left解説: 本図は、60代男性の硬化性多嚢胞性腺腫の画像および組織病理学的所見を示しています。aはT1強調MR画像で、周囲の耳下腺組織よりも低信号の腫瘤を示します。bはT2強調MR画像で、周囲の耳下腺組織よりも低信号の腫瘤を示します。cは脂肪抑制冠状T2強調MR画像で、周囲の耳下腺組織よりも低信号の腫瘤と、小さな高信号病変として見える微小嚢胞を示します。dは造影後冠状MR画像で、微小嚢胞の非造影域を除き著明な造影効果を示します。eはFDG-PET/CTで、腫瘤内でのFDG取り込み増加(SUVmax 4.57)を示します。fは低倍率像で、左耳下腺内に様々なサイズの嚢胞性空間と間質線維化または硬化を伴う境界明瞭な27×23mmの腫瘍を示します(H&E染色)。gは低倍率H&E染色像で、密な膠原線維性および硬化性間質に囲まれた様々なサイズの嚢胞状に拡張した導管を示します。hは高倍率H&E染色像で、アポクリン変性を伴う上皮細胞に裏打ちされた拡張した導管を示します。
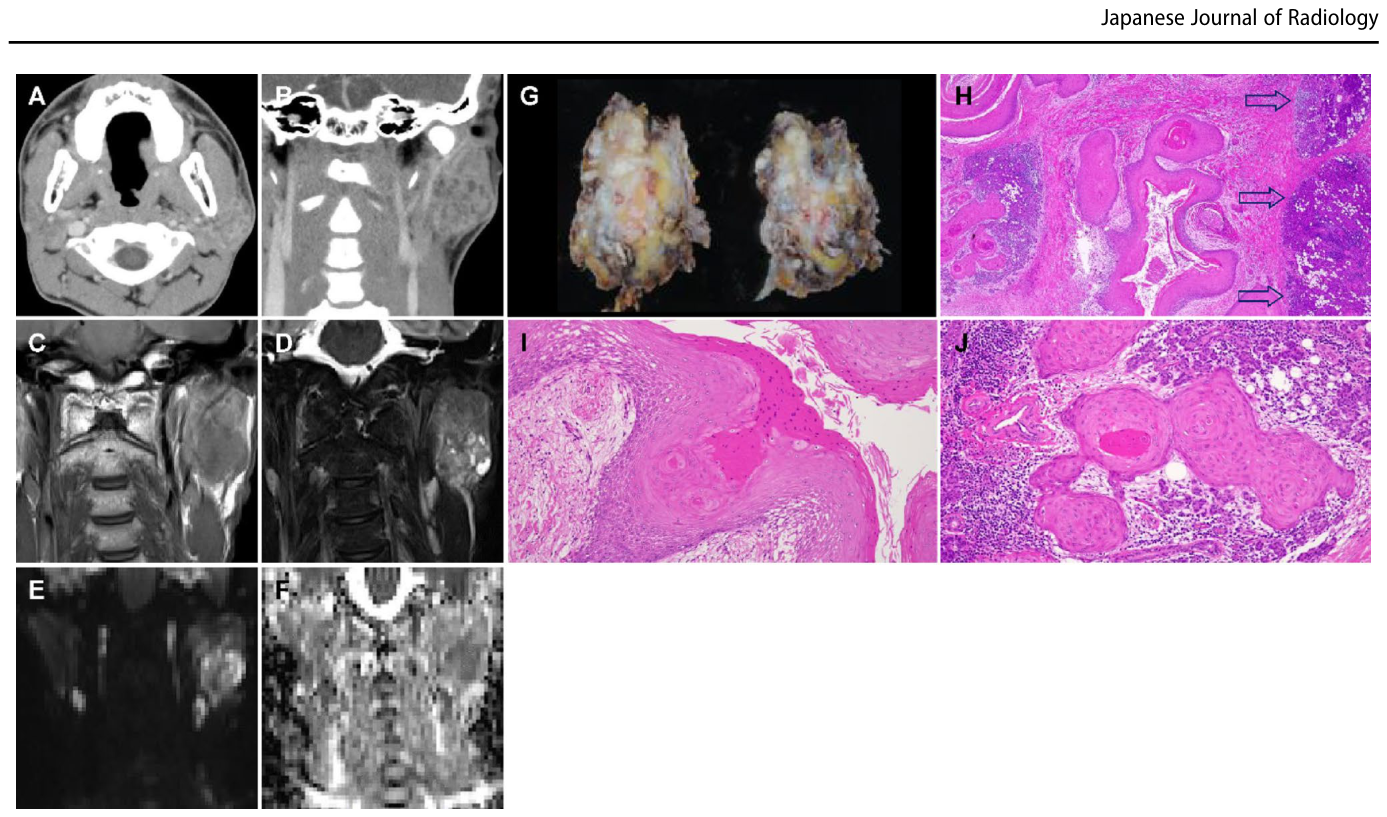
Figure 4. Fig. 4 Imaging and histopathologic findings of keratocystoma in a teenage boy. a Contrast-enhanced axial CT image shows multiple ring- like enhancing foci within the mass. b Contrast-enhanced coronal CT image also shows ring-like enhancing foci within the mass. c Coronal T1-weighted MR image shows a mass with lower signal intensity than the surrounding parotid tissue. The boundary of the mass is ill-defined. No visible capsule is seen. d Fat-suppressed coronal T2-weighted MR image shows a mass with heterogeneous low-to-high signal intensity relative to the surrounding parotid tissue. Small cyst-like hyperintense structures are present within the lesion. The boundary of the mass is ill-defined. No visible capsule is seen. e Coronal diffusion-weighted MR image shows a mass with heterogeneous slightly high signal inten sity. f The ADC value of the mass is 1.01 × 10⁻³ mm2/s on the ADC map. g Formalin-fixed specimen shows a white-to-gray cut surface. h Low-power H&E staining shows variably sized and shaped nests of keratinizing squamous epithelium embedded in fibrous stroma. Cystic spaces filled with lamellated keratin are also present in the central por tion of the tumor nests. The boundary with the surrounding parotid解説: 本図は、ティーンエイジャーの角化嚢腫の画像および組織病理学的所見を示しています。aは造影後軸位CT画像で、腫瘤内に複数のリング状造影増強域を示します。bは造影後冠状CT画像でも、腫瘤内にリング状造影増強域を示します。cは冠状T1強調MR画像で、周囲の耳下腺組織よりも低信号の腫瘤を示し、腫瘤の境界は不明瞭で、被膜は視認できません。dは脂肪抑制冠状T2強調MR画像で、周囲の耳下腺組織に対して不均一な低信号から高信号の腫瘤を示し、病変内には小さな嚢胞状高信号構造が認められます。境界は不明瞭で、被膜は視認できません。eは冠状拡散強調MR画像で、不均一なわずかに高信号の腫瘤を示します。fはADCマップ上で、腫瘤のADC値が1.01×10^-3 mm2/sであることを示します。gはホルマリン固定標本で、白から灰色の割面を示します。hは低倍率H&E染色像で、線維性間質に埋め込まれた様々なサイズと形状の角化重層扁平上皮の巣を示します。腫瘍巣の中心部には層状角質で満たされた嚢胞性空間も認められ、周囲の耳下腺組織との境界は明瞭ですが、被膜は存在しません。iは高倍率H&E染色像で、重層扁平上皮に裏打ちされた嚢胞性空間が、副角化を伴い顆粒層を欠く良好な分化を示します。jは高倍率H&E染色像で、基底膜が保たれた単一の扁平上皮細胞巣を示します。
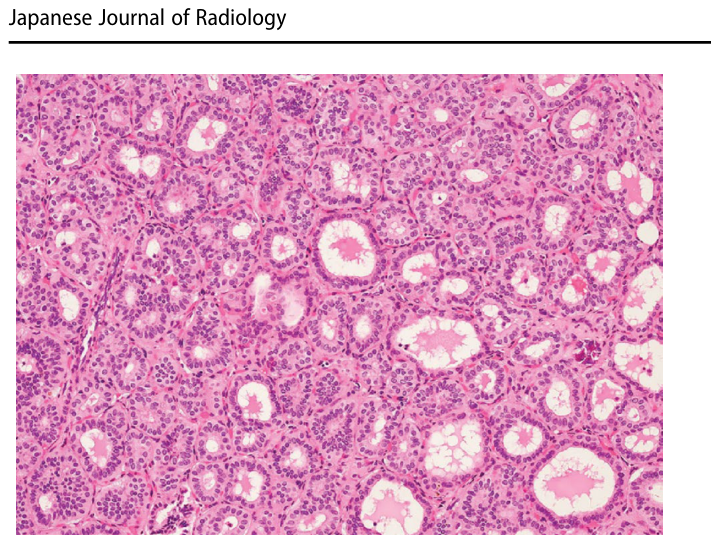
Figure 5. Fig. 5 Histopathology of striated duct adenoma. H&E staining shows tumor cells with eosinophilic cytoplasm forming closely packed ducts and tubules in a back-to-back arrangement, with minimal intervening stroma. Image courtesy of Dr. Masato Nakaguro and Dr. Haruna Yagi, Department of Pathology and Laboratory Medicine, Nagoya Univer sity Graduate School of Medicine, Aichi, Japan. Adapted from the study by Yagi and Nakaguro [4]. Reproduced with permission from the publisher (Bunkodo Co., Ltd.). Abbreviations: H&E staining, hema toxylin and eosin staining解説: 本図は、線条導管腺腫の組織病理学的所見を示しています。H&E染色像では、好酸性細胞質を持つ腫瘍細胞が、最小限の間質を伴い、密に集合した導管や細管を形成している様子が観察されます。
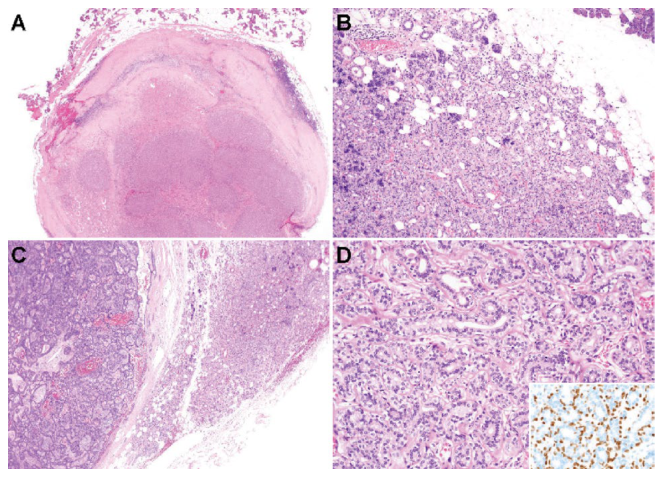
Figure 6. Fig. 6 Histopathology of intercalated duct adenoma and hyperplasia. a Intercalated duct adenoma (IDA) appears as a well-defined nodu lar lesion on hematoxylin and eosin (H&E) staining. b Intercalated duct hyperplasia (IDH) lacks a capsule and intermingles with normal salivary gland tissue on H&E staining. c H&E staining shows IDH on the right, adjacent to basal cell adenoma on the left. d H&E staining shows dense proliferation of small-caliber ducts composed of cuboi dal epithelial cells. The surrounding myoepithelial cells are difficult to identify on routine H&E staining. The inset shows p63 immunostain ing highlighting myoepithelial cells around all ducts. Image courtesy of Dr. Masato Nakaguro and Dr. Haruna Yagi, Department of Pathol ogy and Laboratory Medicine, Nagoya University Graduate School of Medicine, Aichi, Japan. Adapted from the study by Yagi and Nakaguro [4]. Reproduced with permission from the publisher (Bunkodo Co., Ltd.)解説: 本図は、介在導管腺腫および過形成の組織病理学的所見を示しています。aは介在導管腺腫(IDA)がH&E染色で境界明瞭な結節性病変として現れる様子を示します。bは介在導管過形成(IDH)がH&E染色で被膜を欠き、正常な唾液腺組織と混在する様子を示します。cはH&E染色で右側にIDH、左側に基底細胞腺腫が隣接している様子を示します。dはH&E染色で、立方状上皮細胞からなる細い導管が密に増殖している様子を示します。周囲の筋上皮細胞は通常のH&E染色では識別が困難ですが、挿入図のp63免疫染色ではすべての導管周囲の筋上皮細胞が強調されています。


コメントを残す