どうも、Beyond the Pixelです。線維性間質性肺疾患(ILD)は、肺の線維化が進行し、呼吸機能の低下や早期死亡につながる可能性のある難病です。この疾患のモニタリングには、定期的なCT検査が中心的な役割を果たしますが、視覚的な評価は専門家の経験に依存し、変化が微妙な場合には困難を伴うことがあります。今回ご紹介する研究は、「Japanese Journal of Radiology」に掲載されたもので、ディープラーニングを活用した定量的CTシステムを用いて、線維性病変と正常肺容量の経時的変化を測定し、その変化が死亡率、急性増悪、および肺機能低下とどのように関連するかを評価しました。これは、線維性ILDの進行を客観的に評価する新たな手がかりとなる重要な研究です。
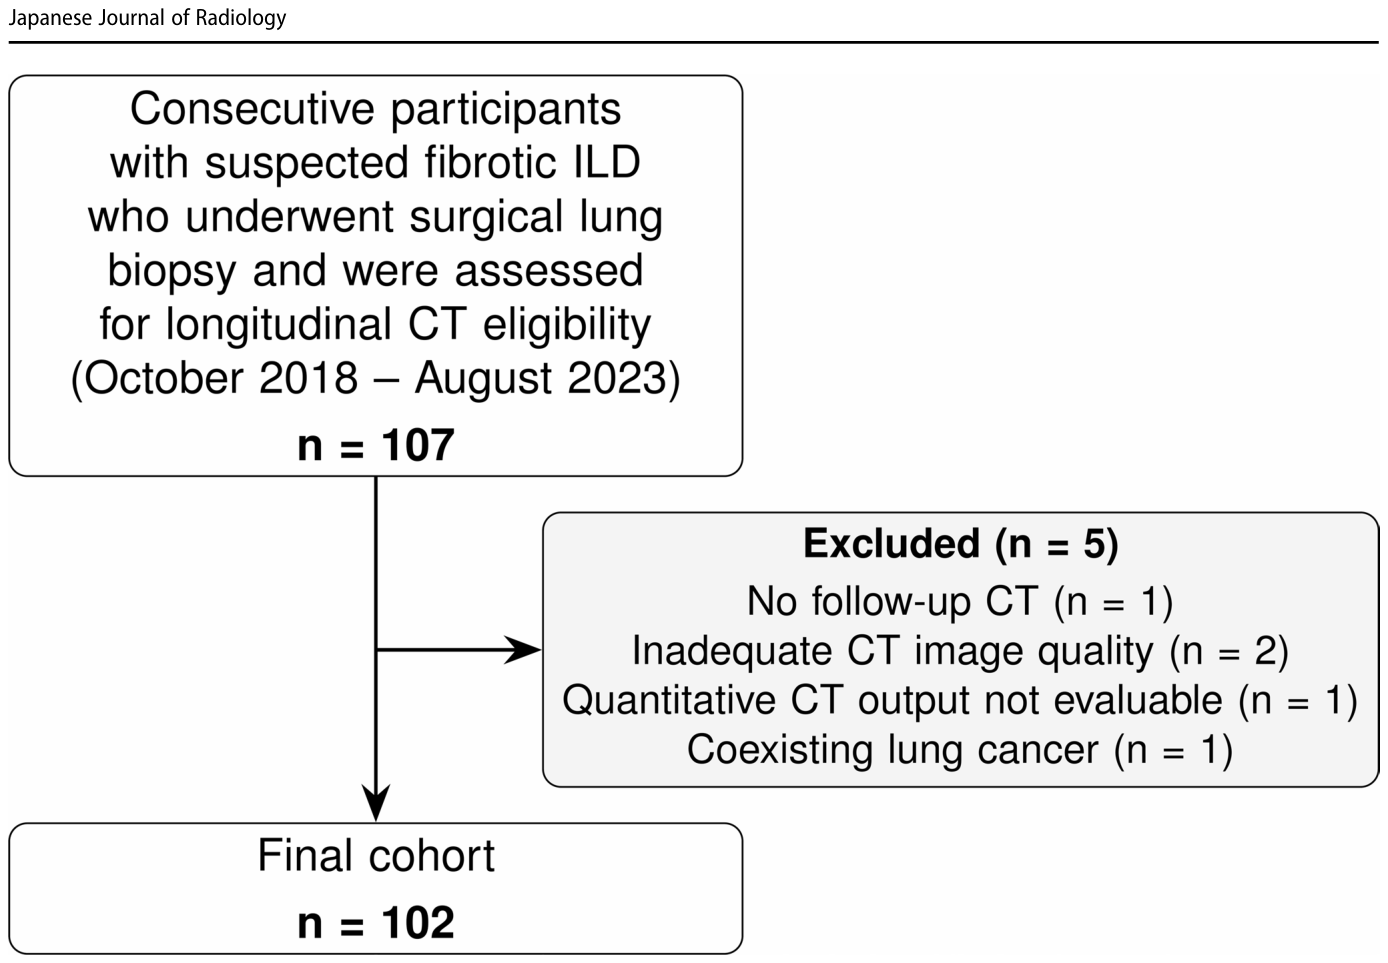
Figure 1. Fig. 1 Study flowchart. The diagram summarizes eligibility assess ment and formation of the final cohort. Of 107 participants assessed for the longitudinal CT cohort, five were excluded: no follow-up CT解説: 本図は、研究のフローチャートを示しており、適格性評価から最終的なコホートが形成されるまでの過程がまとめられています。線維性間質性肺疾患が疑われ、外科的肺生検を受け、縦断的CTの適格性が評価された107名の対象者のうち、5名が除外され、最終的に102名が研究対象となりました。
に示されており、研究の全体像とCT解析のワークフローは
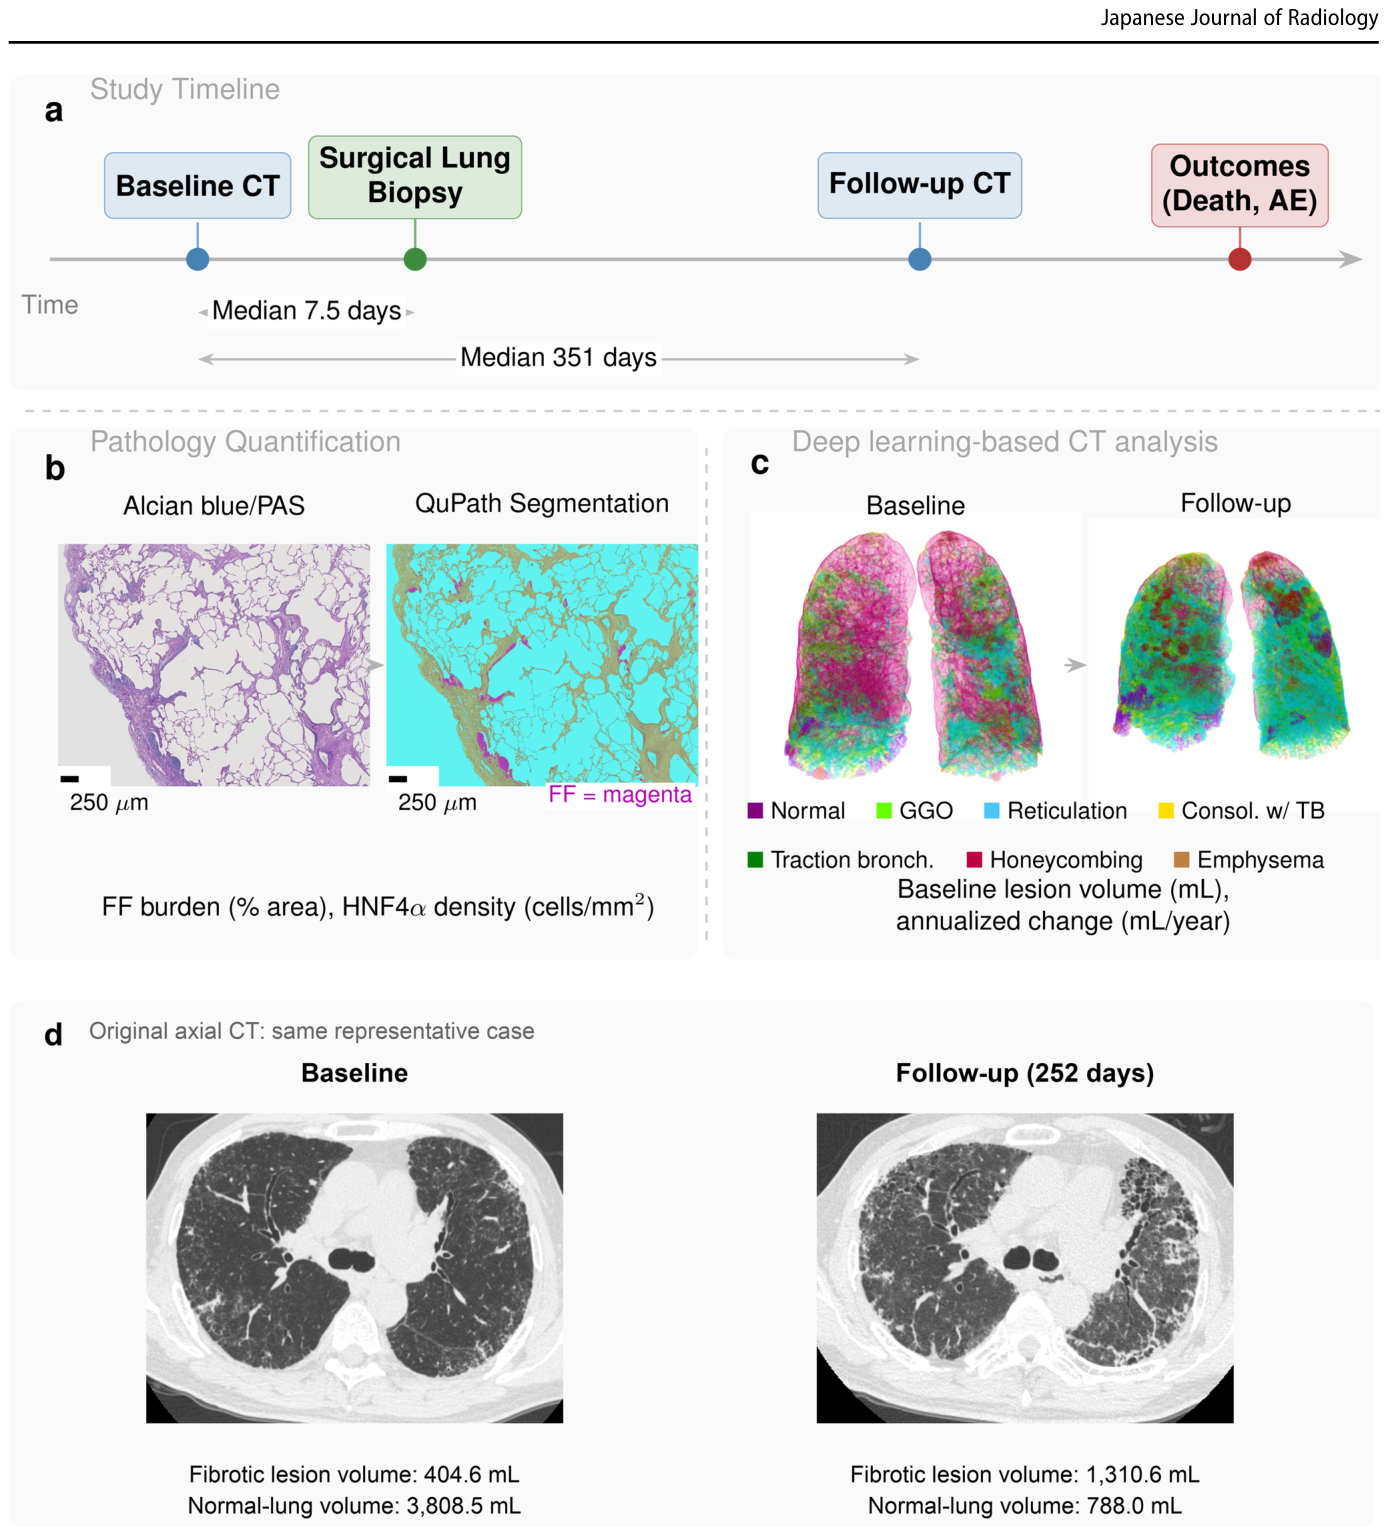
Figure 2. Fig. 2 Study overview and representative quantitative CT workflow. a Study timeline. The baseline CT-to-surgical lung biopsy interval (median, 7.5 days; interquartile range, 5.0–15.0 days) and baseline-to- follow-up CT interval (median, 351 days) summarize the full cohort. b Representative Alcian blue/PAS-stained pathology image and QuPath segmentation; scale bars indicate 250 μm. c Three-dimensional quan titative CT displays at baseline and follow-up. d Original axial CT images from the same participant as in (c), at comparable levels near the carina, displayed with the same lung window (level, − 600 HU;解説: 本図は、研究の概要と代表的な定量的CTワークフローを示しています。(a)研究のタイムラインでは、ベースラインCTから外科的肺生検までの中央期間が7.5日、ベースラインからフォローアップCTまでの中央期間が351日であることが示されています。(b)病理組織像の定量的解析の例として、アルシアンブルー/PAS染色された画像とQuPathによるセグメンテーションが示されています。(c)ディープラーニングに基づくCT解析による3次元表示では、ベースラインとフォローアップにおける線維性病変と正常肺の体積変化が色分けされて示されています。(d)代表的な対象者の軸位CT画像がベースラインとフォローアップで比較されており、線維性病変容量の増加と正常肺容量の減少が確認できます。
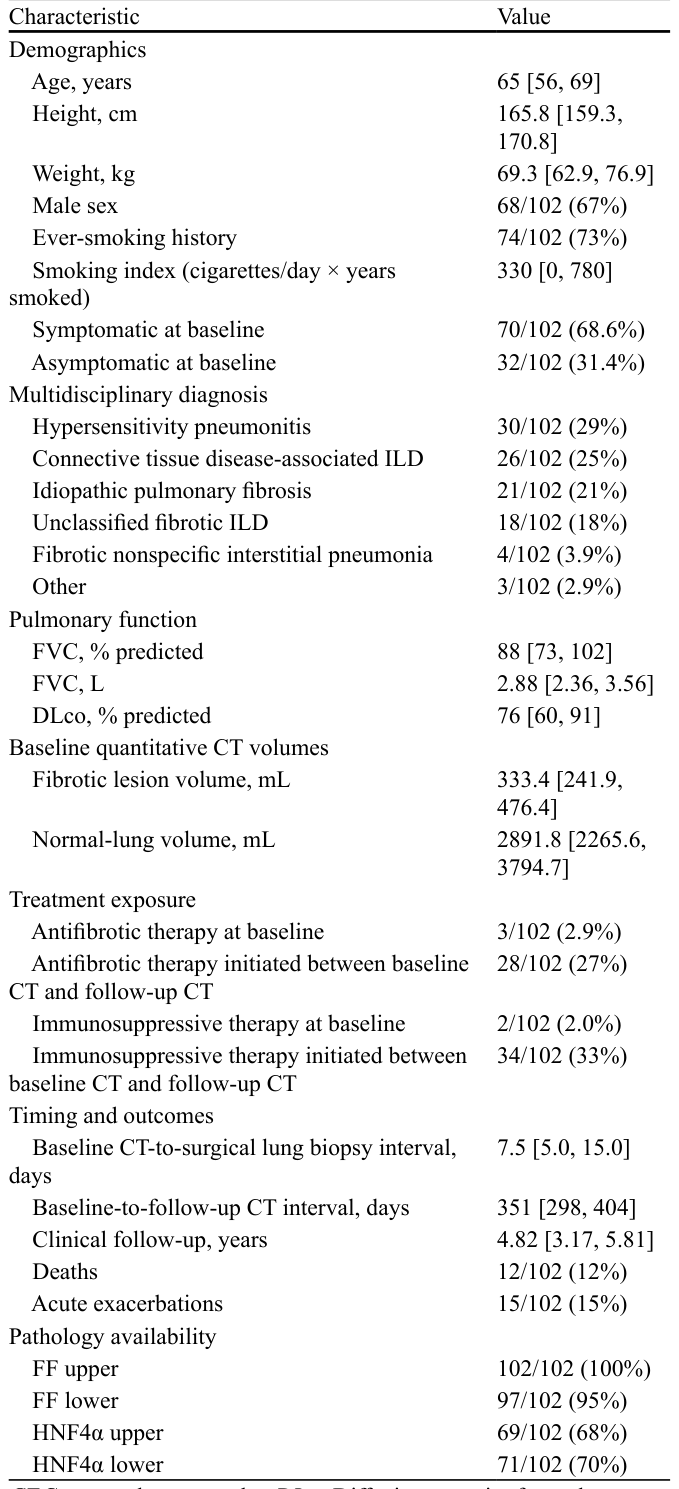
Table 1. Table 1 Baseline cohort characteristics. Values are median [interquar tile range] or number/total (%). DLco was available in 87 participants Characteristic Value Demographics Age, years 65 [56, 69] Height, cm 165.8 [159.3, 170.8] Weight, kg 69.3 [62.9, 76.9] Male sex 68/102 (67%) Ever-smoking history 74/102 (73%) Smoking index (cigarettes/day × years smoked)解説: 本表は、研究コホートのベースライン特性をまとめています。対象者の年齢、身長、体重、性別、喫煙歴、症状の有無などの人口統計学的データが示されています。また、過敏性肺炎、膠原病関連ILD、特発性肺線維症などの多分野診断の内訳、ベースラインの肺機能(FVC、DLco)、治療状況、CT検査と臨床イベントのタイミング、および発生した死亡と急性増悪の数も記載されています。
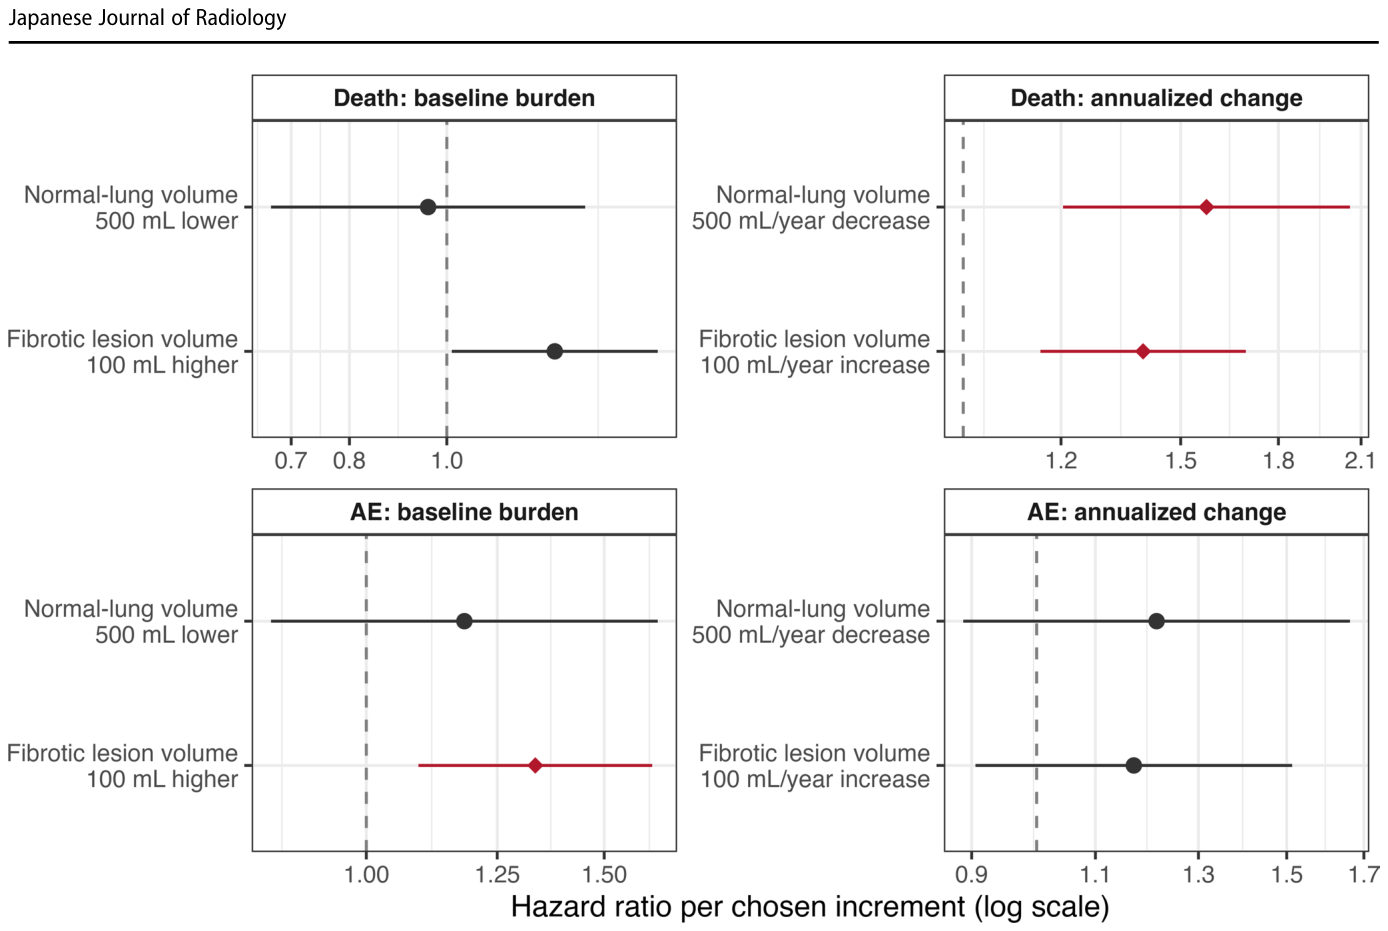
Figure 3. Fig. 3 Baseline and serial CT volume measures and clinical outcomes. Forest plots show hazard ratios per selected reporting increment for QZIP-defined fibrotic lesion volume and normal-lung volume. QZIP- defined fibrotic lesion volume was the unweighted sum of reticula tion, traction bronchiectasis, consolidation with traction bronchiec tasis, and honeycombing volumes. Baseline absolute-volume panels reflect baseline-origin models adjusted for age, sex, baseline FVC (L), and any baseline treatment. Annualized-change panels reflect follow-up-CT landmark models adjusted for age, sex, baseline FVC解説: 本図は、ベースラインおよび経時的なCT体積測定値と臨床転帰の関連をフォレストプロットで示しています。QZIP定義の線維性病変容量と正常肺容量の選択された報告単位あたりのハザード比が示されています。ベースラインの絶対容量パネルはベースラインを起点としたモデルを反映し、年間変化パネルはフォローアップCTをランドマークとしたモデルを反映しています。赤色の菱形マーカーは、Benjamini-Hochberg補正後にq値が0.05未満であることを示しています。
Table 2. Table 2 Adjusted Cox models for baseline burden and annualized change in the two quantitative CT measures. Baseline models were anchored at baseline CT and were adjusted for age, sex, baseline FVC (L), and any baseline treatment. Annualized-change models were landmarked at follow-up CT, used annualized absolute change in mL/year, and were adjusted for age, sex, baseline FVC (L), any baseline treatment, and treat ment initiated between baseline and follow-up CT. For acute-exacerbation models, death without prior acute exacerbation was censored at death. AE = acute exacerbation CT measure Death, baseline Death, annualized AE, baseline AE, annualized Fibrotic lesion volume 1.28 (1.01–1.62) q = 0.080解説: 本表は、2つの定量的CT測定値のベースライン負荷と年間変化に関する調整済みCoxモデルの結果を示しています。ベースラインモデルはベースラインCTを基準とし、年齢、性別、ベースラインFVC(L)、およびベースライン時の治療で調整されています。年間変化モデルはフォローアップCTをランドマークとし、年齢、性別、ベースラインFVC(L)、ベースライン時の治療、およびベースラインとフォローアップCTの間に開始された治療で調整されています。急性増悪モデルでは、事前の急性増悪なしに死亡した対象者は打ち切りのイベントとして扱われています。値はハザード比(95%信頼区間)およびq値で示されています。
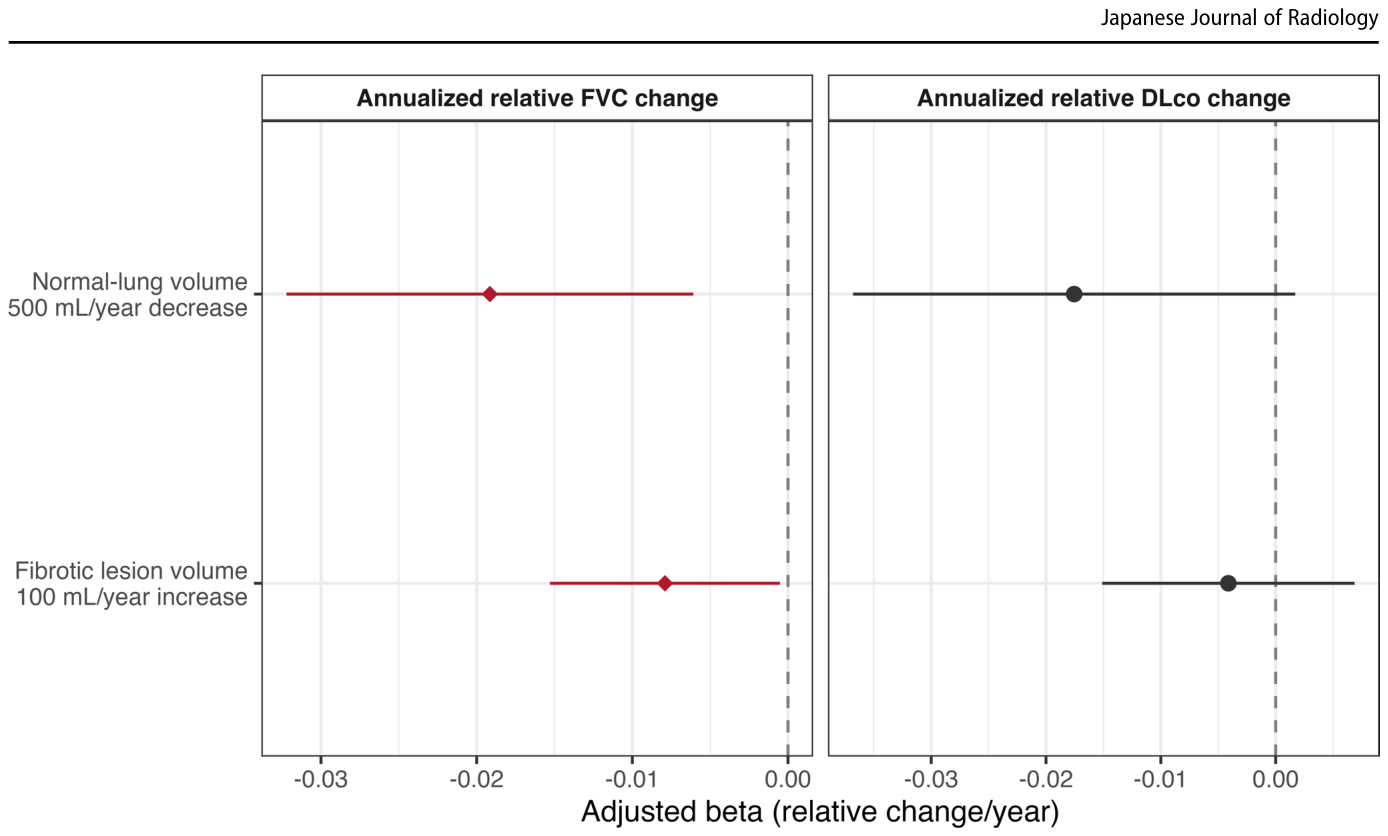
Figure 4. Fig. 4 Concurrent pulmonary function associations of serial quanti tative CT change. Forest plots show adjusted linear coefficients for annualized relative FVC and DLco change in relation to annualized fibrotic lesion change and annualized normal-lung volume loss. Nega tive coefficients indicate faster annualized pulmonary function decline. Models were adjusted for age, sex, corresponding baseline pulmonary解説: 本図は、経時的な定量的CT変化と同時期の肺機能(努力性肺活量FVCおよび一酸化炭素拡散能DLco)の関連性をフォレストプロットで示しています。調整済みの線形係数が、年間線維性病変変化と年間正常肺容量減少に対する年間相対FVCおよびDLco変化に関して示されています。負の係数は、年間肺機能の低下が速いことを意味します。赤色の菱形マーカーは、Benjamini-Hochberg補正後にq値が0.05未満であることを示しています。


コメントを残す