どうも、Beyond the Pixelです。X線イメージングは、骨と軟組織の優れた区別を提供するなど、診断医療において不可欠なツールです。しかし、従来のX線イメージングが主に吸収コントラストに依存しているため、微細な構造や組織内のわずかな変化を捉えるのが難しいという課題がありました。この限界を克服するための有望な技術として、「X線位相コントラストイメージング(XPCI)」が注目されています。XPCIは、X線が物体を通過する際に生じる位相シフトを測定することで、吸収コントラクトでは見えにくい構造を明らかにする能力があります。本日は、このXPCIの性能評価と最適化に不可欠な新しい理論的枠組みを提案した論文についてご紹介します。特に、スペクトルXPCIと伝搬ベースXPCI(PB-XPCI)という二つの先進技術を組み合わせたシステムにおける、Cramér–Rao下限(CRLB)モデルの開発に焦点を当てます。この新しいモデルは、定量的な位相情報取得や材料分解タスクにおけるシステム性能の理論的な限界を評価し、最適化するための重要な基礎となります。
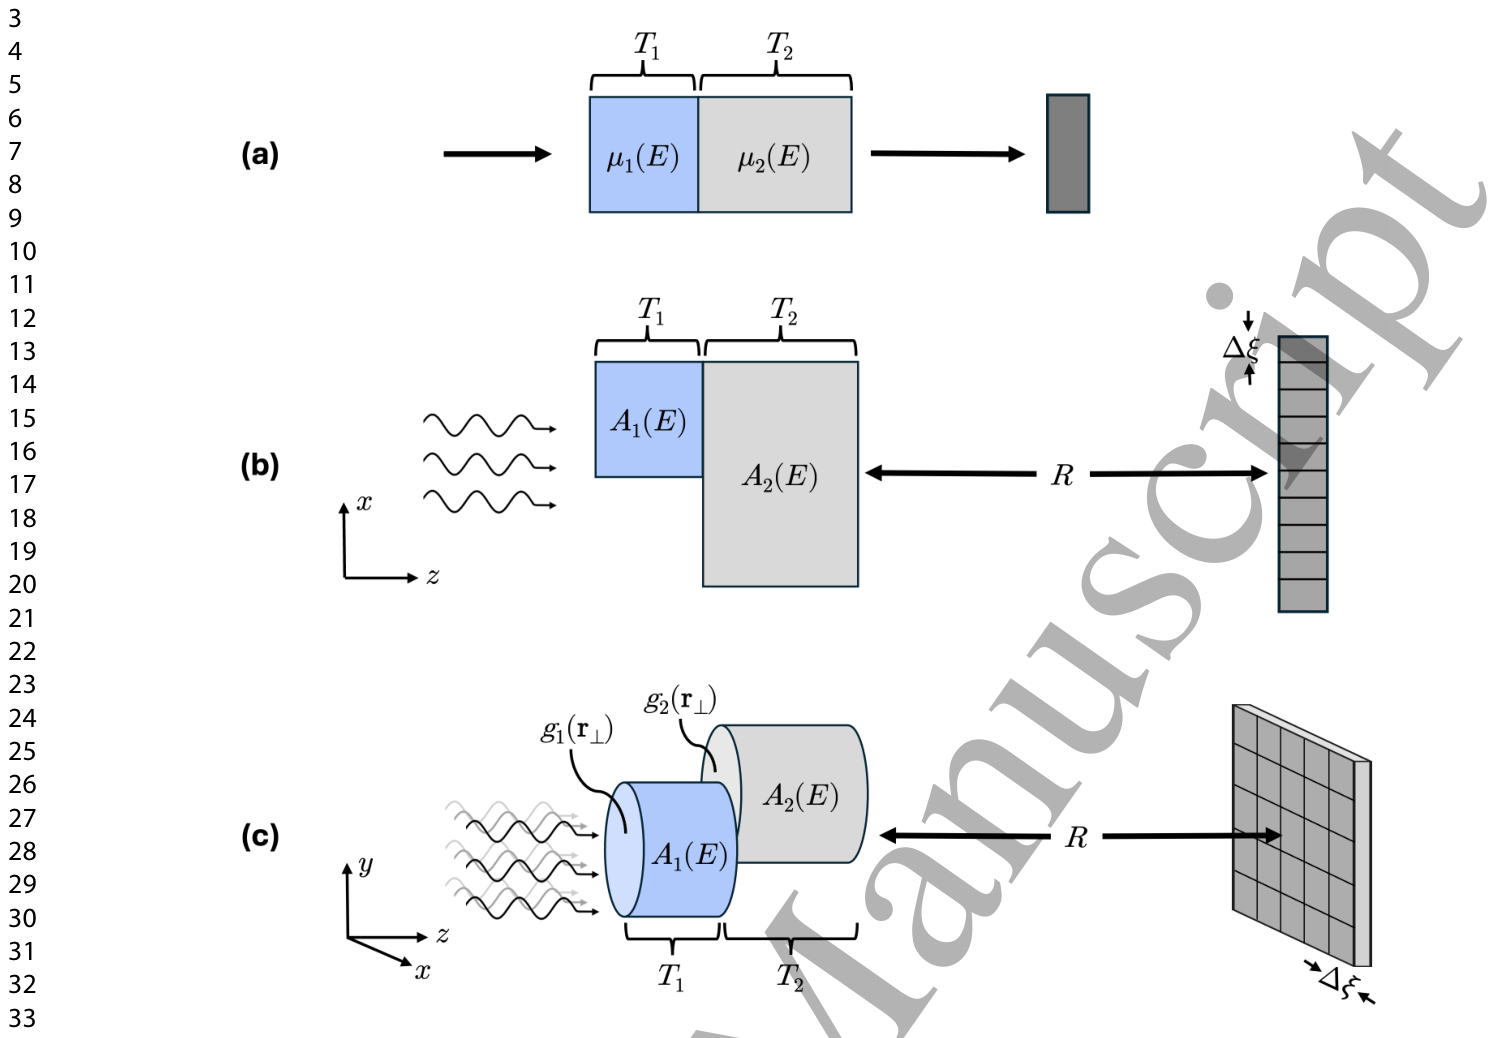
Figure 1. Figure 1. Schematics of the different two-material CRLB toy models. (a) Established single-ray model used for traditional spectral imaging. (b) Proposed 1D single-edge line-profile model for spectral PB-XPCI. (c) Generalized 2D model, depicted for an example geometry of basis material cylinders.解説: この図は、Cramér–Rao下限(CRLB)トイモデルの異なる2つの材料のスキームを示しています。(a)は従来のスペクトルイメージングで使用されるシングルレイモデル、(b)は提案されたスペクトルPB-XPCI用の1次元シングルエッジラインプロファイルモデル、(c)は基底材料のシリンダーの例で描かれた一般化された2次元モデルです。
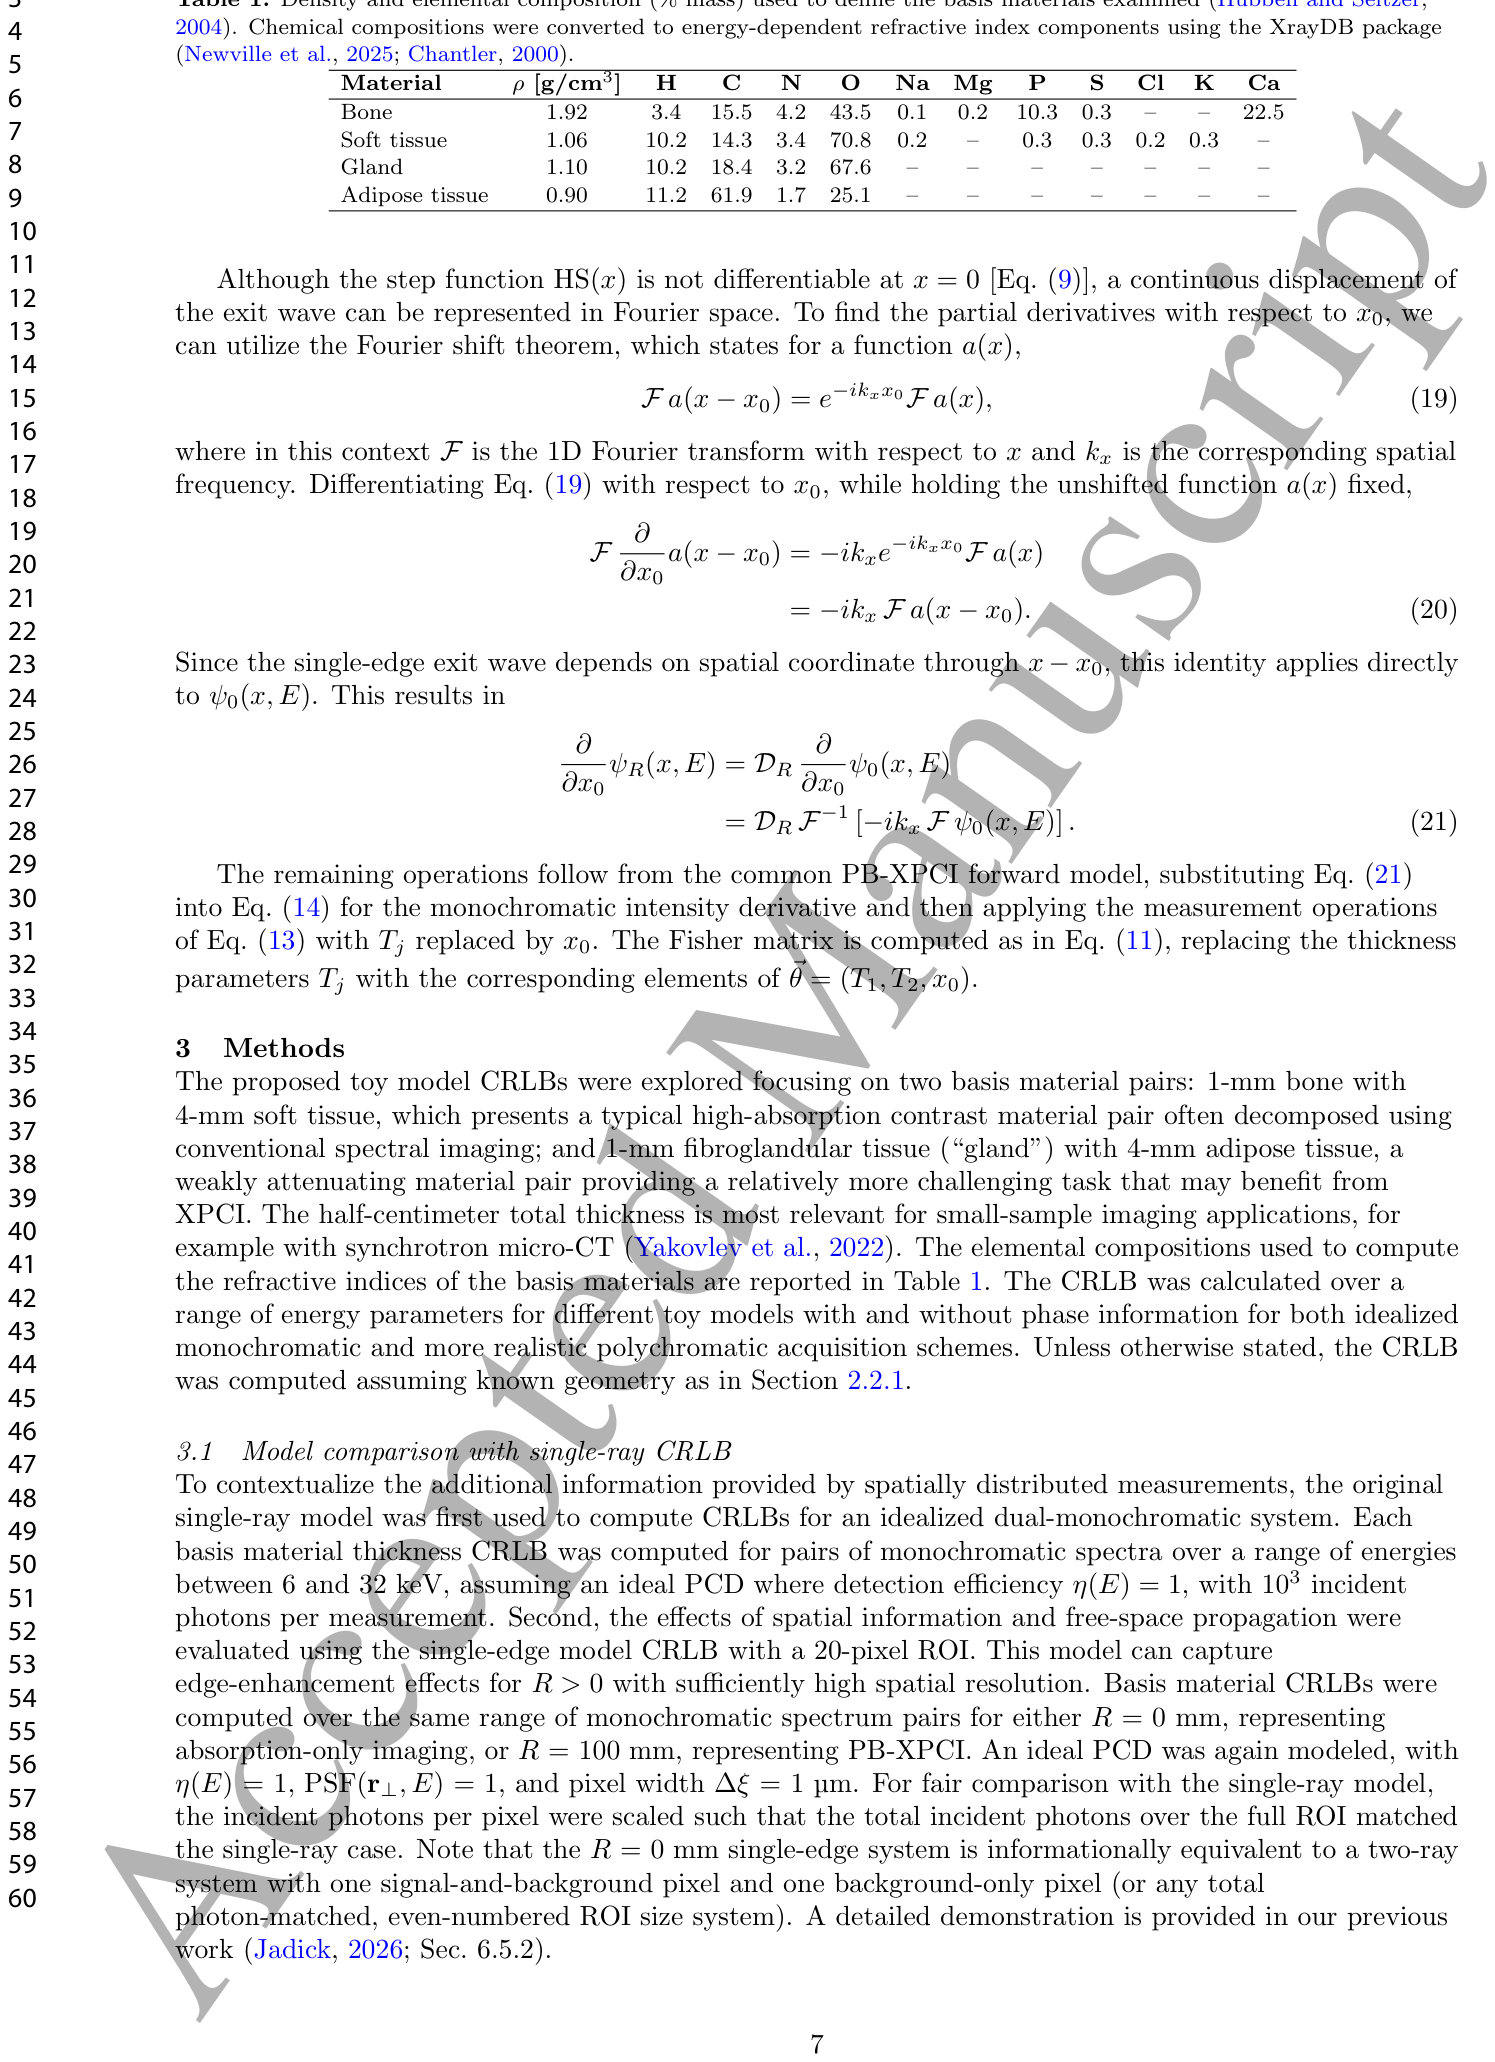
Table 1. Table 1. Density and elemental composition (% mass) used to define the basis materials examined (Hubbell and Seltzer, 2004). Chemical compositions were converted to energy-dependent refractive index components using the XrayDB package (Newville et al., 2025; Chantler, 2000).解説: この表は、調査された基礎材料(骨、軟組織、腺組織、脂肪組織)の密度と元素組成(質量%)を定義するために使用された値を示しています。これらのデータはXrayDBパッケージを用いてエネルギー依存性の屈折率成分に変換されました。
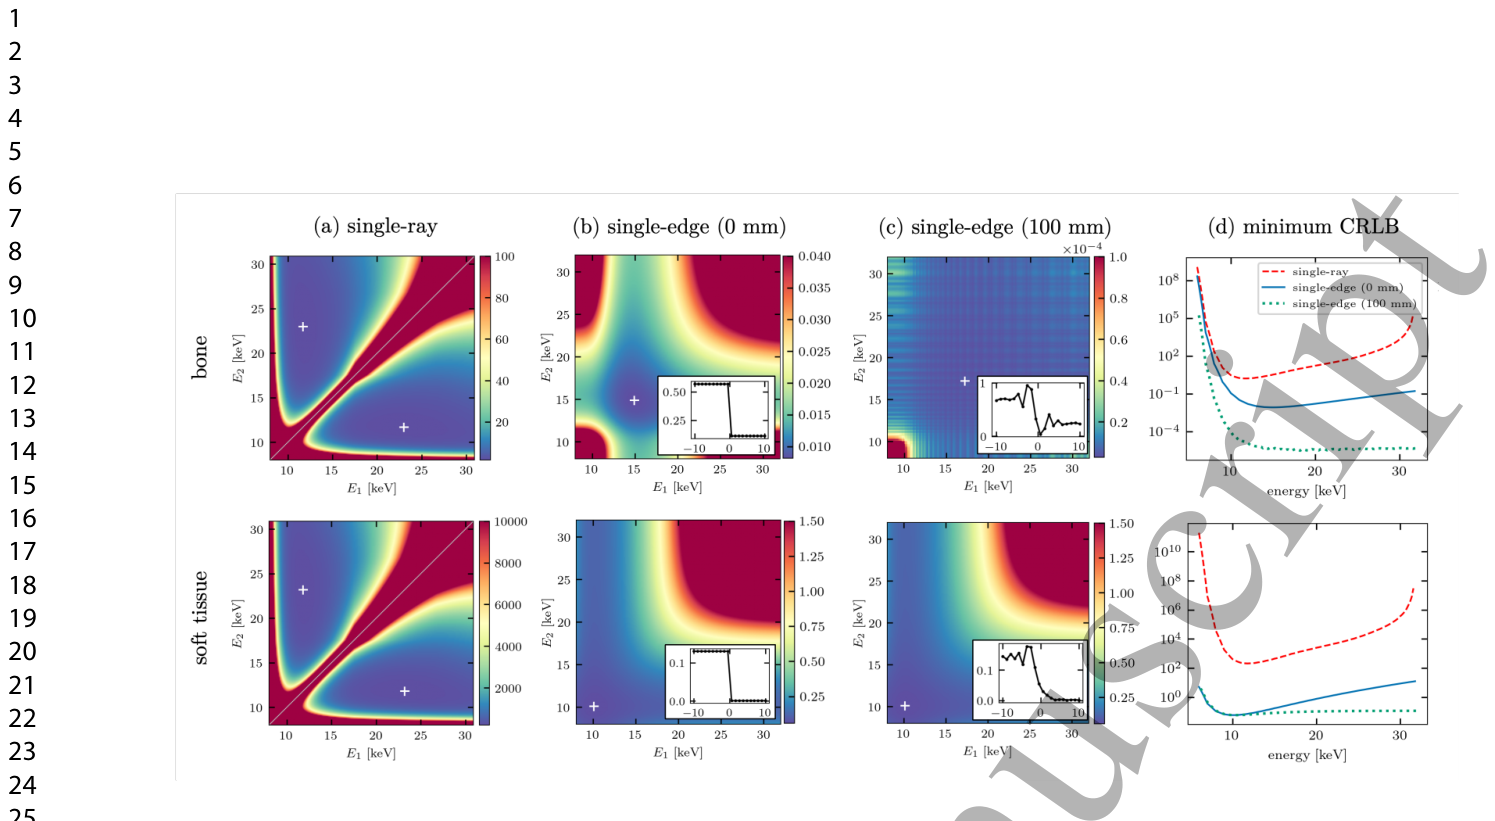
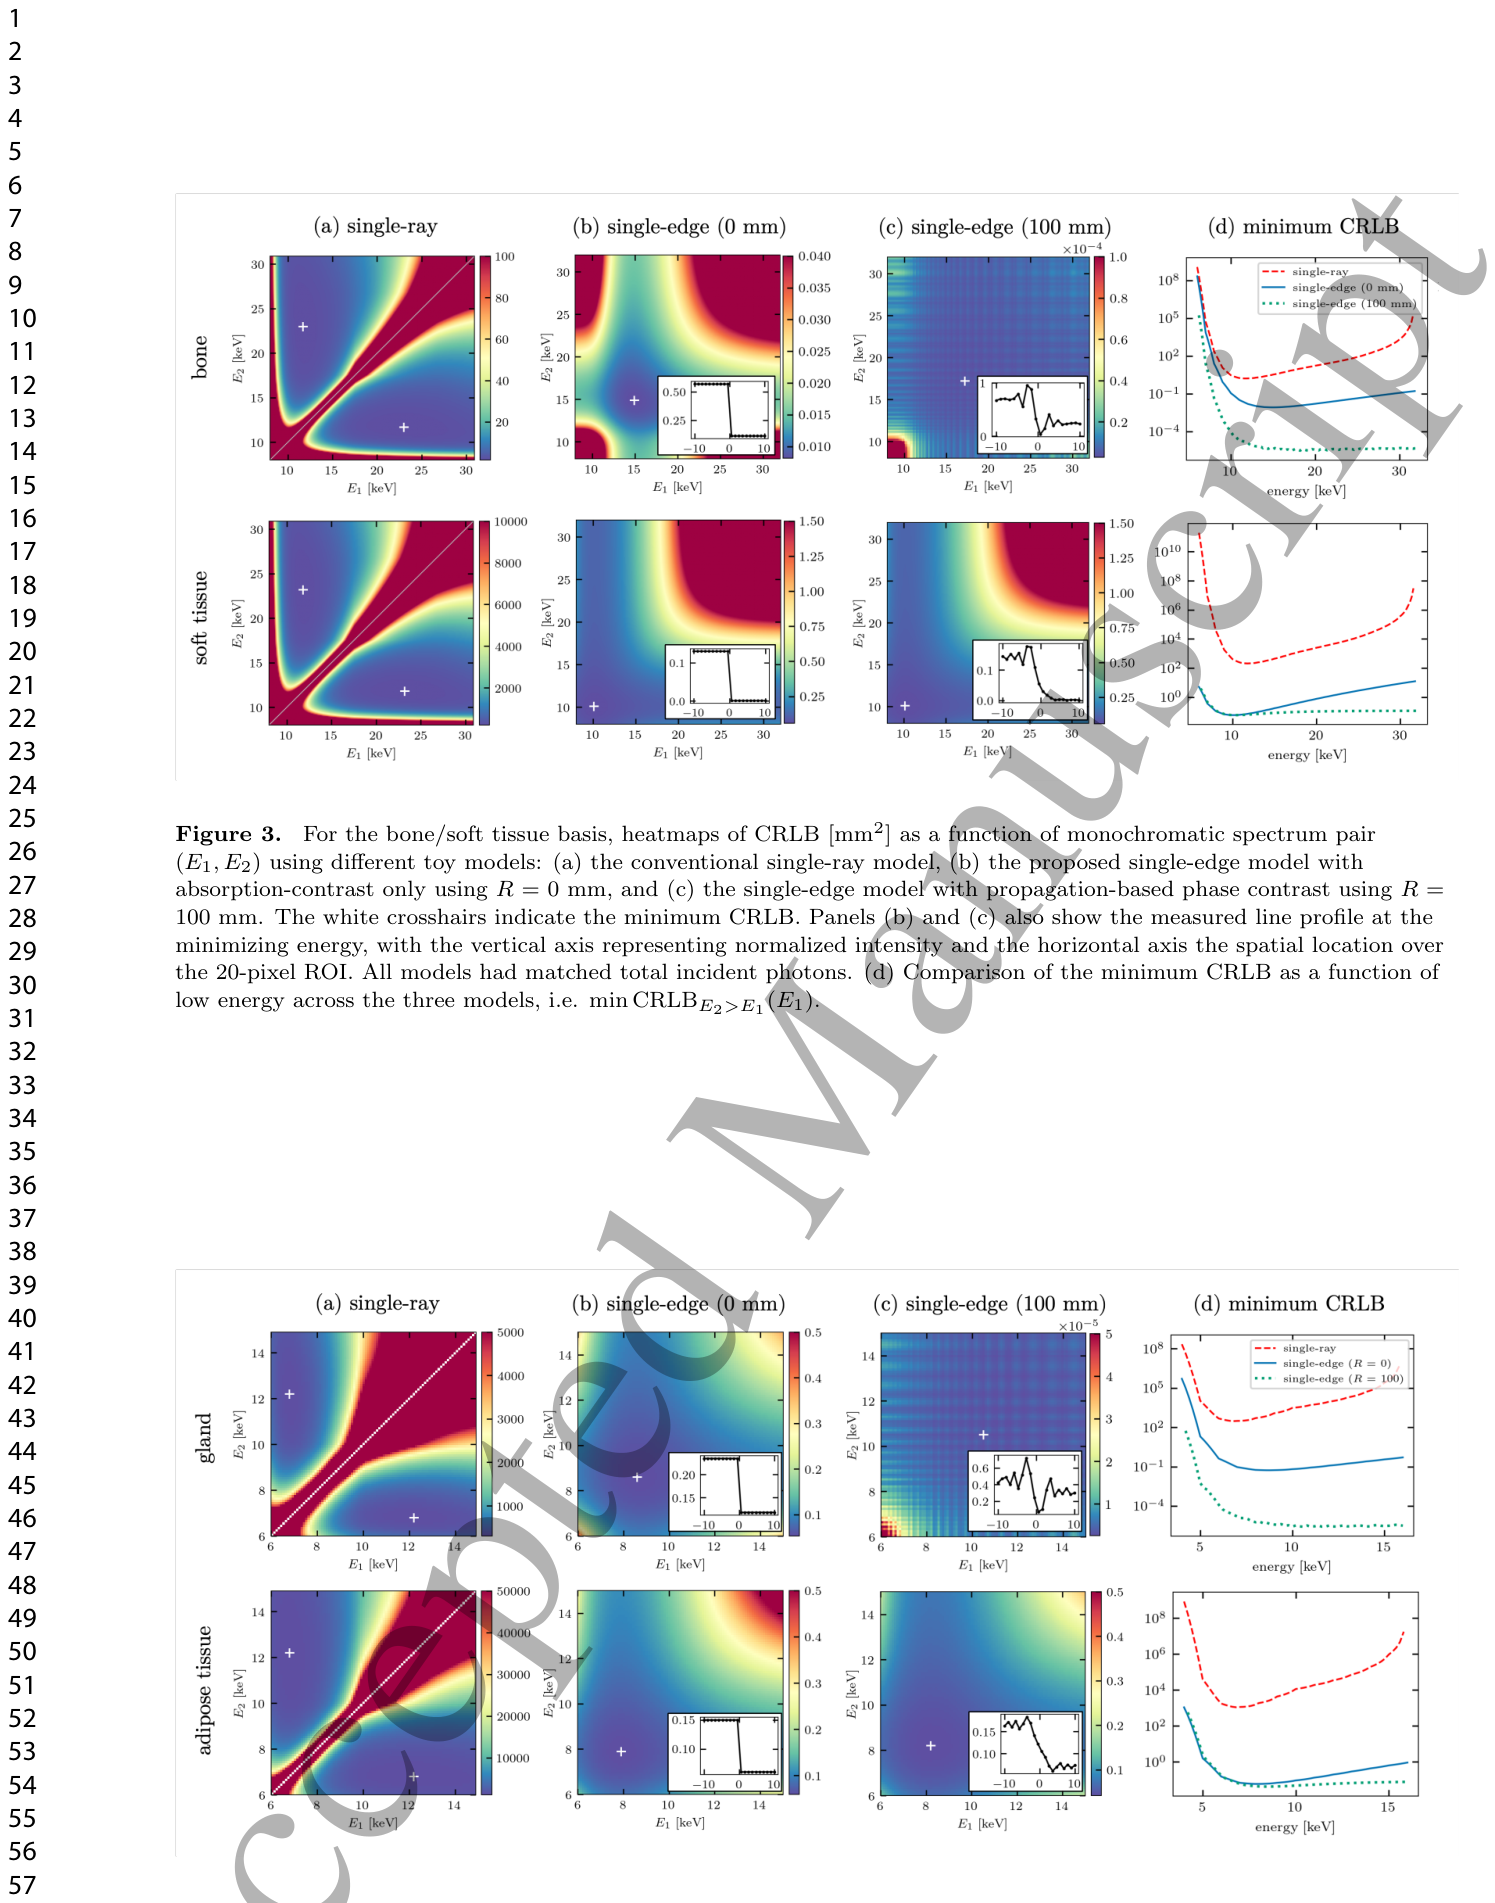
Figure 3. Figure 3. For the bone/soft tissue basis, heatmaps of CRLB [mm2] as a function of monochromatic spectrum pair (E1, E2) using different toy models: (a) the conventional single-ray model, (b) the proposed single-edge model with absorption-contrast only using R = 0 mm, and (c) the single-edge model with propagation-based phase contrast using R = 100 mm. The white crosshairs indicate the minimum CRLB. Panels (b) and (c) also show the measured line profile at the minimizing energy, with the vertical axis representing normalized intensity and the horizontal axis the spatial location over the 20-pixel ROI. All models had matched total incident photons. (d) Comparison of the minimum CRLB as a function of low energy across the three models, i.e. min CRLBE2>E1(E1).解説: この図は、骨/軟組織の組み合わせについて、異なるトイモデル((a)従来のシングルレイモデル、(b) R = 0 mmの吸収コントラストのみの提案シングルエッジモデル、(c) R = 100 mmの伝搬ベース位相コントラストを使用するシングルエッジモデル)における、単色スペクトルペア(E1, E2)の関数としてのCRLB[mm^2]のヒートマップを示しています。白い十字は最小CRLBを示し、(b)と(c)には最小化エネルギーでの測定ラインプロファイルも含まれています。(d)は、3つのモデル全体で低エネルギーE1の関数としての最小CRLBを比較しています。Figure 4. Figure 4. For the gland/adipose tissue basis, heatmaps of CRLB [mm2] as detailed in Fig. 3 caption.解説: この図は、腺組織/脂肪組織の組み合わせについて、図3のキャプションで詳述されているCRLB[mm^2]のヒートマップを示しています。各パネルは骨/軟組織の図3と同様に、シングルレイ、R=0mmのシングルエッジ、R=100mmのシングルエッジモデルのCRLB分布と、最小CRLBの比較を示しています。
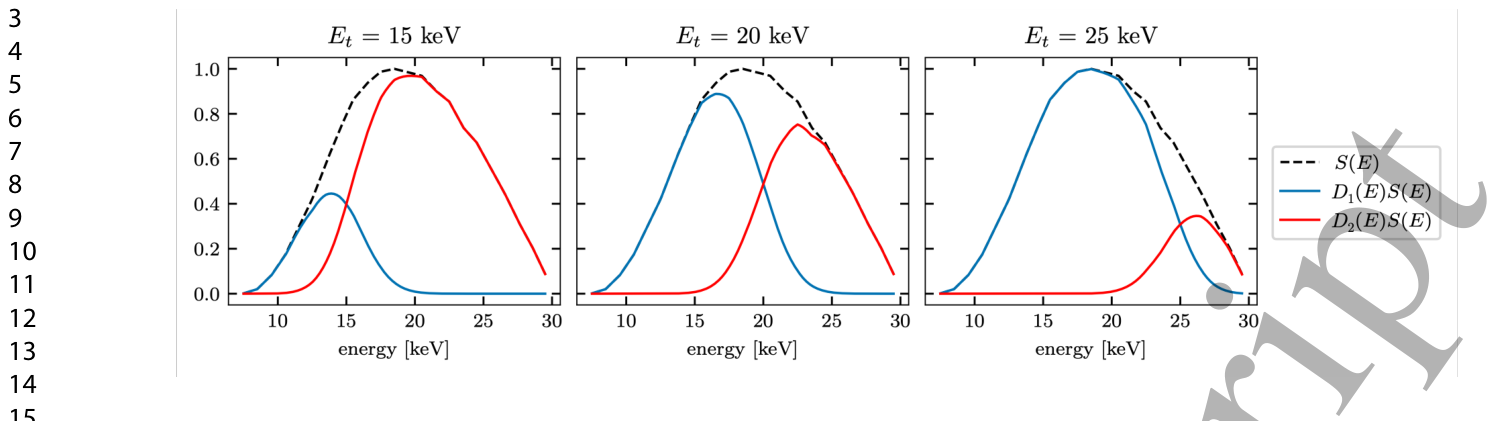
Figure 2. Figure 2. Illustration of the detector response functions D(E) modeled for the spectral PCD system given single energy thresholds of Et = 15, 20, or 25 keV for a normalized 30-kVp spectrum S(E) with a 5-keV FWHM spectral threshold blur.解説: この図は、スペクトル光子計数型検出器(PCD)システム用にモデル化された検出器応答関数D(E)を、単一のエネルギー閾値Etが15、20、または25 keVの場合について示しています。点線の黒線は30-kVpスペクトルS(E)を、青線と赤線はそれぞれ異なるエネルギービンに検出されたフォトンの割合を示しており、5-keV FWHMのスペクトル閾値ぼかしを考慮しています。
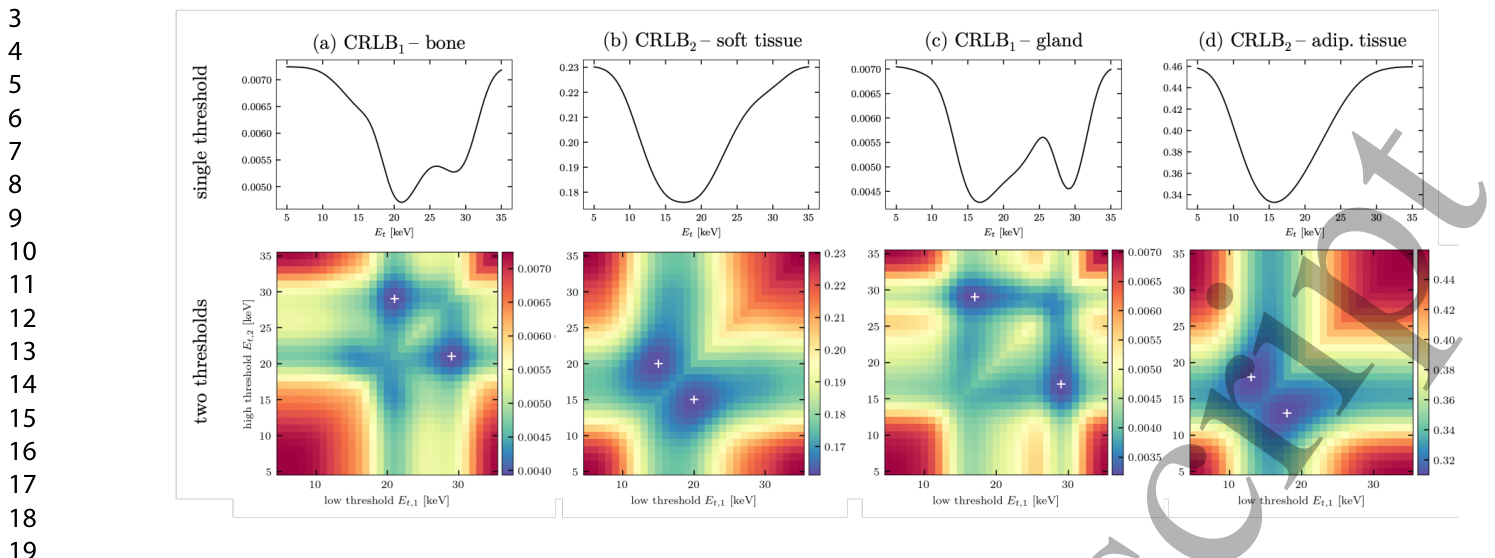
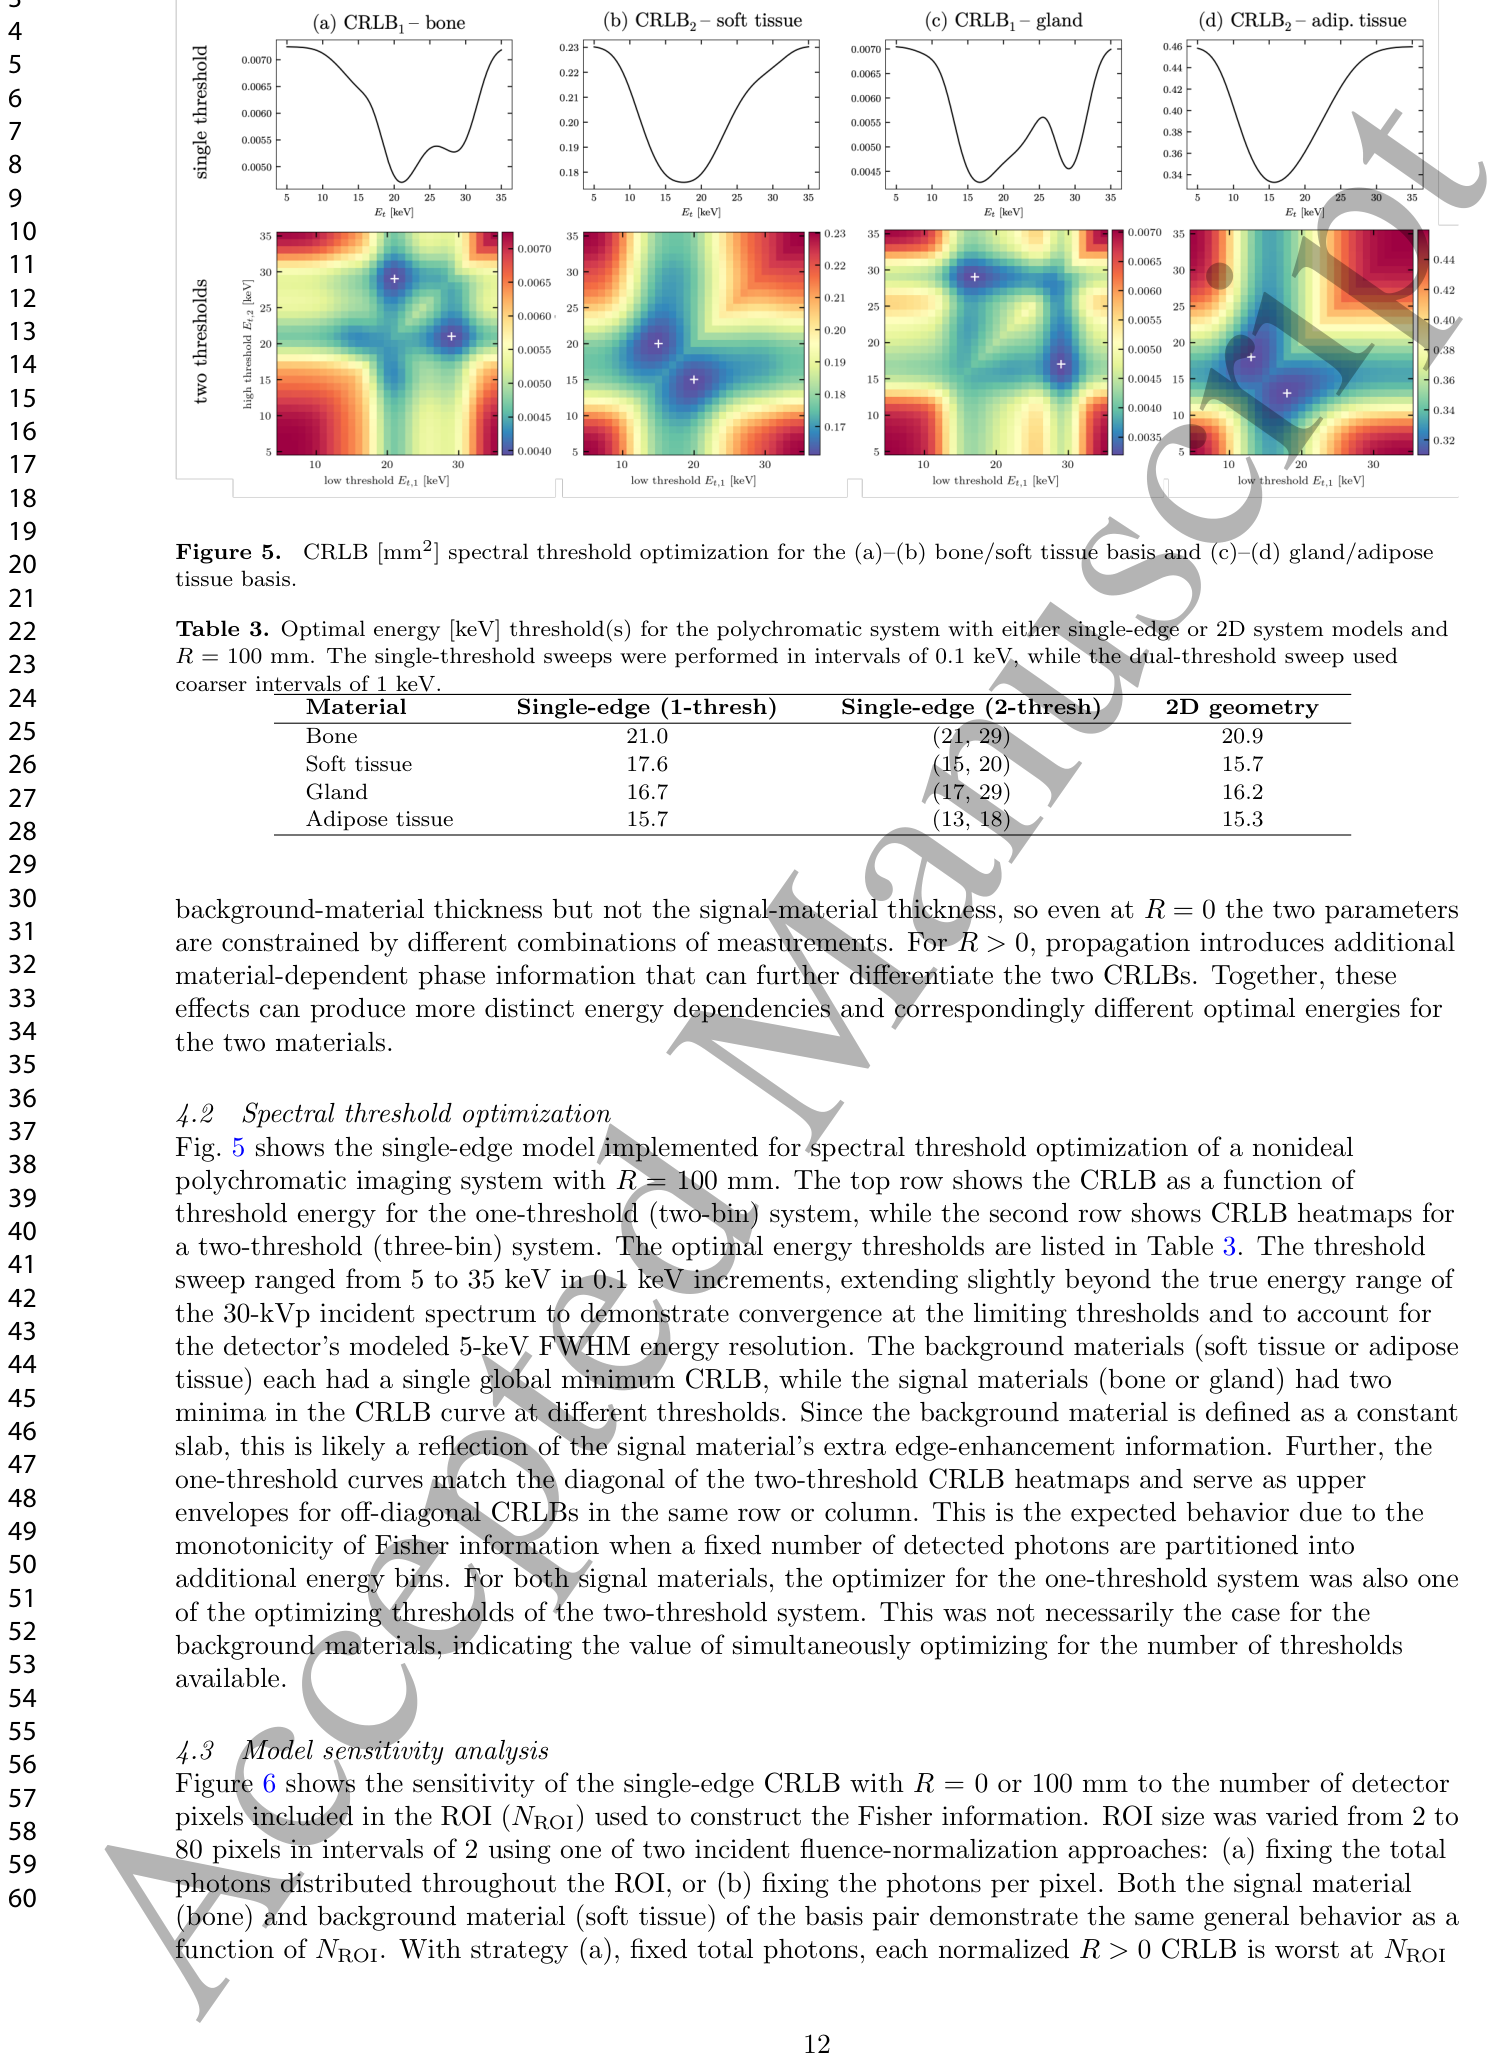
Figure 5. Figure 5. CRLB [mm2] spectral threshold optimization for the (a)–(b) bone/soft tissue basis and (c)–(d) gland/adipose tissue basis.解説: この図は、(a)-(b)骨/軟組織と(c)-(d)腺組織/脂肪組織のCRLB[mm^2]スペクトル閾値最適化の結果を示しています。上段は単一閾値システム、下段は2つの閾値システムでのCRLBのエネルギー閾値に対する依存性を表すヒートマップです。Table 2. Table 2. Optimal CRLB energy [keV] pairs for each toy model and basis material. Material Single-ray Single-edge (R = 0 mm) Single-edge (R = 100 mm) Bone (11.7, 23.0) (14.9, 14.9) (17.2, 17.2) Soft tissue (11.8, 23.2) (10.1, 10.1) (10.1, 10.1) Gland (6.8, 12.2) (8.6, 8.6) (10.5, 10.5) Adipose tissue (6.8, 12.2) (7.9, 7.9) (8.2, 8.2)解説: この表は、各トイモデルと基礎材料(骨、軟組織、腺組織、脂肪組織)に対する最適なCRLBエネルギー[keV]ペアを示しています。シングルレイモデルでは異なるエネルギーのペアが最適である一方、シングルエッジモデル(R=0mmおよびR=100mm)では同じエネルギーのペアが最適となる傾向があります。Table 3. Table 3. Optimal energy [keV] threshold(s) for the polychromatic system with either single-edge or 2D system models and R = 100 mm. The single-threshold sweeps were performed in intervals of 0.1 keV, while the dual-threshold sweep used coarser intervals of 1 keV.解説: この表は、R=100mmのポリクロマティックシステムにおいて、シングルエッジモデルまたは2Dシステムモデルを使用した際の、最適なエネルギー[keV]閾値を示しています。シングル閾値掃引は0.1keV間隔で、デュアル閾値掃引は1keV間隔で実行されました。
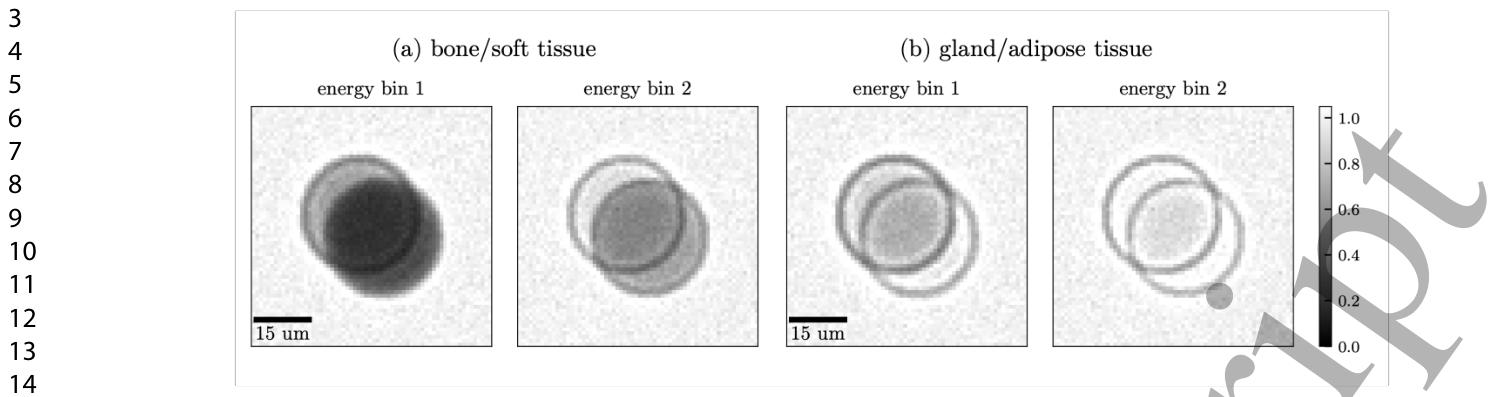
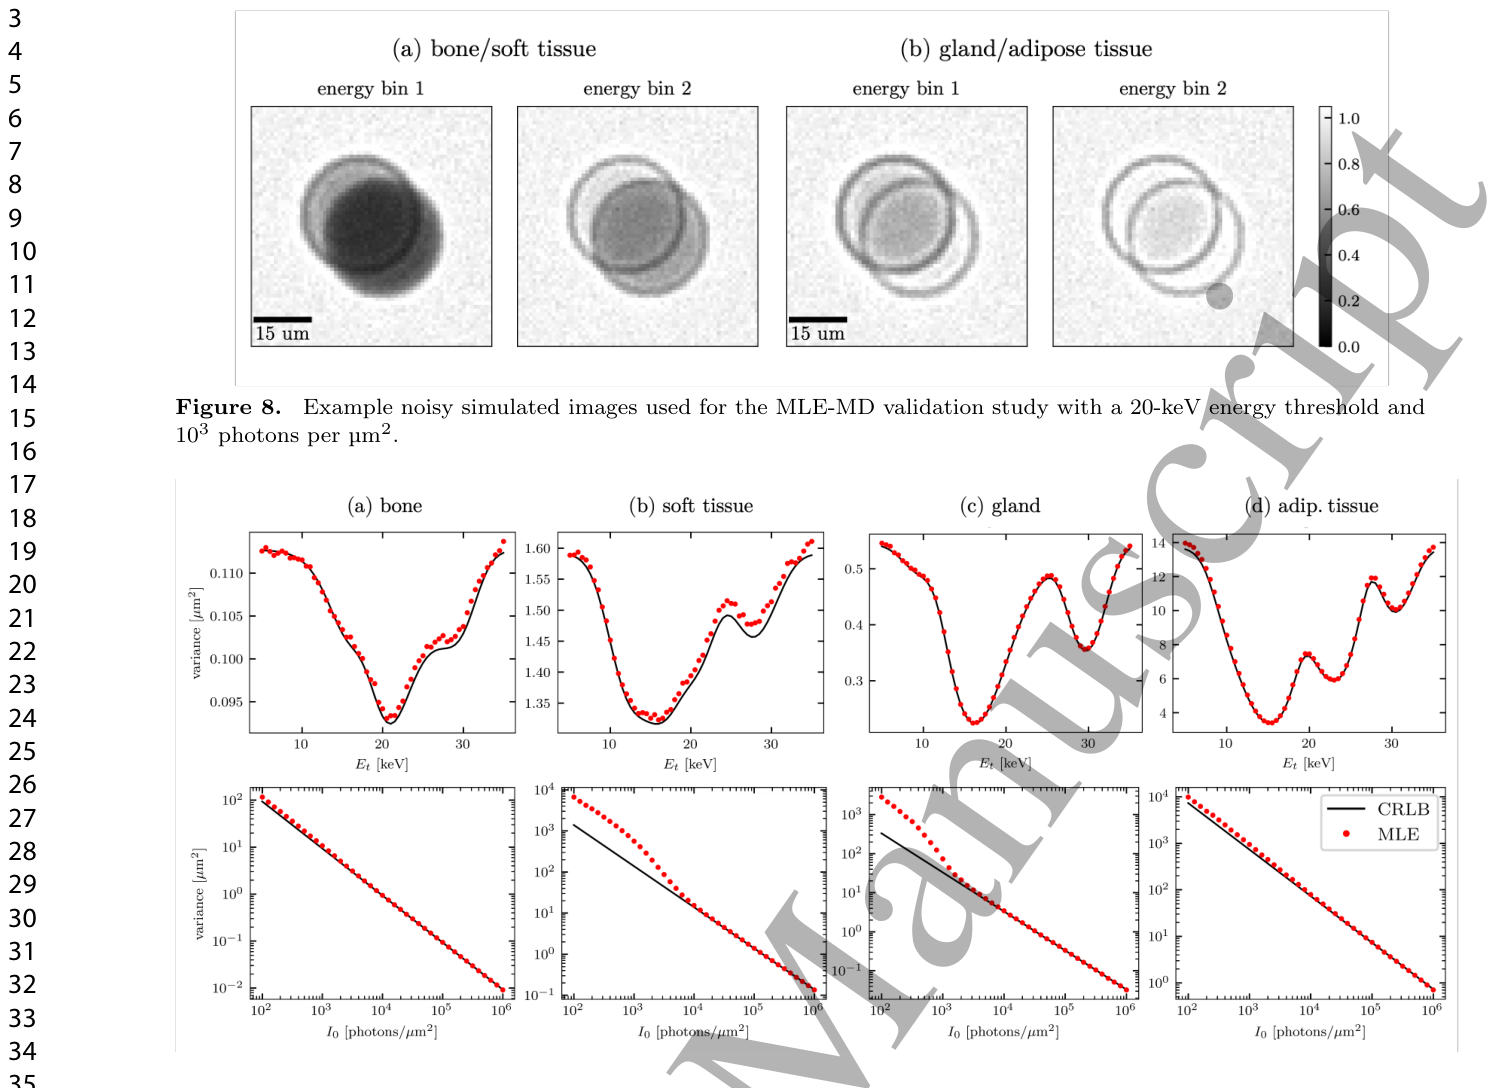
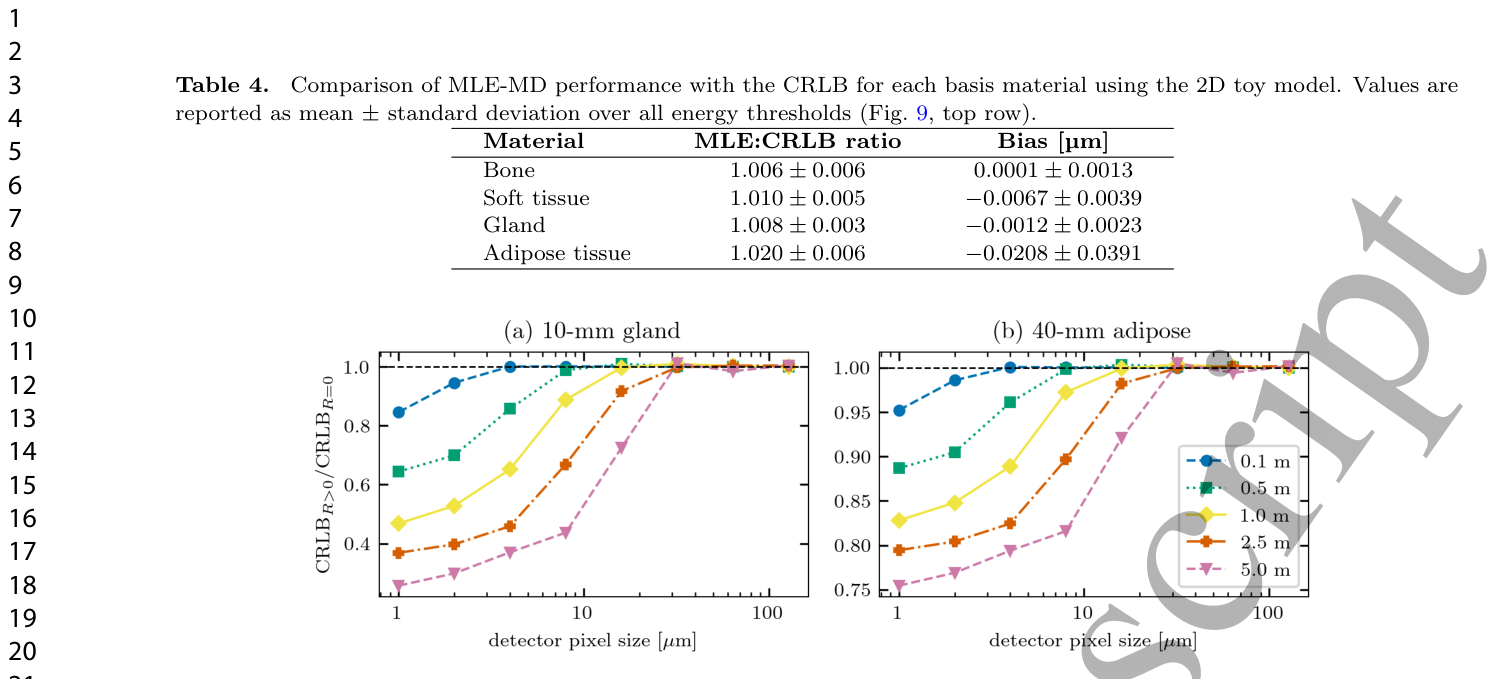
Figure 8. Figure 8. Example noisy simulated images used for the MLE-MD validation study with a 20-keV energy threshold and 103 photons per µm2.解説: この図は、最大尤度推定による材料分解検証研究で使用された、20-keVのエネルギー閾値と1 µm^2あたり10^3フォトンでのノイズシミュレーション画像の例を示しています。(a)骨/軟組織と(b)腺組織/脂肪組織の2つの材料について、エネルギービン1とビン2の画像が表示されています。Figure 9. Figure 9. (Top row) Comparison of CRLB and MLE-MD variance as a function of threshold energy with 105 incident photons per µm2. (Bottom row) The same variance comparison as a function of incident fluence with fixed energy threshold of 20 keV.Table 4. Table 4. Comparison of MLE-MD performance with the CRLB for each basis material using the 2D toy model. Values are reported as mean ± standard deviation over all energy thresholds (Fig. 9, top row).解説: この表は、2Dトイモデルを用いた各基礎材料に対する最大尤度推定(MLE-MD)性能とCRLBの比較を示しています。値は、図9(上段)のすべてのエネルギー閾値における平均±標準偏差で報告されています。MLE-MDの分散とCRLBの比率は1.006から1.020の範囲であり、バイアスは非常に小さいことが示されています。
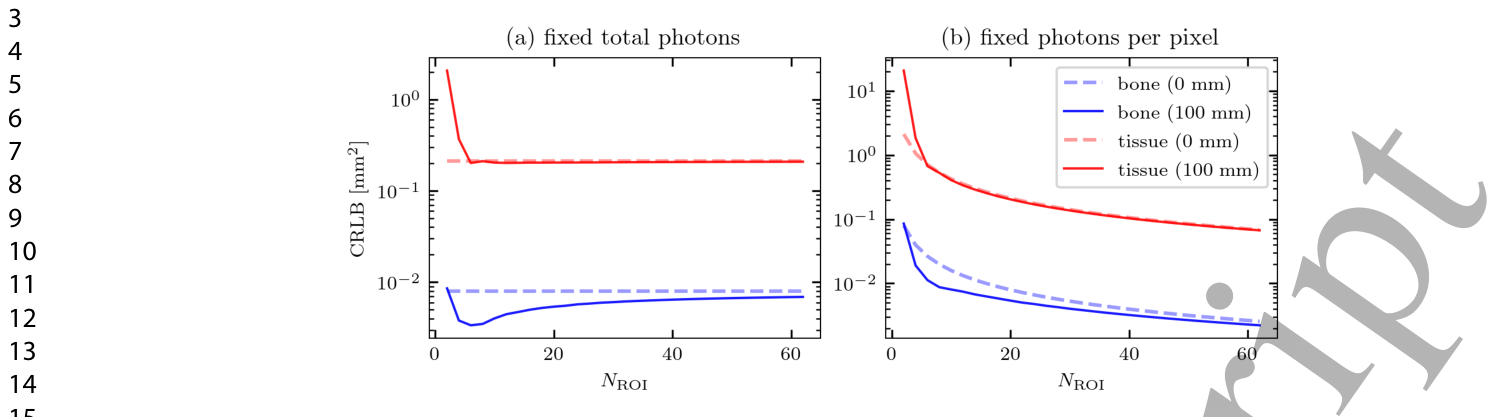
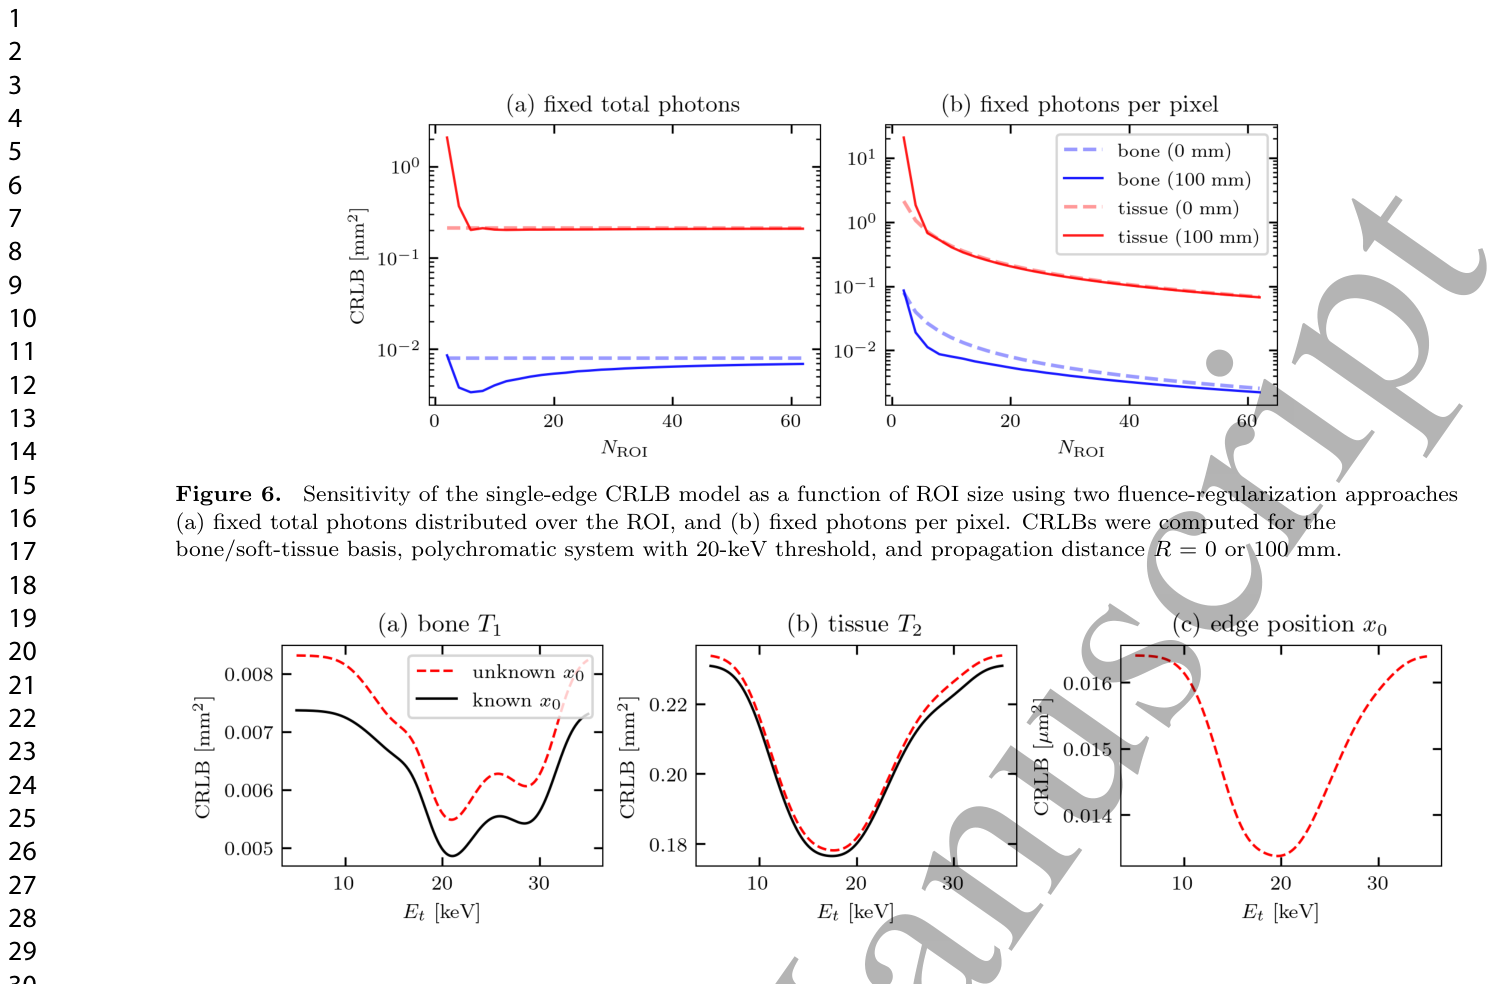
Figure 6. Figure 6. Sensitivity of the single-edge CRLB model as a function of ROI size using two fluence-regularization approaches (a) fixed total photons distributed over the ROI, and (b) fixed photons per pixel. CRLBs were computed for the bone/soft-tissue basis, polychromatic system with 20-keV threshold, and propagation distance R = 0 or 100 mm.解説: この図は、2つのフルエンス正規化アプローチ((a)ROI全体に固定された総光子数、(b)ピクセルあたりに固定された光子数)を使用した、ROIサイズに対するシングルエッジCRLBモデルの感度を示しています。CRLBは、骨/軟組織の組み合わせ、20-keV閾値のポリクロマティックシステム、伝搬距離R=0または100mmで計算されました。Figure 7. Figure 7. Comparison of single-edge CRLBs as a function of polychromatic spectrum threshold energy Et when treating the edge location x0 as either known or unknown. Panels (a) and (b) show the thickness CRLBs for bone and soft tissue, which are found with both known/unknown models. Panel (c) shows the edge position x0, found only when treating it as an unknown parameter.解説: この図は、エッジ位置x0を既知または未知のパラメータとして扱う場合の、ポリクロマティックスペクトルの閾値エネルギーEtの関数としてのシングルエッジCRLBの比較を示しています。(a)と(b)は骨と軟組織の厚さCRLBを示し、(c)はエッジ位置x0のCRLBを未知のパラメータとして扱った場合にのみ示しています。
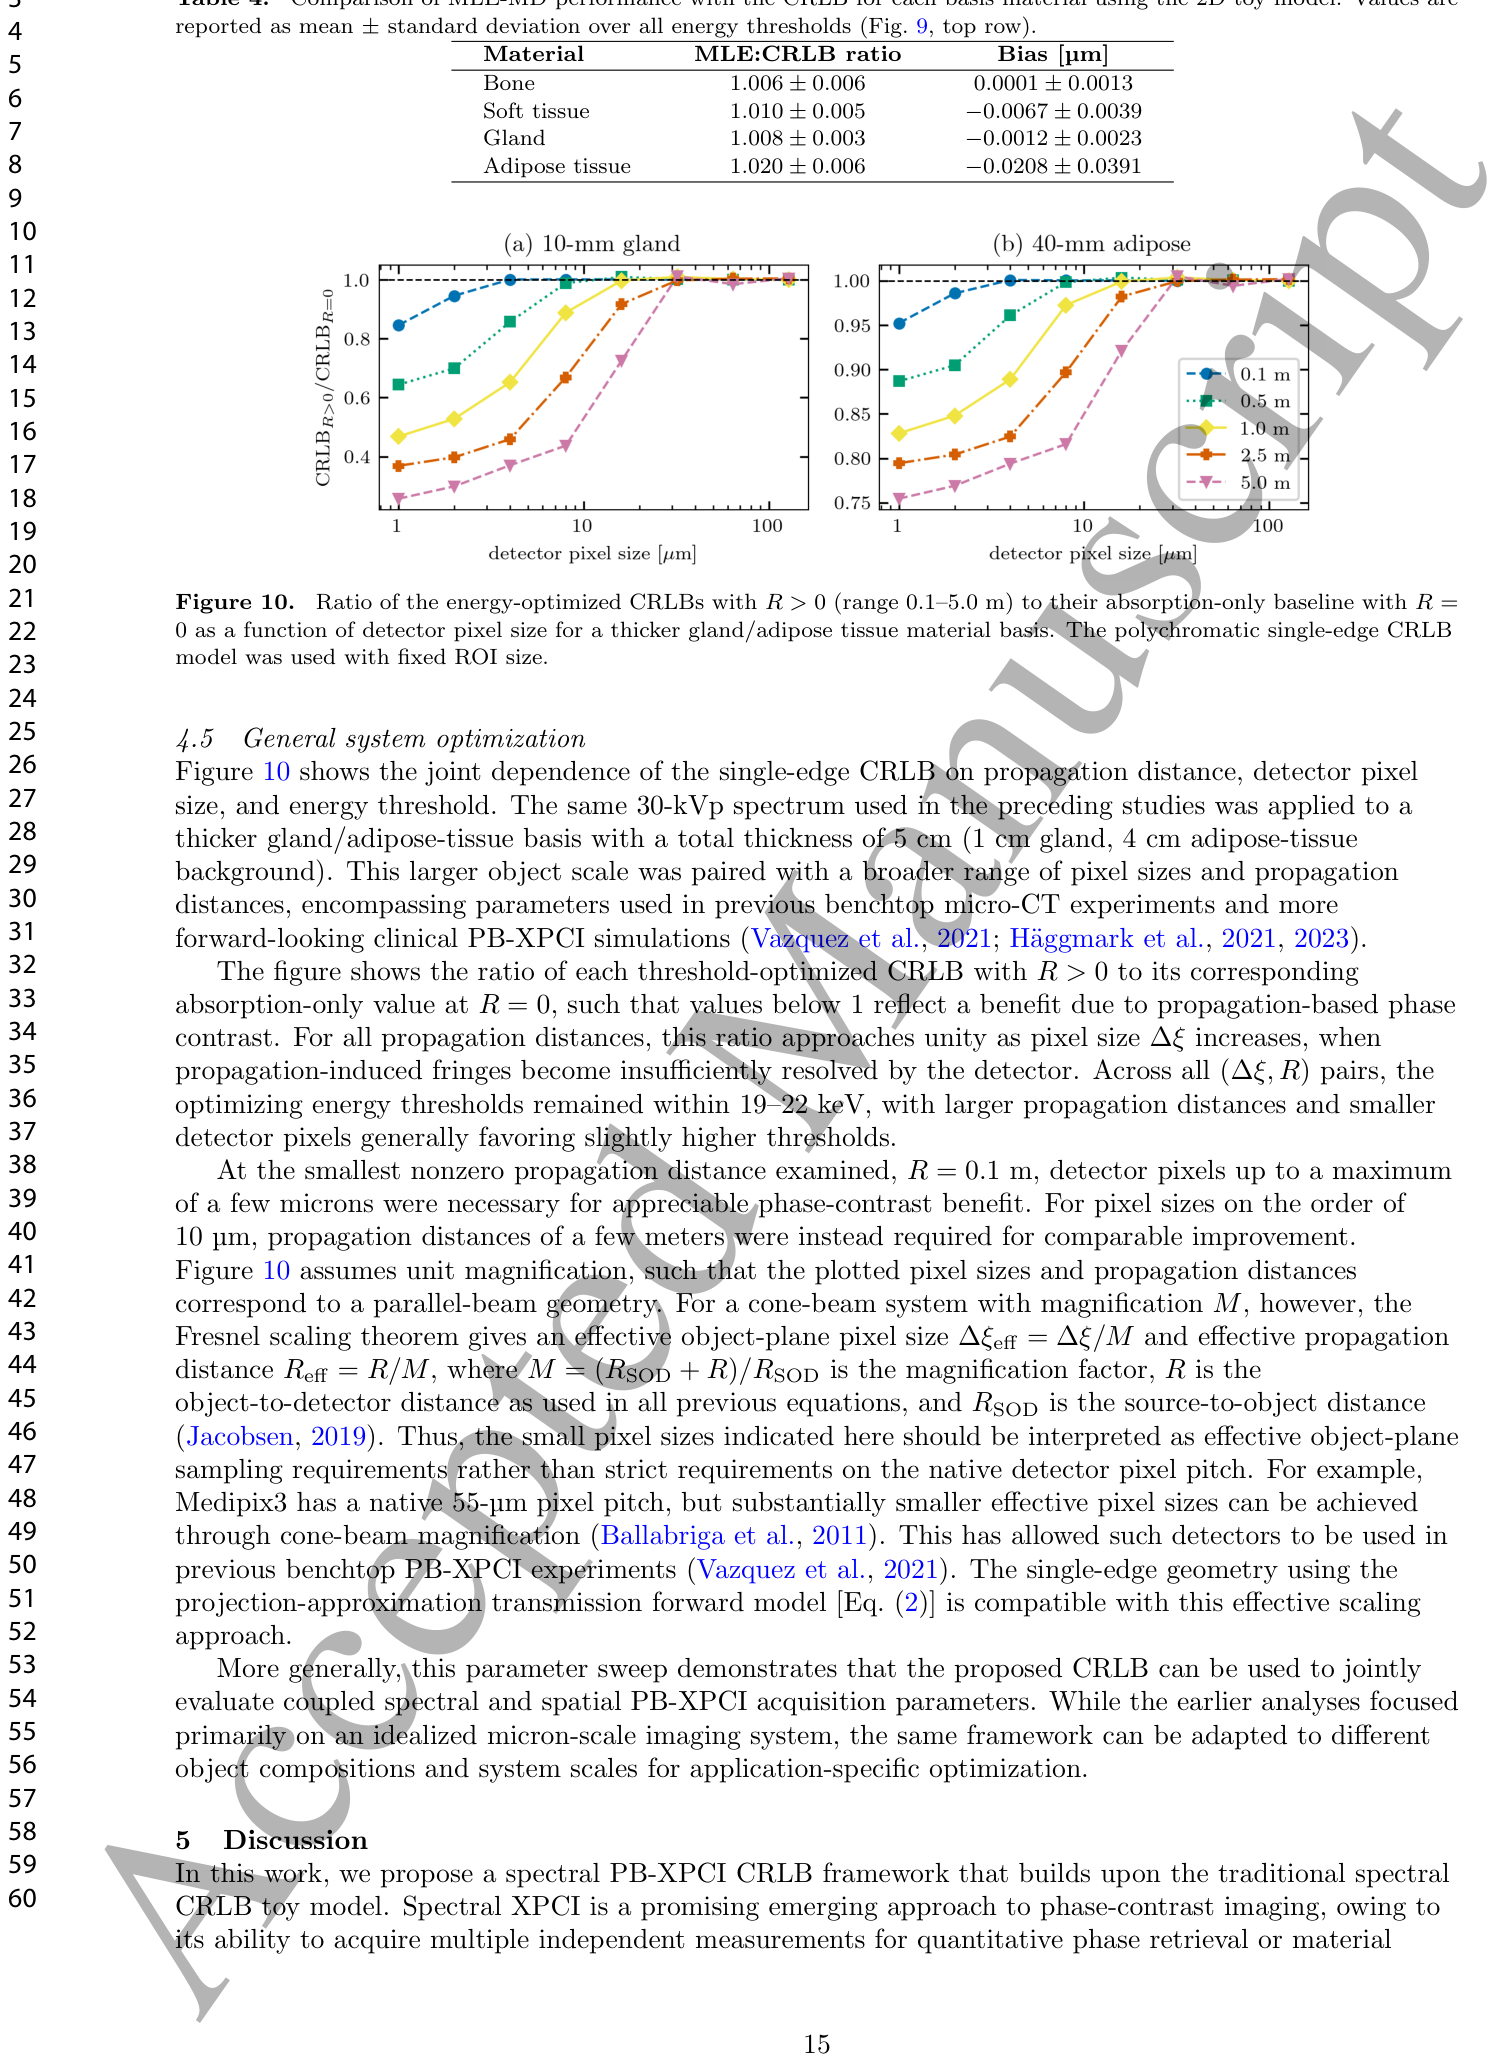
Figure 10. Figure 10. Ratio of the energy-optimized CRLBs with R > 0 (range 0.1–5.0 m) to their absorption-only baseline with R = 0 as a function of detector pixel size for a thicker gland/adipose tissue material basis. The polychromatic single-edge CRLB model was used with fixed ROI size.

コメントを残す