どうも、Beyond the Pixelです。放射線治療はがん治療において極めて重要な役割を担いますが、その成功は治療計画の精度に大きく依存します。治療計画では、磁気共鳴画像(MRI)が軟部組織の優れたコントラストを提供し、腫瘍や周囲の重要な臓器(リスク臓器、OARs)を詳細に描写するのに役立ちます。一方、コンピュータ断層撮影(CT)は、放射線線量計算に不可欠な電子密度情報を提供します。これらの異なる利点を持つ画像情報を統合することは、より正確な治療計画のために理想的です。
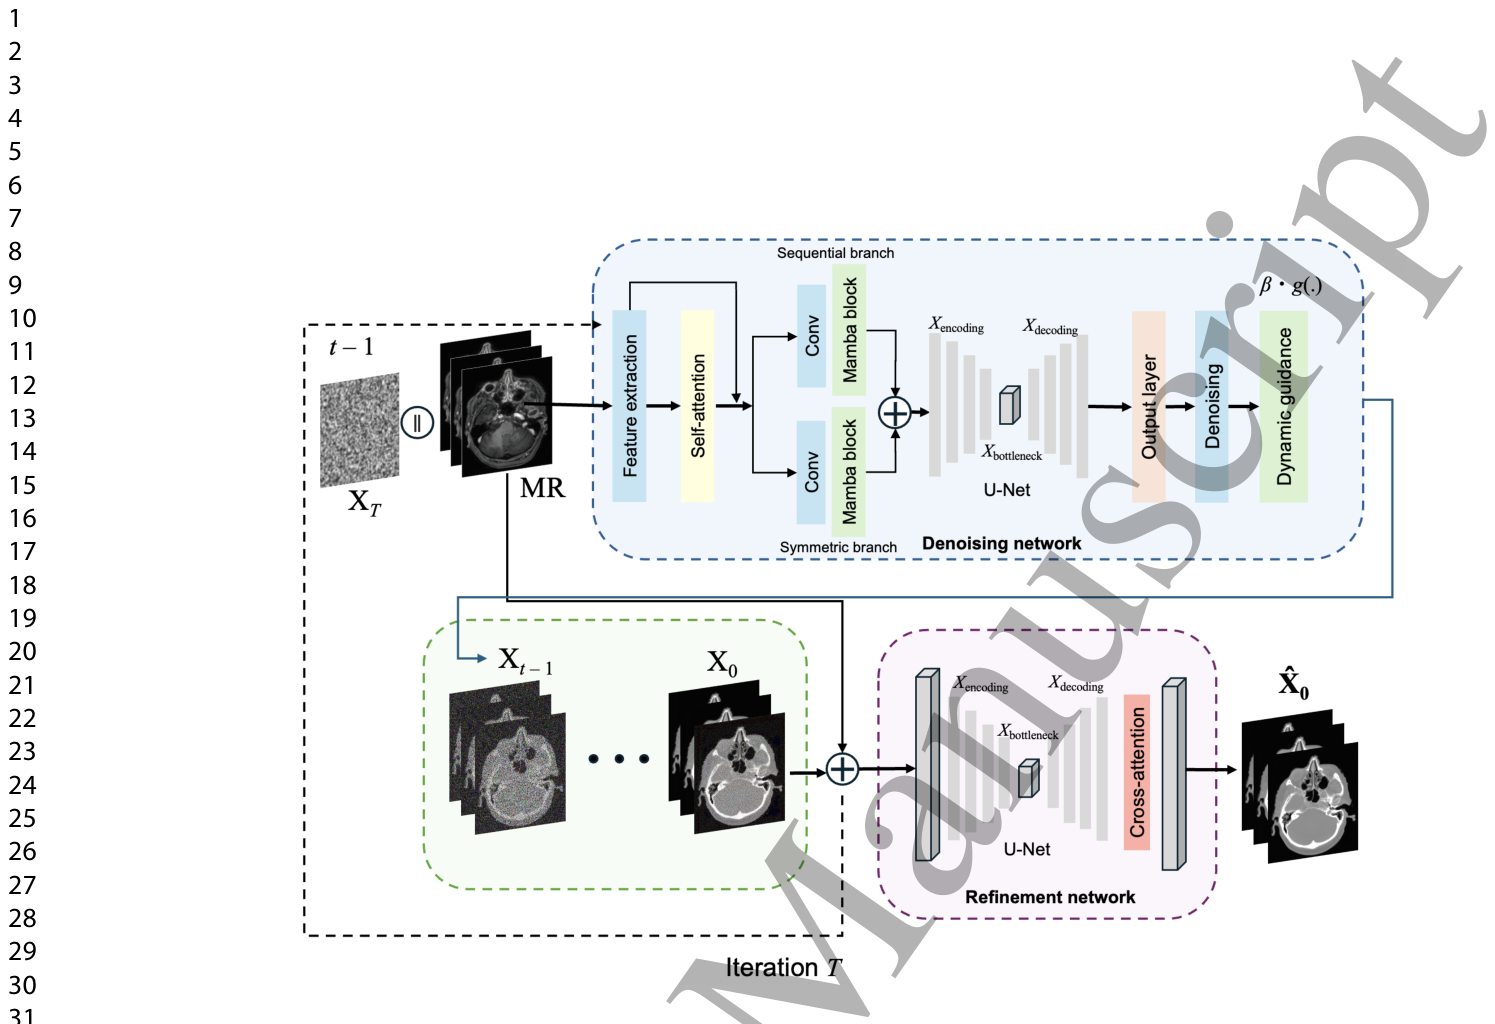
Figure 1. Figure 1: The overall framework is based on a hybrid architecture with dynamic guidance. It integrates the corrupted CT image XT , the single-channel 3D MRI (shown with mul- tiple 2D slices), and the timestep, starting from timestep T, and iteratively generates the denoised CT image Xt−1 until T = 1 (dashed line). The model combines Self-Attention and standard Mamba blocks Gu and Dao (2023), utilizing attention-driven feature extrac- tion and processing through sequential and symmetric branches. A selective scan based on a learned spatial filtering mechanism (Eq. (8)) is employed, followed by Mamba blocks. The dynamic guidance layer adapts the reverse process according to the noise level (Eqs. (3), (4), (6), and (7)). The denoised synthetic CT X0 at the final timestep and the MRI image are fed into the refinement network, which leverages a U-Net with a cross-attention mechanism in the decoder to output the final synthetic sCT ˆ X0. The denoising network is trained with a guided loss function (Eq. (9)), while the refinement network is trained using the loss expressed in Eq. (10). The overall training framework loss is given by Eq. (11), which is a weighted loss balancing the contributions of each component to ensure optimal balance between both noise estimation and image refinement.解説: この図は、動的ガイダンスを備えたハイブリッドアーキテクチャに基づいた、提案モデル全体のフレームワークを示しています。ノイズを加えたCT画像、MRI画像、およびタイムステップを統合し、タイムステップTから開始して、T=1になるまで反復的にノイズ除去されたCT画像を生成します。モデルは、自己注意機構とMambaブロックを組み合わせ、選択的スキャンと学習された空間フィルタリングメカニズムを利用して特徴抽出と処理を行います。動的ガイダンス層は、ノイズレベルに応じてリバースプロセスを調整します。最終タイムステップでノイズ除去された合成CT画像とMRI画像は、リファインメントネットワークに入力され、最終的な合成CT画像を出力します。
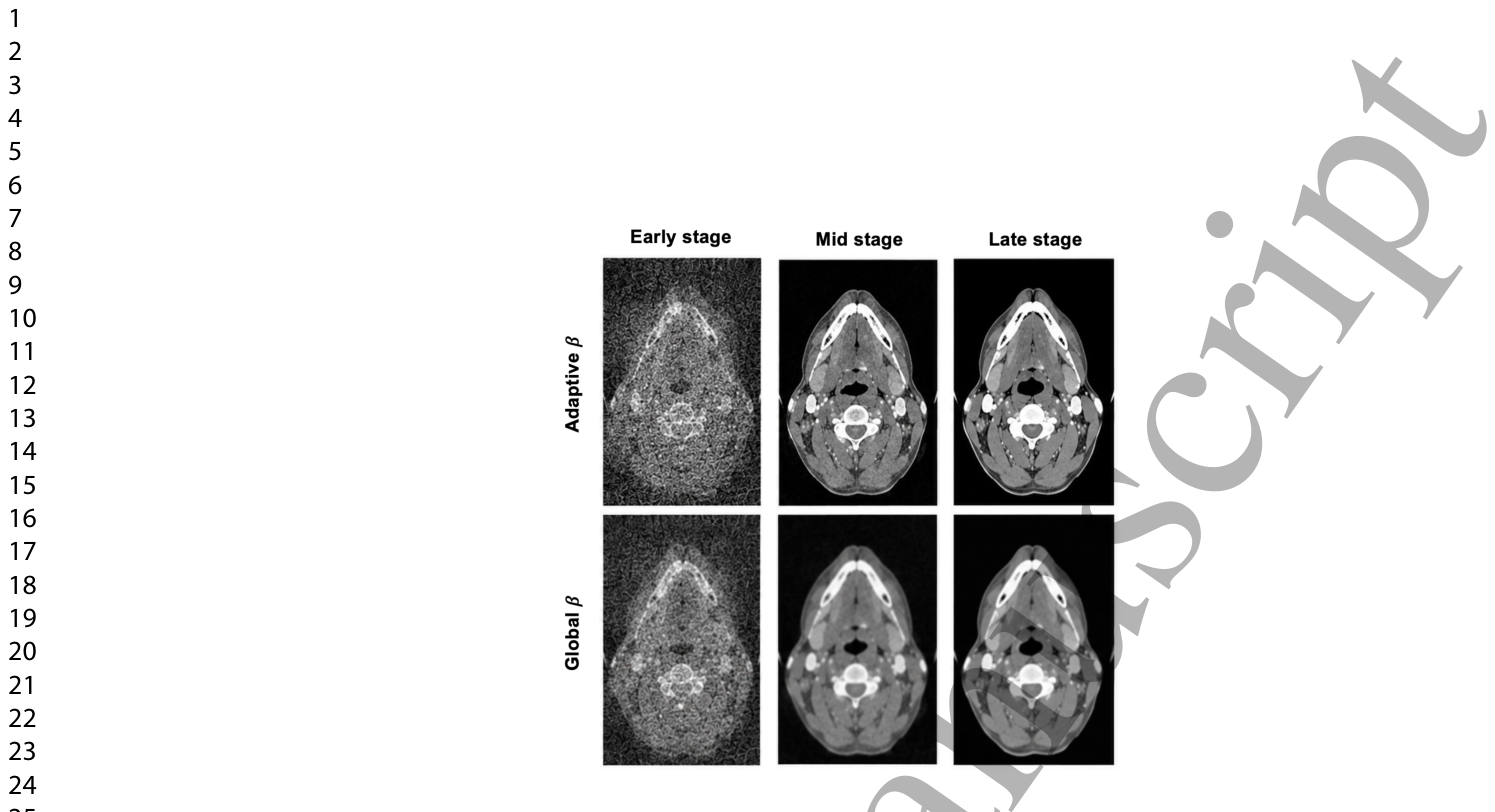
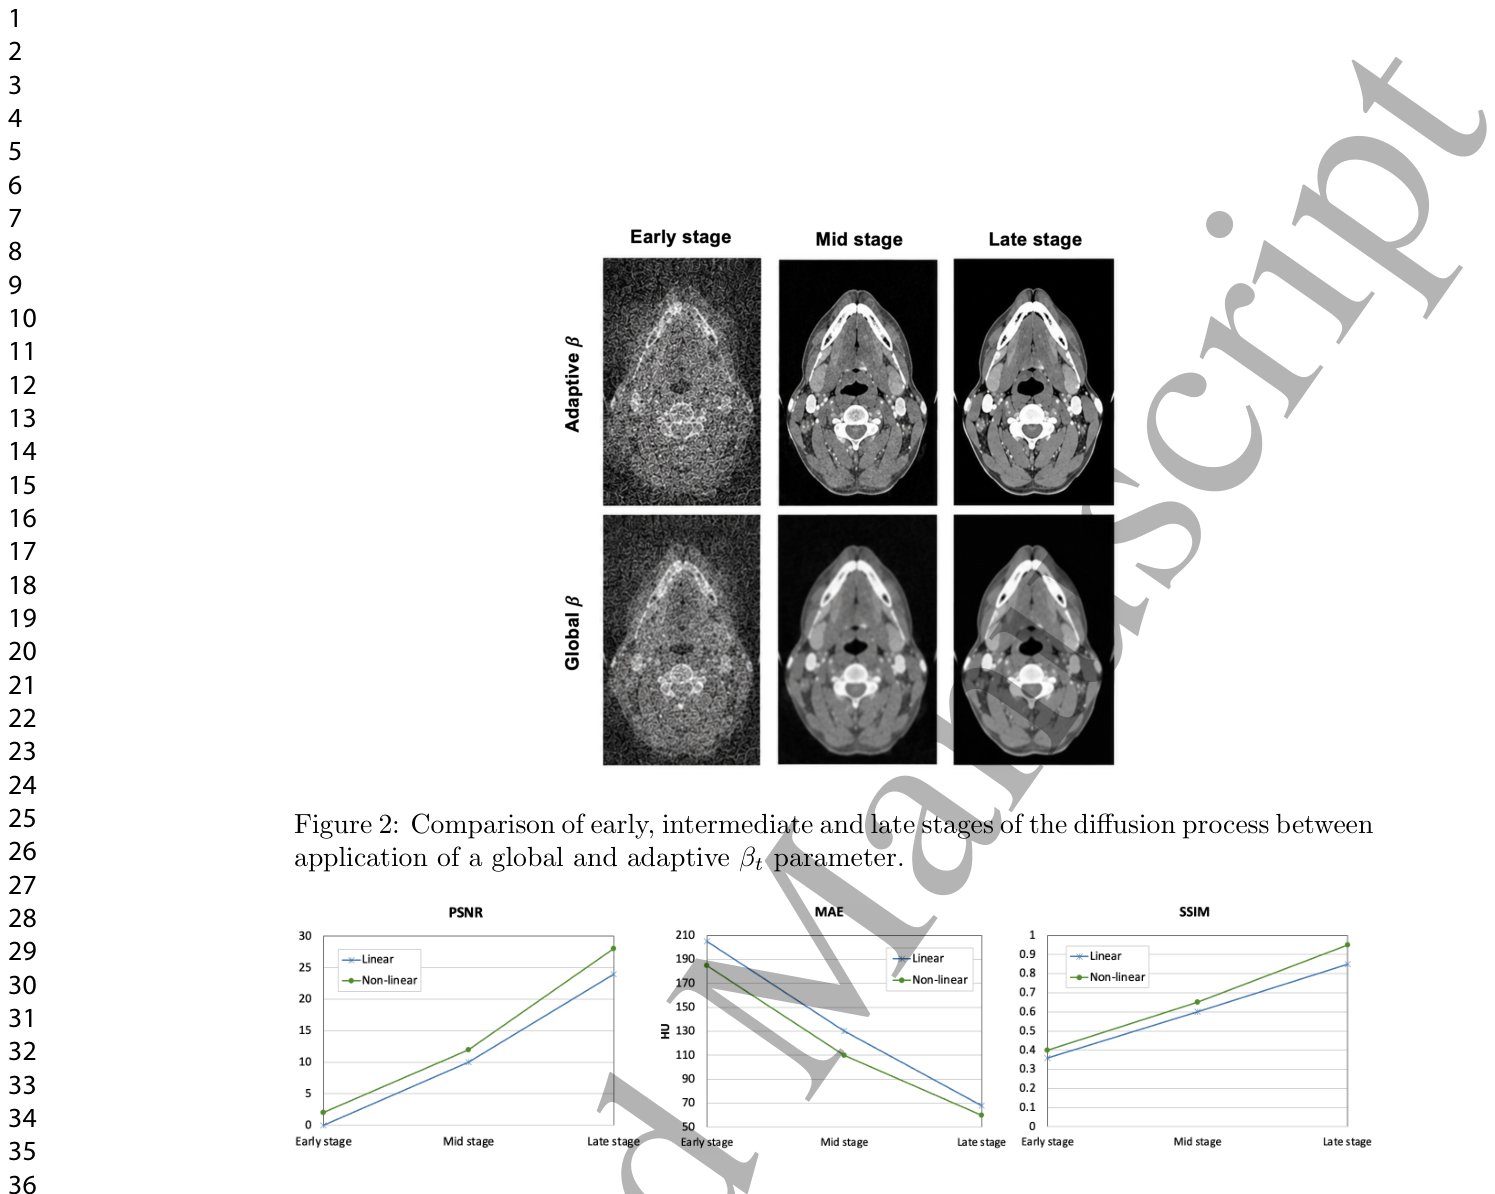
Figure 2. Figure 2: Comparison of early, intermediate and late stages of the diffusion process between application of a global and adaptive βt parameter.解説: この図は、拡散プロセスの初期、中間、後期段階における、グローバルなβパラメーターと適応型βパラメーターの適用間の比較を示しています。適応型βが適用された場合、ノイズ除去の進行がより効果的に行われ、画像がクリアになっていく様子が示唆されています。Figure 3. Figure 3: Metric variation curves over the full diffusion timeline for MAE, SSIM and PSNR, comparing linear and non-linear guidance parameter.解説: この図は、線形および非線形ガイダンスパラメーターを比較した、MAE、SSIM、およびPSNRの全拡散タイムラインにわたるメトリック変動曲線を示しています。非線形ガイダンスが線形ガイダンスよりも全ての指標で優れた性能を示していることがわかります。
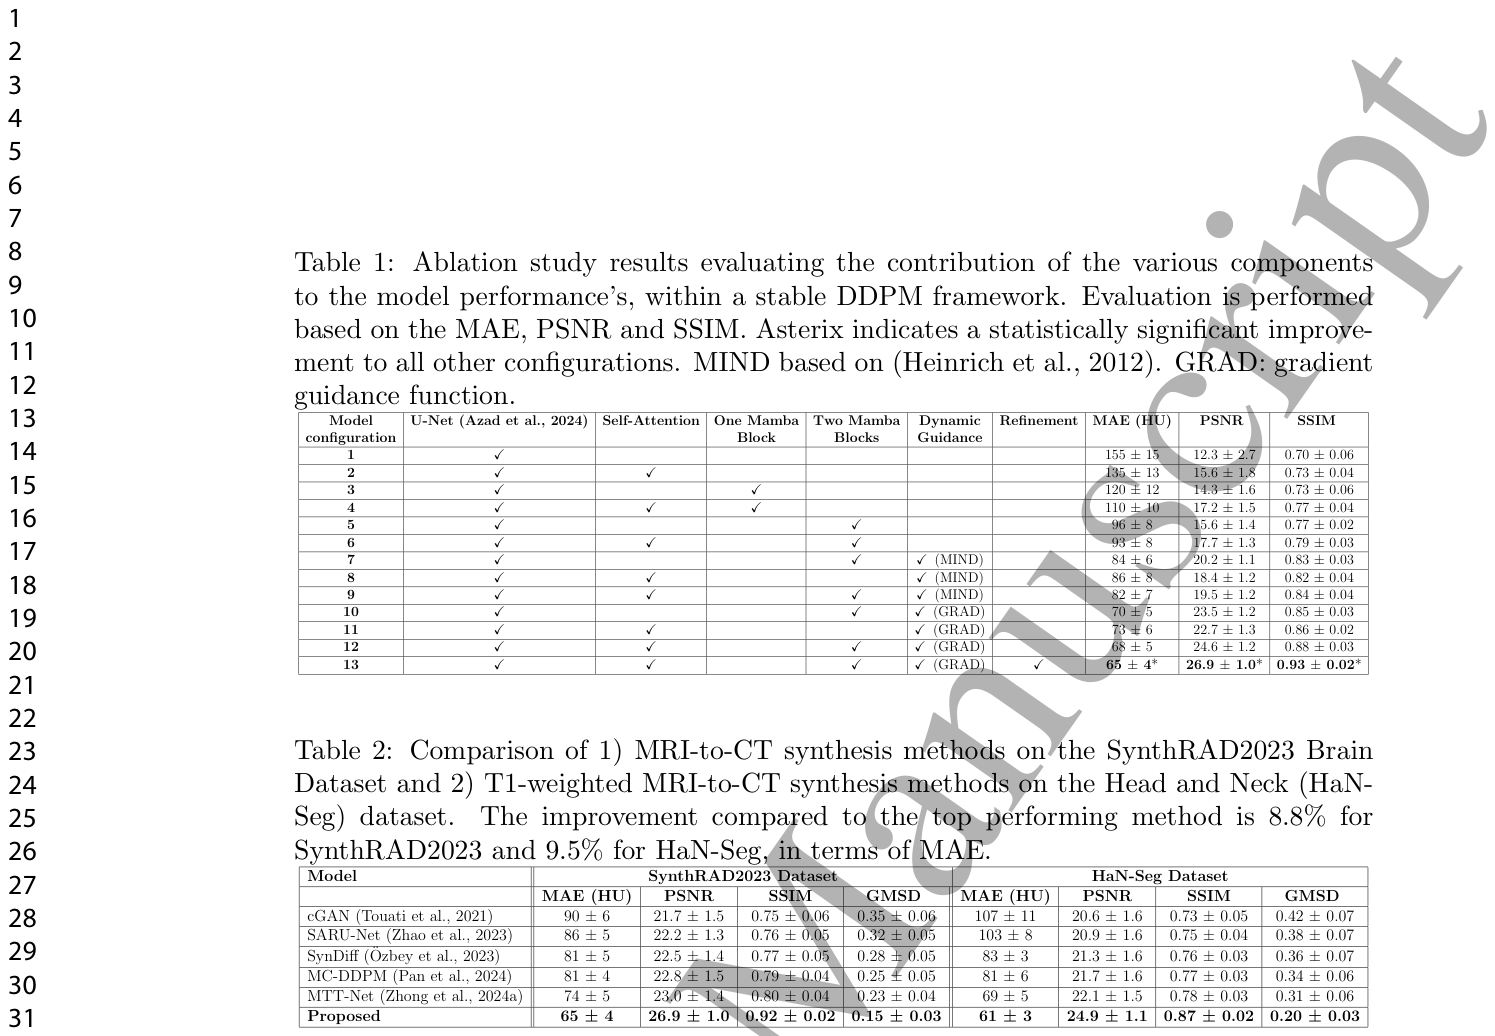
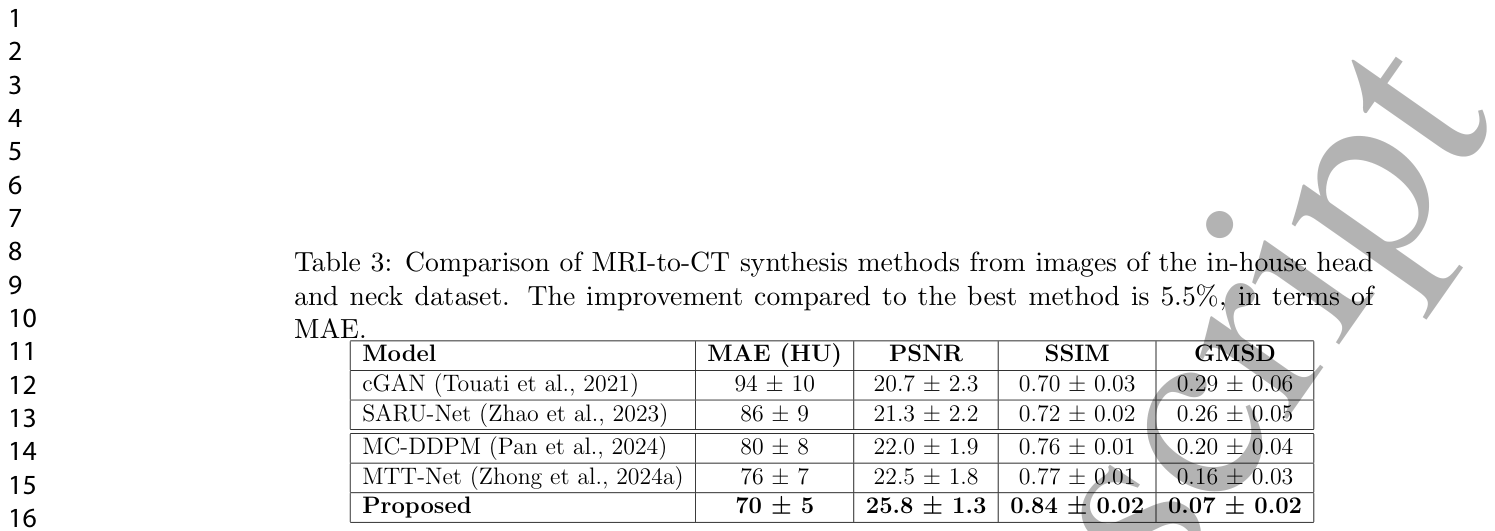
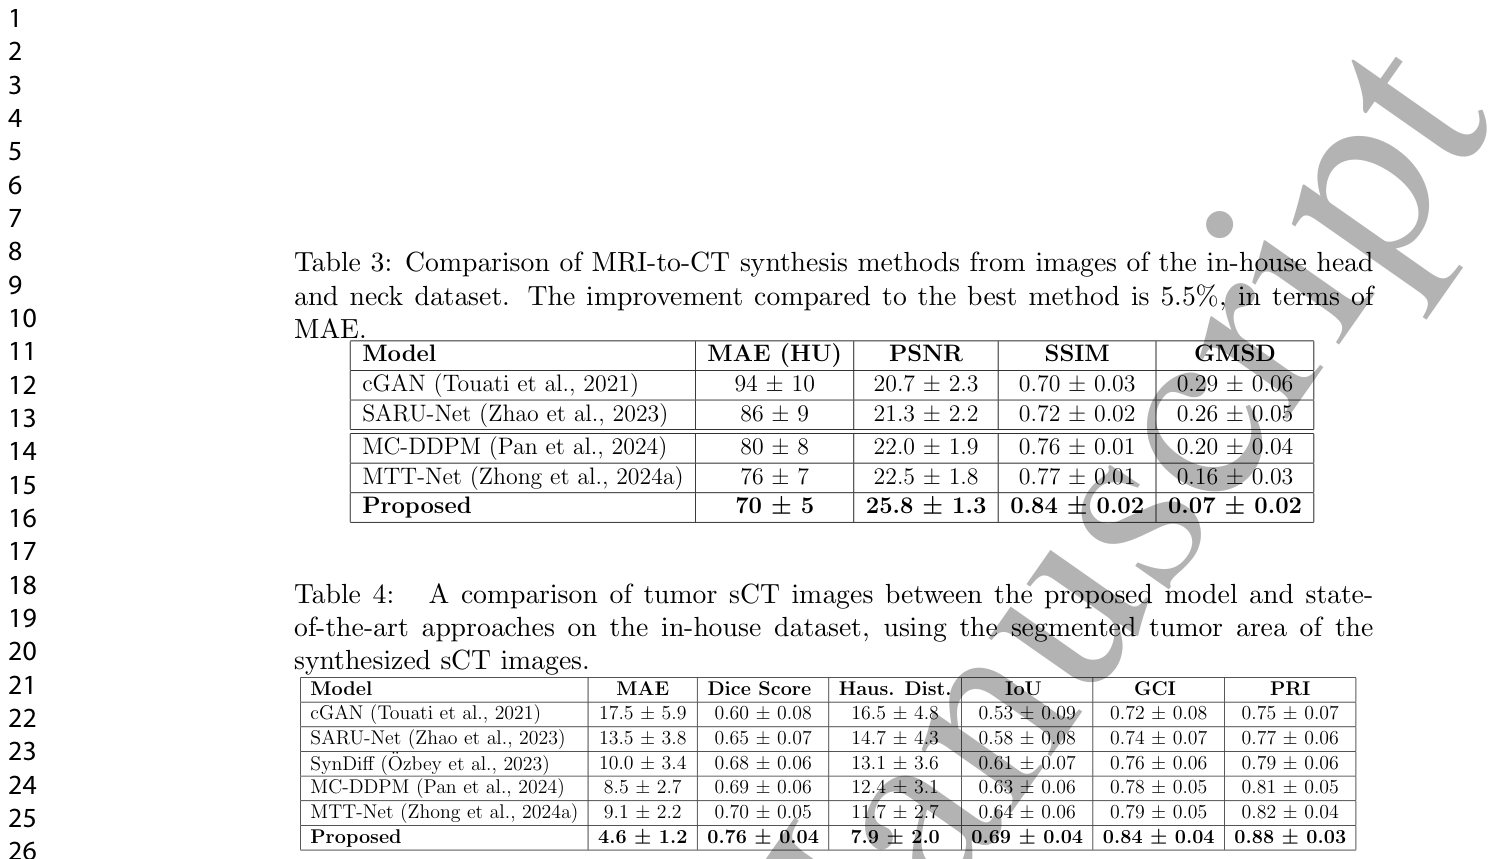
Table 2. Table 2: Comparison of 1) MRI-to-CT synthesis methods on the SynthRAD2023 Brain Dataset and 2) T1-weighted MRI-to-CT synthesis methods on the Head and Neck (HaN- Seg) dataset. The improvement compared to the top performing method is 8.8% for SynthRAD2023 and 9.5% for HaN-Seg, in terms of MAE.解説: この表は、1) SynthRAD2023脳データセットにおけるMRI-CT合成手法と、2) 頭頸部(HaN-Seg)データセットにおけるT1強調MRI-CT合成手法の比較結果です。提案モデルは、MAE、PSNR、SSIM、GMSDの全ての指標において、既存の最先端手法を上回る性能を示しています。Table 3. Table 3: Comparison of MRI-to-CT synthesis methods from images of the in-house head and neck dataset. The improvement compared to the best method is 5.5%, in terms of MAE.解説: この表は、院内頭頸部データセットの画像からのMRI-CT合成手法の比較結果です。提案モデルは、MAE、PSNR、SSIM、GMSDの全ての指標において、既存の最先端手法を上回る性能を示しています。
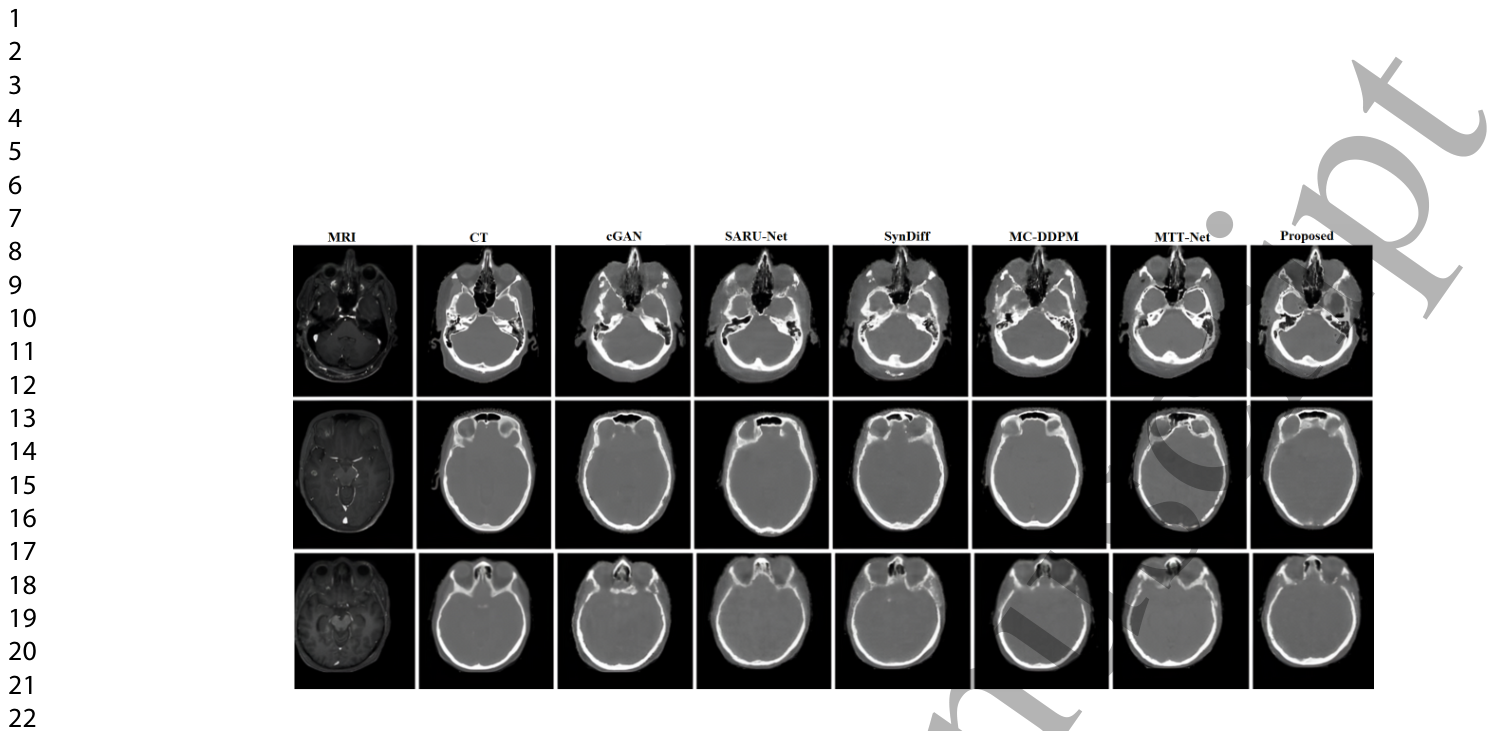
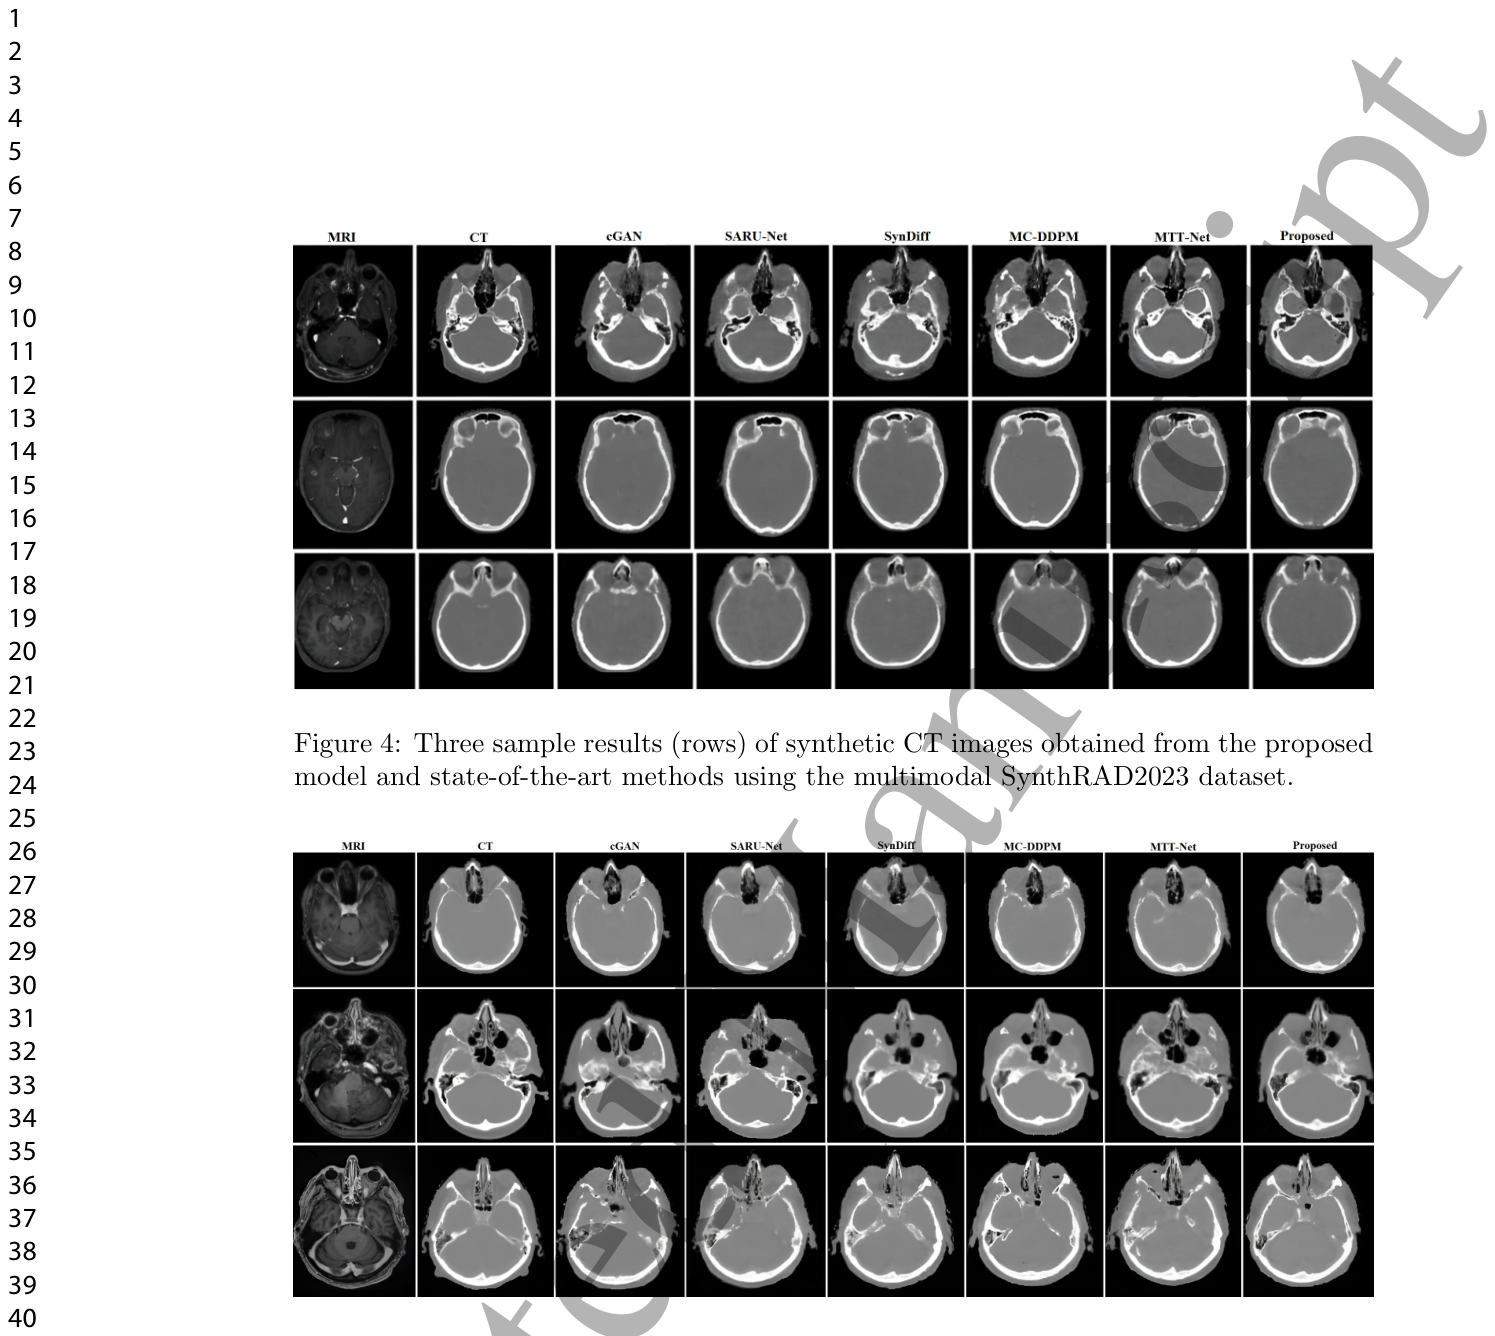
Figure 4. Figure 4: Three sample results (rows) of synthetic CT images obtained from the proposed model and state-of-the-art methods using the multimodal SynthRAD2023 dataset.解説: この図は、マルチモーダルSynthRAD2023データセットを使用して、提案モデルと既存の最先端手法から得られた合成CT画像の3つのサンプル結果(行)を示しています。MRI画像から生成された各モデルのCT画像を比較し、提案モデルがより鮮明で詳細なCT画像を生成していることがわかります。Figure 5. Figure 5: Three sample results (rows) of synthetic CT images obtained from the proposed model and state-of-the-art methods using the public Head and Neck (HaN-Seg) dataset.解説: この図は、公開されている頭頸部(HaN-Seg)データセットを使用して、提案モデルと既存の最先端手法から得られた合成CT画像の3つのサンプル結果(行)を示しています。MRI画像から生成された各モデルのCT画像を比較し、提案モデルがより鮮明で詳細なCT画像を生成していることがわかります。
腫瘍セグメンテーションと線量計画への応用
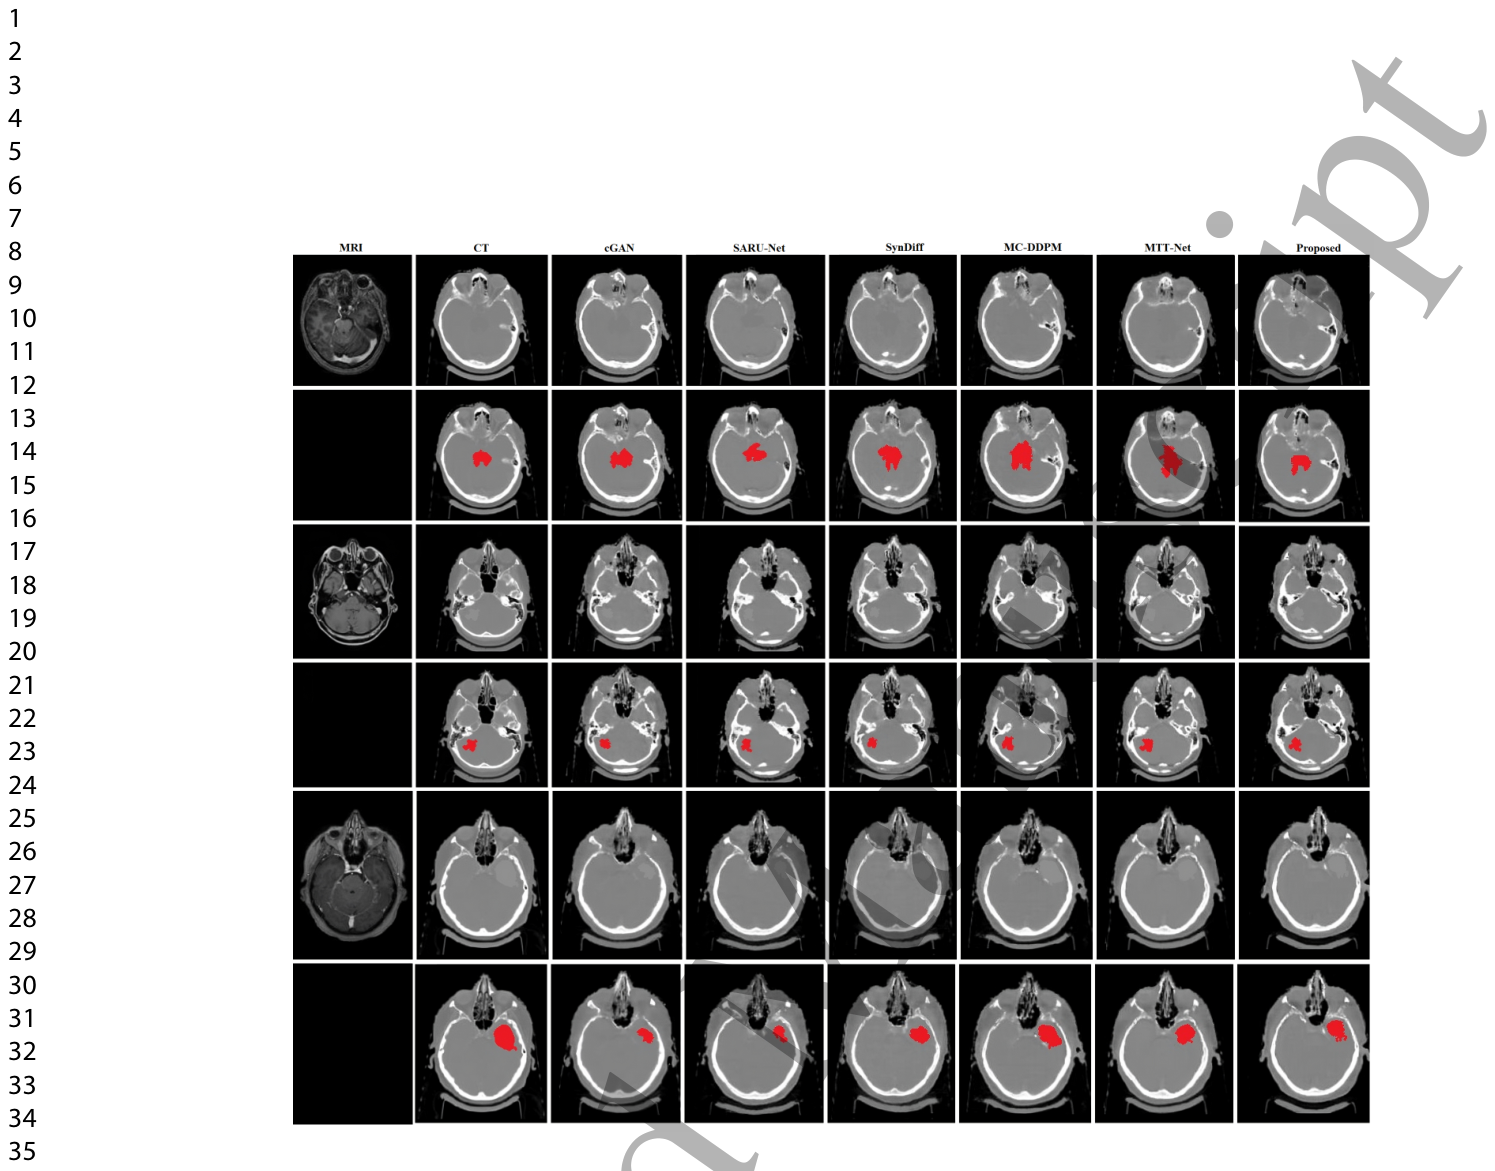
合成CT画像の品質を評価するため、特に放射線治療計画プロセスに腫瘍体積(GTV)を組み込むようなアプリケーションを想定し、sCT画像からの腫瘍セグメンテーション(画像中の特定領域の抽出)性能を評価しました。評価には、Diceスコア、Hausdorff距離、Intersection Over Union(IoU)、Geometric Consistency Index(GCI)、Precision-Recall Index(PRI)などのセグメンテーション指標が用いられました。本研究の合成モデルは、合成CT画像中の腫瘍領域の保持において、MAEが4.6±1.2 HUで、既存の最先端手法を上回りました。最も高いDiceスコア0.76±0.04を達成し、腫瘍領域との最高の重なりを示しています。また、最低のHausdorff距離7.9±2.0を達成し、最も正確な境界描写を反映しています。IoUは0.69±0.04、GCIは0.84±0.04、PRIは0.88±0.03を達成し、全体の性能とより良いセグメンテーションの一貫性を示しています。
Table 4. Table 4: A comparison of tumor sCT images between the proposed model and state- of-the-art approaches on the in-house dataset, using the segmented tumor area of the synthesized sCT images.解説: この表は、院内データセットにおける腫瘍sCT画像について、提案モデルと最先端アプローチの比較を示しており、合成されたsCT画像のセグメンテーションされた腫瘍領域が使用されています。提案モデルは、MAE、Diceスコア、Hausdorff距離、IoU、GCI、PRIの全ての指標において、他のモデルよりも優れた性能を示しています。Figure 6. Figure 6: Three tumor segmentation results (rows) performed on synthetic CTs of the brain using the in-house dataset, with bottom rows showing red areas highlighting the segmented tumor regions.解説: この図は、院内データセットを使用して、脳の合成CT画像に対して行われた3つの腫瘍セグメンテーション結果(行)を示しており、下部の行ではセグメンテーションされた腫瘍領域が赤く強調表示されています。提案モデルが他のモデルと比較して、腫瘍領域をより正確にセグメンテーションしていることが視覚的に示されています。
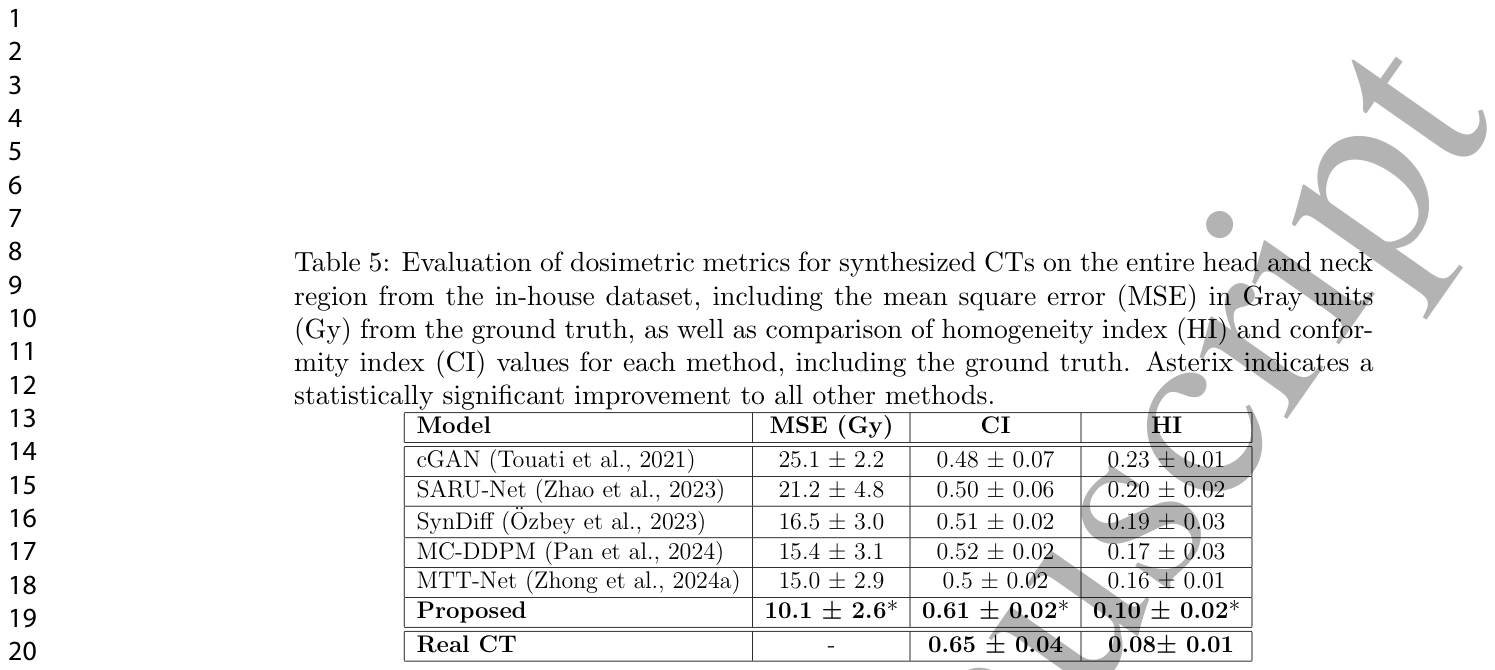
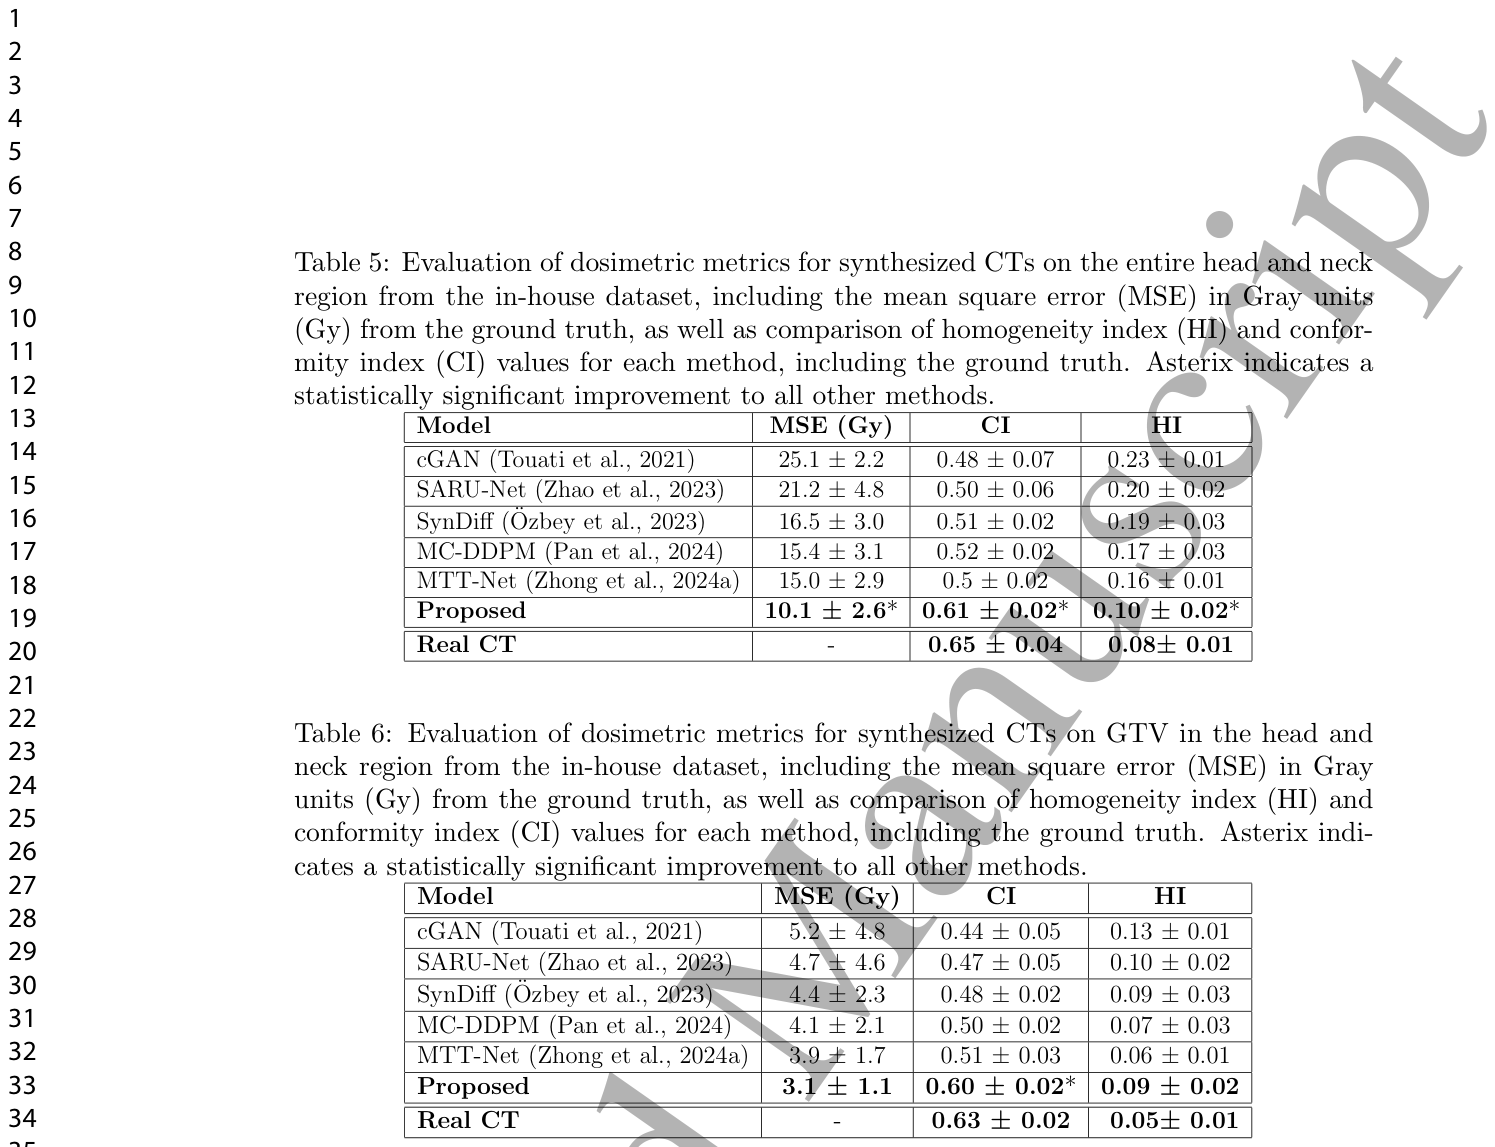
Table 5. Table 5: Evaluation of dosimetric metrics for synthesized CTs on the entire head and neck region from the in-house dataset, including the mean square error (MSE) in Gray units (Gy) from the ground truth, as well as comparison of homogeneity index (HI) and confor- mity index (CI) values for each method, including the ground truth. Asterix indicates a statistically significant improvement to all other methods.解説: この表は、院内データセットの頭頸部全体領域における合成CTの線量測定メトリックの評価を示しています。地上真実からのグレイ単位(Gy)での平均二乗誤差(MSE)に加え、均一性指標(HI)と適合度指標(CI)の値が各手法と地上真実について比較されています。提案モデルは、MSE、CI、HIの全てで他の方法と比較して統計的に有意な改善を示しています。
Table 6. Table 6: Evaluation of dosimetric metrics for synthesized CTs on GTV in the head and neck region from the in-house dataset, including the mean square error (MSE) in Gray units (Gy) from the ground truth, as well as comparison of homogeneity index (HI) and conformity index (CI) values for each method, including the ground truth. Asterix indi- cates a statistically significant improvement to all other methods.解説: この表は、院内データセットの頭頸部領域におけるGTV(肉眼的腫瘍体積)の合成CTの線量測定メトリックの評価を示しています。地上真実からのグレイ単位(Gy)での平均二乗誤差(MSE)に加え、均一性指標(HI)と適合度指標(CI)の値が各手法と地上真実について比較されています。提案モデルは、MSE、CI、HIの全てで他の方法と比較して統計的に有意な改善を示しています。
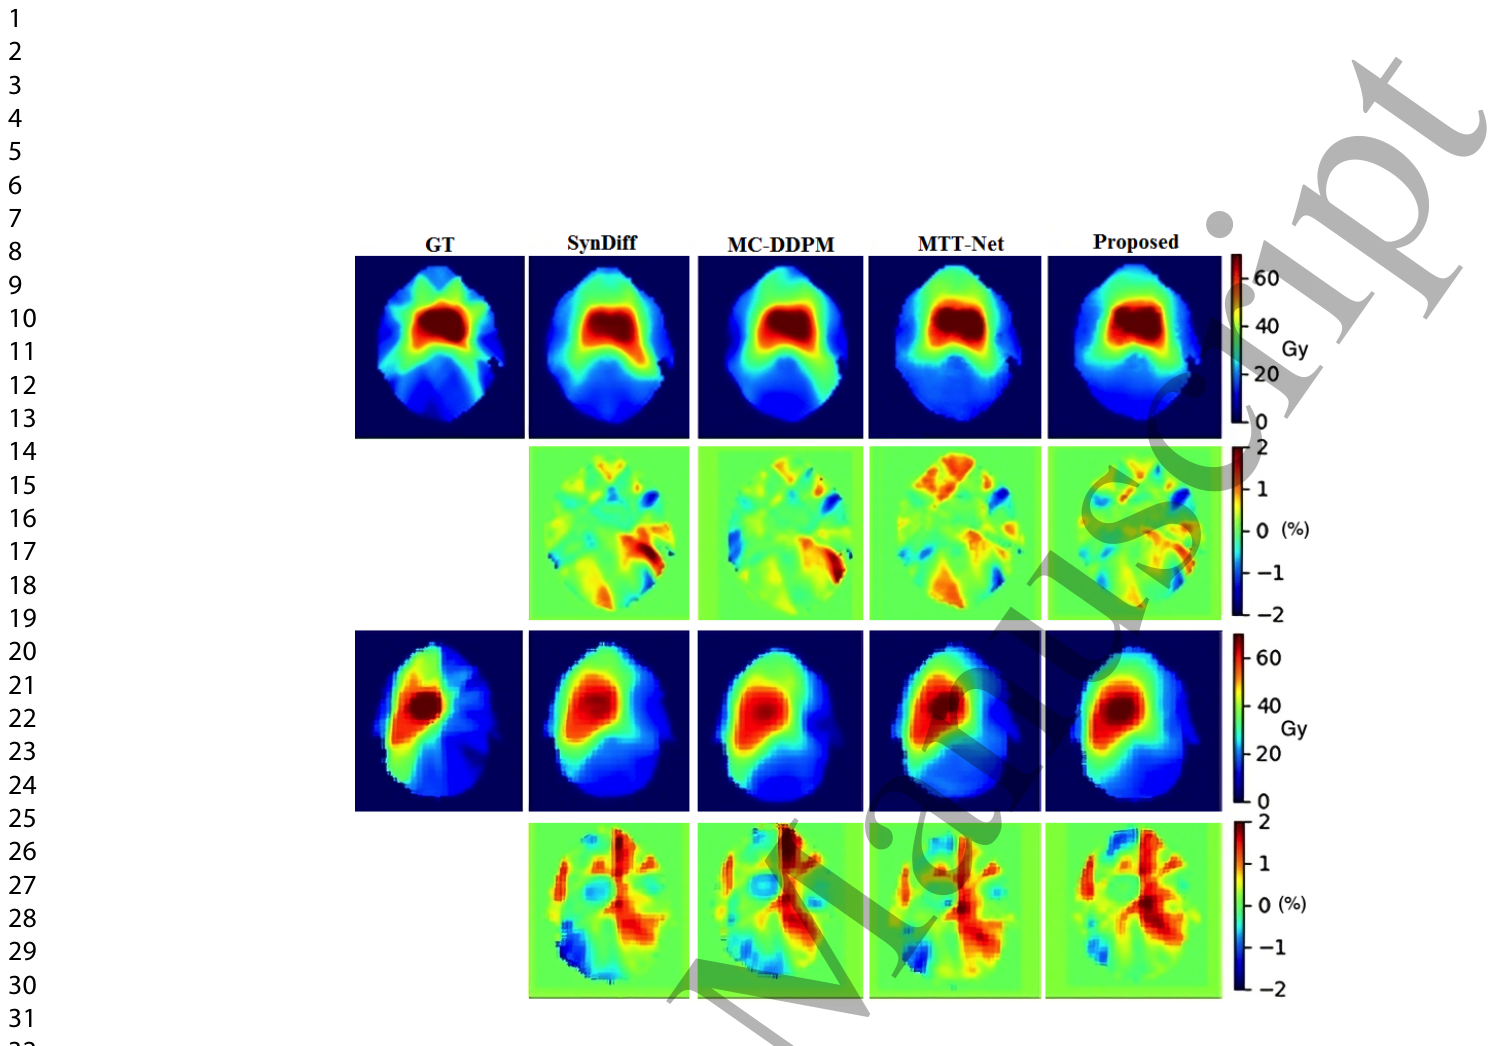
Figure 7. Figure 7: Visual comparison of two brain dose maps with the ground-truth CT dose map, as well as with their corresponding dose difference maps, using the in-house dataset. Units are in Gy for dose plan, while difference maps are in % .
Figure 8
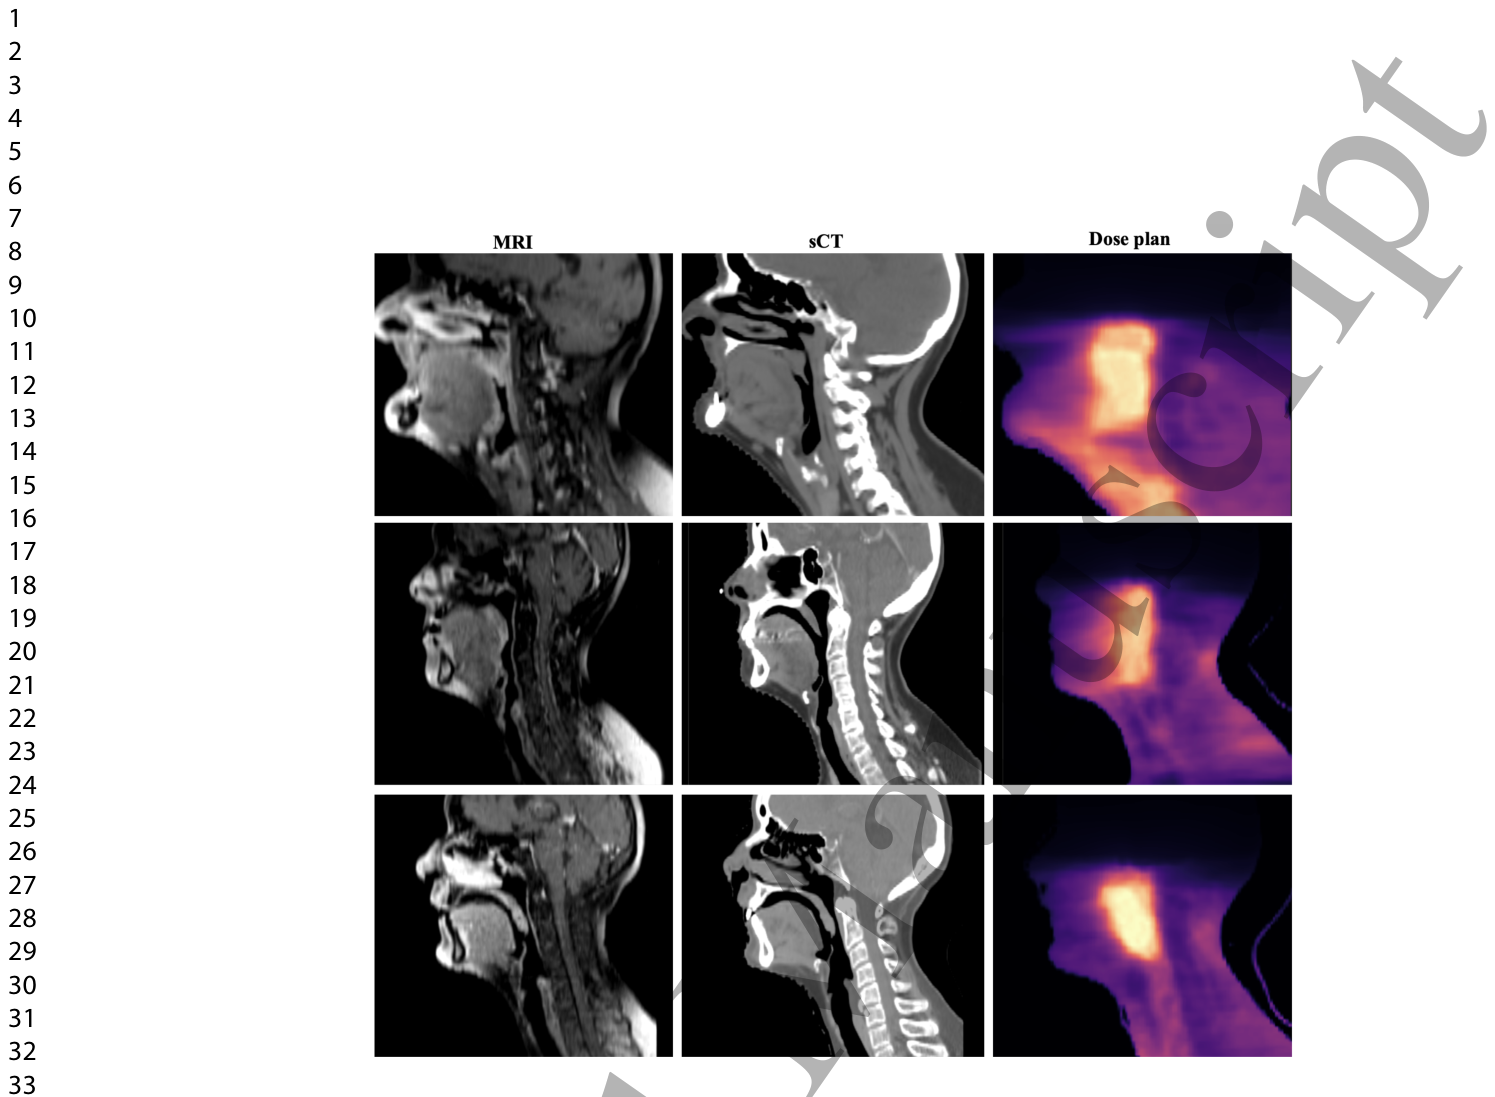
Figure 8. Figure 8: Three sample results from head and neck cancer cases (rows) from the in-house dataset, with generated plans (right column) using the sCT obtained from the proposed method.
Figure 9
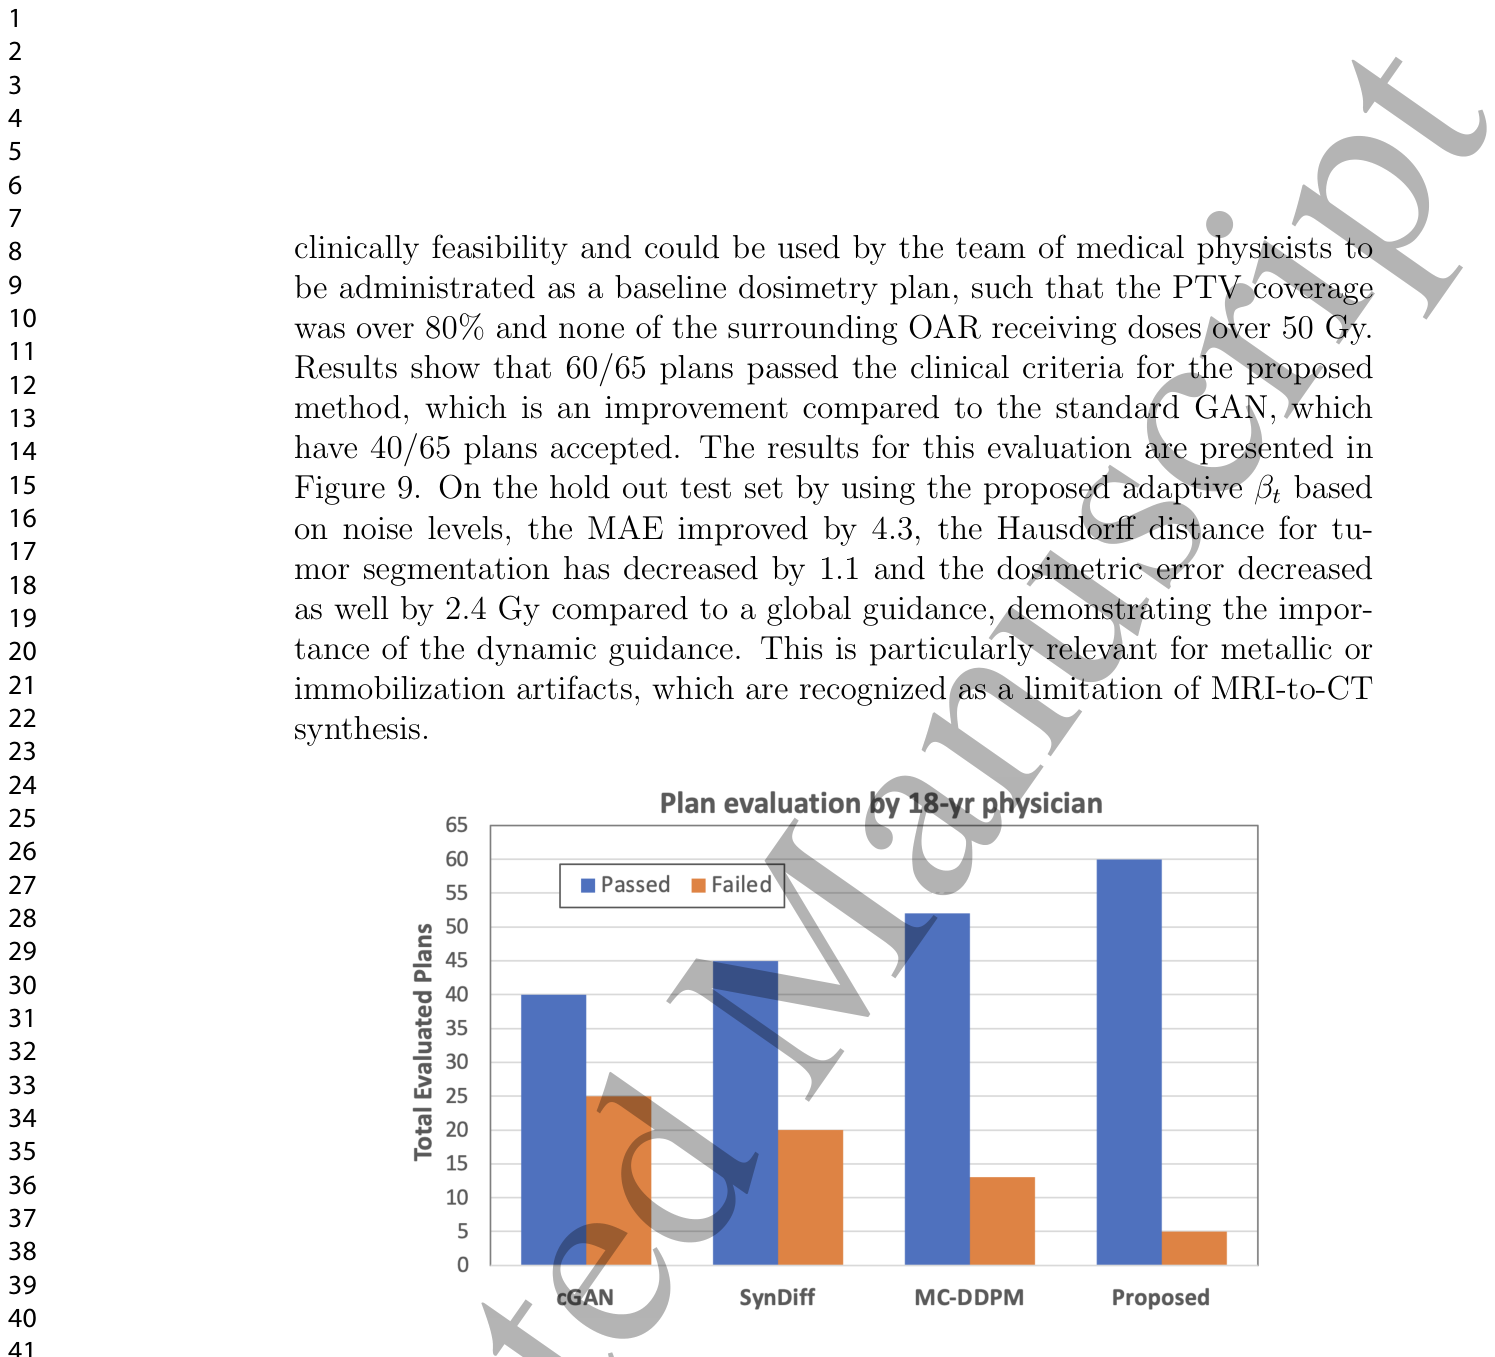
Figure 9. Figure 9: Evaluation of automatically plans by a 18-year-experienced physician. (Passed: clinically acceptable. Failed: is not be clinically approved based on PTV dose coverage or inadequate organ sparing.)
Table 1
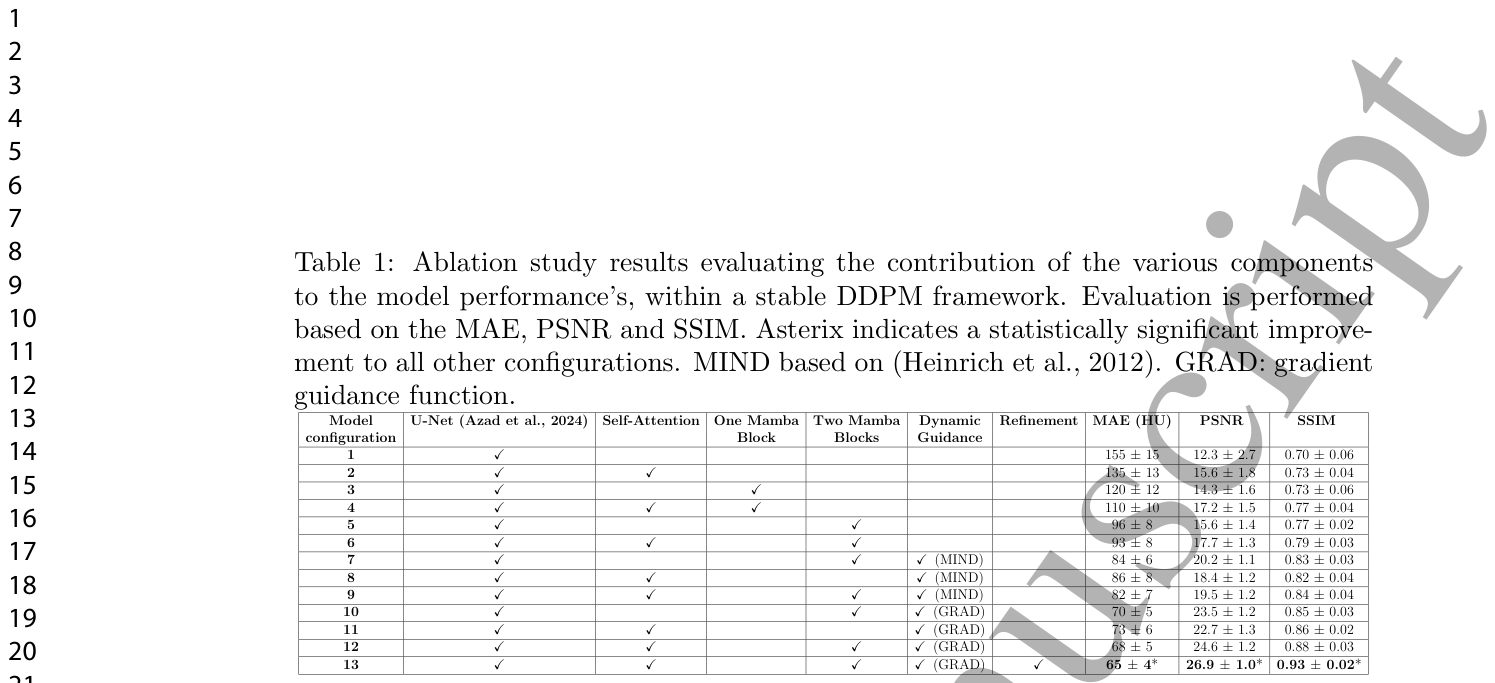
Table 1. Table 1: Ablation study results evaluating the contribution of the various components to the model performance’s, within a stable DDPM framework. Evaluation is performed based on the MAE, PSNR and SSIM. Asterix indicates a statistically significant improve- ment to all other configurations. MIND based on (Heinrich et al., 2012). GRAD: gradient guidance function.解説: この表は、安定したDDPMフレームワーク内での様々なコンポーネントがモデル性能に与える影響を評価するアブレーションスタディの結果をまとめたものです。MAE、PSNR、SSIMに基づいて評価されています。自己注意機構、Mambaブロック、動的ガイダンス戦略、リファインメントネットワークの各要素がモデル性能向上に寄与していることが示されています。
コメントを残す