どうも、Beyond the Pixelです。心臓の血管である冠動脈が狭くなる病気(冠動脈疾患)の治療として、経皮的冠動脈インターベンション(PCI)というカテーテルを用いた治療が広く行われています。このPCIを成功させる上で、冠動脈の石灰化を正確に評価することは非常に重要です。石灰化の存在や厚さが増すと、治療中の合併症のリスクが高まったり、ステント(血管を広げるための筒状の医療機器)が十分に拡張しない原因となったりすることが知られています。これまで、冠動脈内の画像を詳細に観察するために、光干渉断層計(OFDI)と血管内超音波(IVUS)という二つの異なる画像診断技術が使われてきました。OFDIは石灰化の形状や厚さを詳細に評価できますが、深い組織の観察が苦手で、脂質などの他のプラーク成分による信号減衰が課題でした。一方、IVUSはより深い組織を観察できますが、石灰化の厚さを正確に測ることが難しく、エコー輝度が高い領域と石灰化を区別しにくいという限界がありました。この研究では、これら二つの技術の長所を統合し、互いの弱点を補完するために開発された「デュアルセンサーシステム(DSS)」が、冠動脈石灰化の検出と特性評価において、単独のモダリティよりも優れた診断性能を発揮するかどうかを検証しました。この新しいシステムは、PCIの治療計画を立てる上で、より包括的な情報を提供する可能性を秘めています。
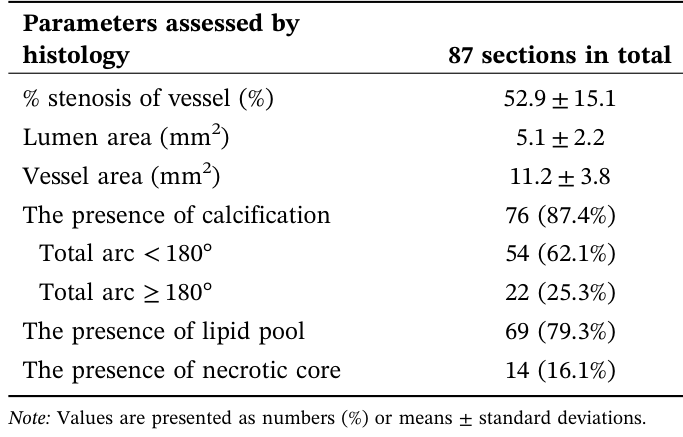
Table 1. TABLE 1 | Characteristics of histological sections used for imaging analysis.解説: この表は、画像解析に使用された組織切片の特性をまとめたものです。含まれるのは血管狭窄率、内腔面積、血管面積、石灰化の有無とその弧の角度、脂質プール、壊死性コアの有無などです。
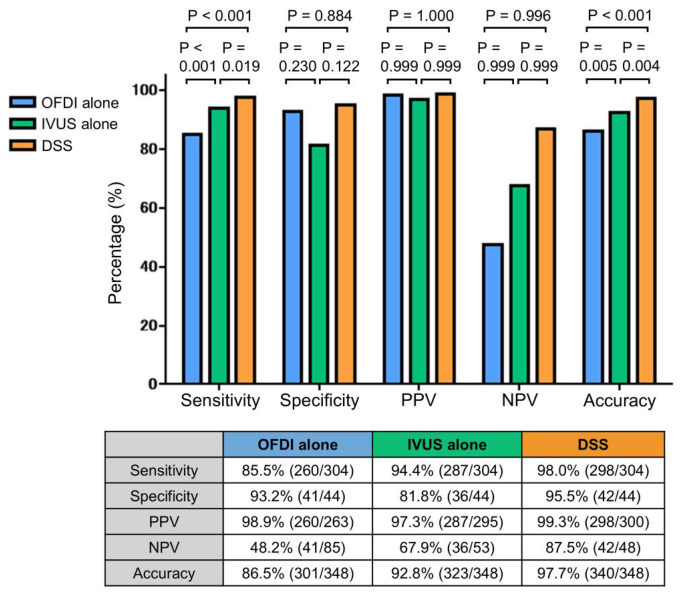
Figure 1. FIGURE 1 | Diagnostic performance for detecting coronary calcifi cation between the three modalities. Diagnostic metrics for detecting calcification using OFDI alone, IVUS alone, and DSS, derived from annotation data from all four observers. DSS achieved the highest scores across all metrics, with significant differences observed in both sensi tivity and accuracy. All comparisons and p values were calculated using generalized linear mixed models. DSS, dual sensor system; IVUS, intravascular ultrasound; NPV, negative predictive value; OFDI, optical frequency domain imaging; PPV, positive predictive value. [Color figure can be viewed at wileyonlinelibrary.com]解説: このグラフは、OFDI単独、IVUS単独、およびDSSそれぞれの冠動脈石灰化検出における診断性能(感度、特異度、陽性予測値、陰性予測値、正確度)を比較しています。DSSは感度と正確度において単一モダリティよりも有意に高い数値を示しています。
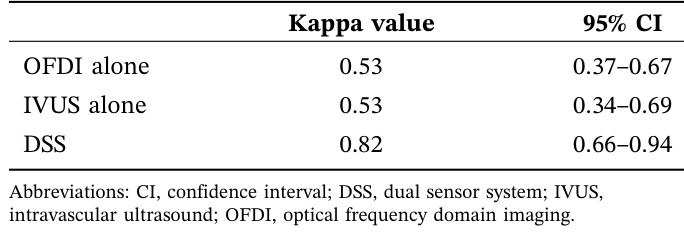
Table 2. TABLE 2 | Inter‐observer agreements for detecting any calcifica tion in OFDI, IVUS, and DSS.解説: この表は、OFDI単独、IVUS単独、およびDSSによる石灰化検出における4人の専門家間の意見の一致度(カッパ値と95%信頼区間)を比較しています。DSSは単一モダリティよりも高い一致度を示しました。
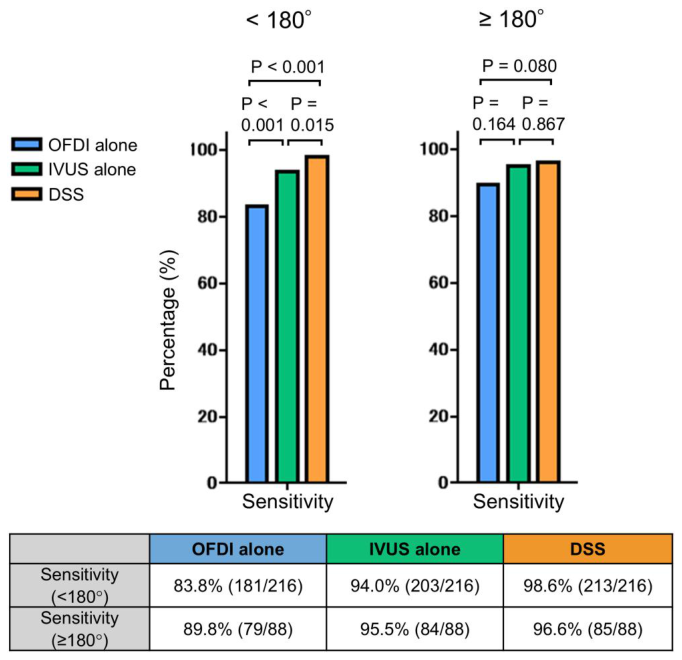
Figure 2. FIGURE 2 | Sensitivity for detecting calcification across calcifica tion arc categories. Sensitivities for detecting calcification using OFDI alone, IVUS alone, and DSS in sections with total calcification arcs < 180° and ≥ 180°. DSS presented significantly higher sensitivity for detecting calcification in sections with calcification arcs < 180°, whereas no significant differences were observed among the three modalities in sections with larger arcs. All comparisons and p values were calculated using generalized linear mixed models. DSS, dual sensor system; IVUS, intravascular ultrasound; OFDI, optical frequency domain imaging. [Color figure can be viewed at wileyonlinelibrary.com]解説: このグラフは、石灰化の弧の角度(180°未満と180°以上)別に、OFDI単独、IVUS単独、およびDSSの石灰化検出感度を比較しています。DSSは弧が180°未満の石灰化において特に高い感度を示しました。
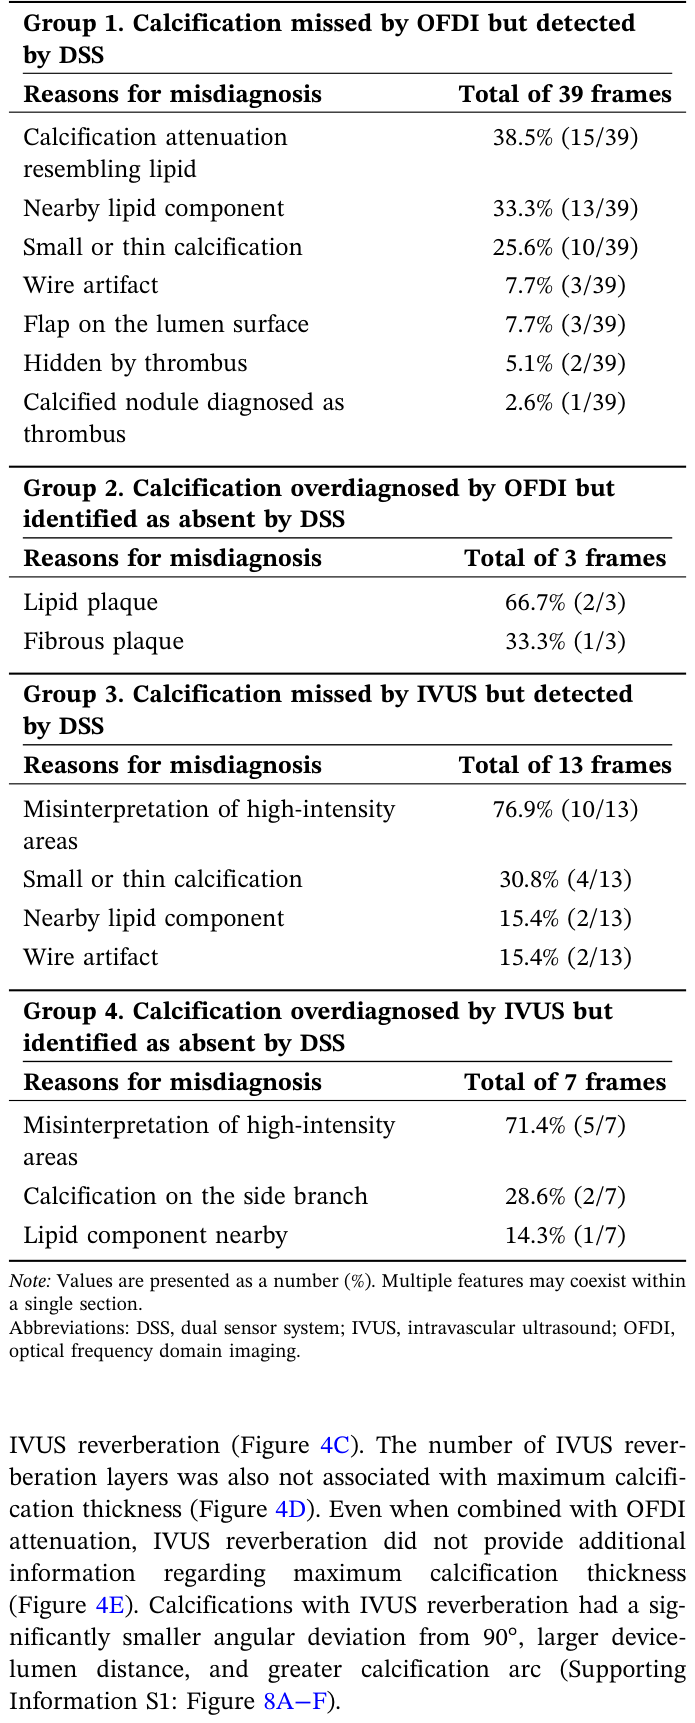
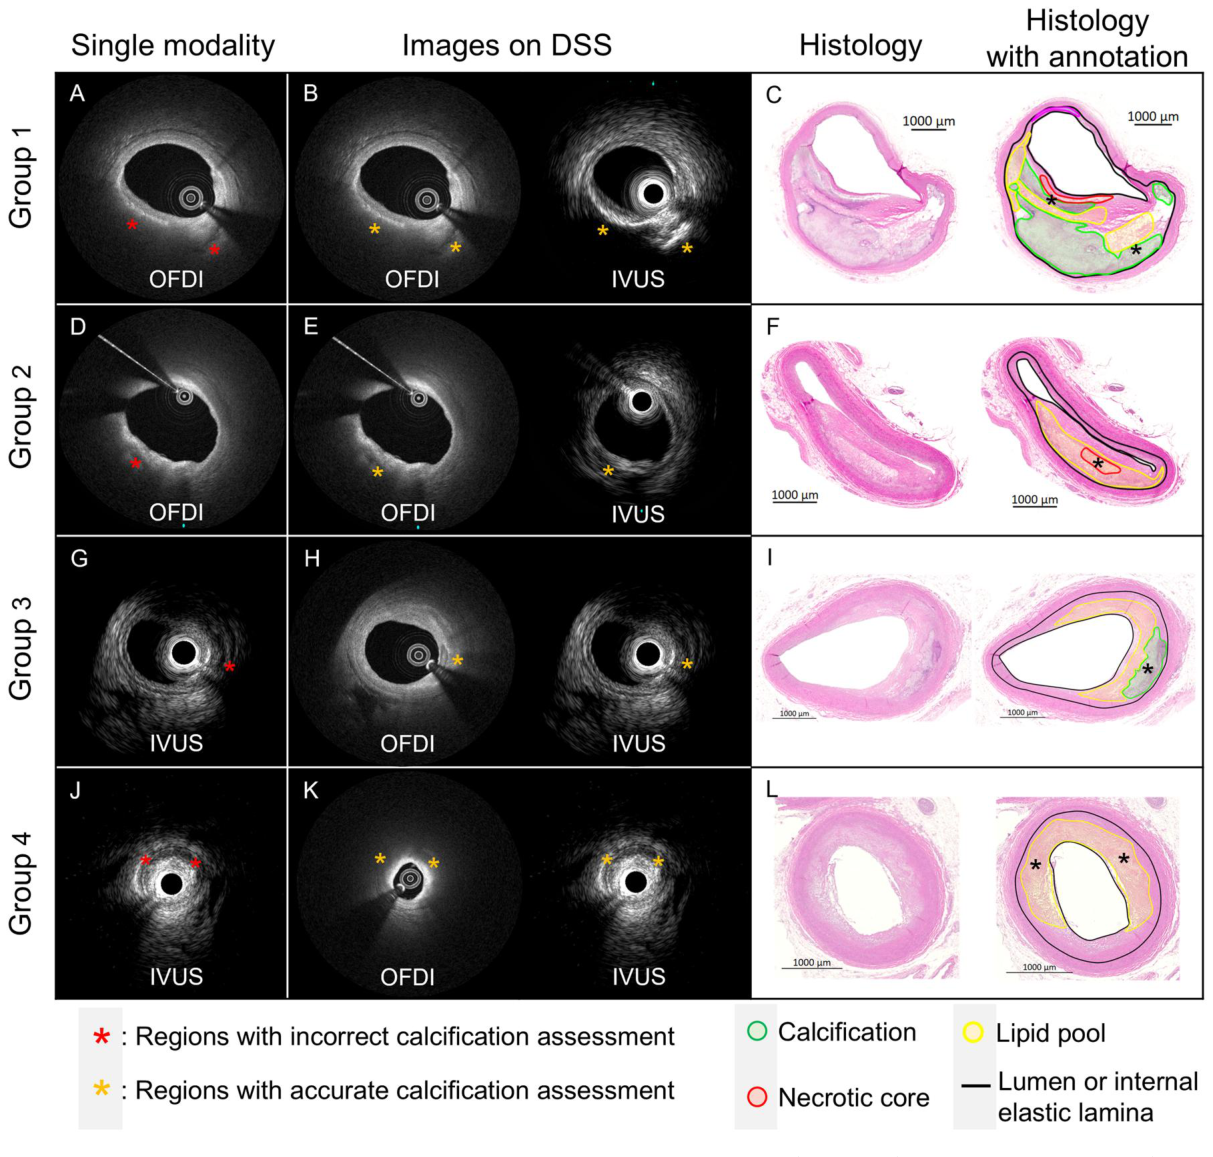
Figure 3. FIGURE 3 | Representative case in which calcification detection was improved by DSS. (A, D, G, J) Single‐modality images. (B, E, H, K) DSS images, with OFDI shown on the left and IVUS on the right. (C, F, I, L) Histological images stained with hematoxylin & eosin. The left panel shows the raw section, and the right panel shows the annotated image. Black asterisks in the histology indicate the region corresponding to asterisks in the OFDI and IVUS images. Group 1: The observer missed the calcification on OFDI alone (A, yellow asterisks) but correctly identified it on DSS with reference to the high‐echoic findings on IVUS (B, red asterisks). A necrotic core and lipid pool overlying the calcification (C) caused attenuation on OFDI. (Reason for misdiagnosis: nearby lipid component). Group 2: The observer overdiagnosed calcification on OFDI alone (D, red asterisk) but correctly identified its absence on DSS with reference to the low‐echoic findings on IVUS (E, yellow asterisks). The predominant lesion components were a lipid pool and a necrotic core (F). (Reason for misdiagnosis: lipid plaque). Group 3: The observer interpreted the high‐echoic lesion as fibrous plaque on IVUS alone because of minimal acoustic shadowing (G, yellow asterisk) but correctly identified calcification on DSS with reference to the distinct calcification border visible on OFDI (H, red asterisks). Histology confirmed the presence of calcification (I). (Reason for misdiagnosis: misinterpretation of high‐intensity areas). Group 4: The observer overdiagnosed calcification in a high‐echoic area on IVUS alone (J, red asterisks) but accurately recognized its absence on DSS by referencing the absence of calcified findings on OFDI (K, yellow asterisks). Histology showed that the predominant plaque component was a lipid pool (L). (Reason for misdiagnosis: misinterpretation of high‐intensity areas). Detailed histological images are shown in Supporting Information S1: Figure 6. DSS, dual sensor system; IVUS, intravascular ultrasound; OFDI, optical frequency domain imaging. [Color figure can be viewed at wileyonlinelibrary.com]解説: この図は、単一モダリティ(OFDIまたはIVUS)では石灰化の検出に誤りがあったものの、DSSでは正確に検出できた代表的な事例を示しています。各グループの画像は、単一モダリティ、DSS、および組織学的評価を並べて表示しています。
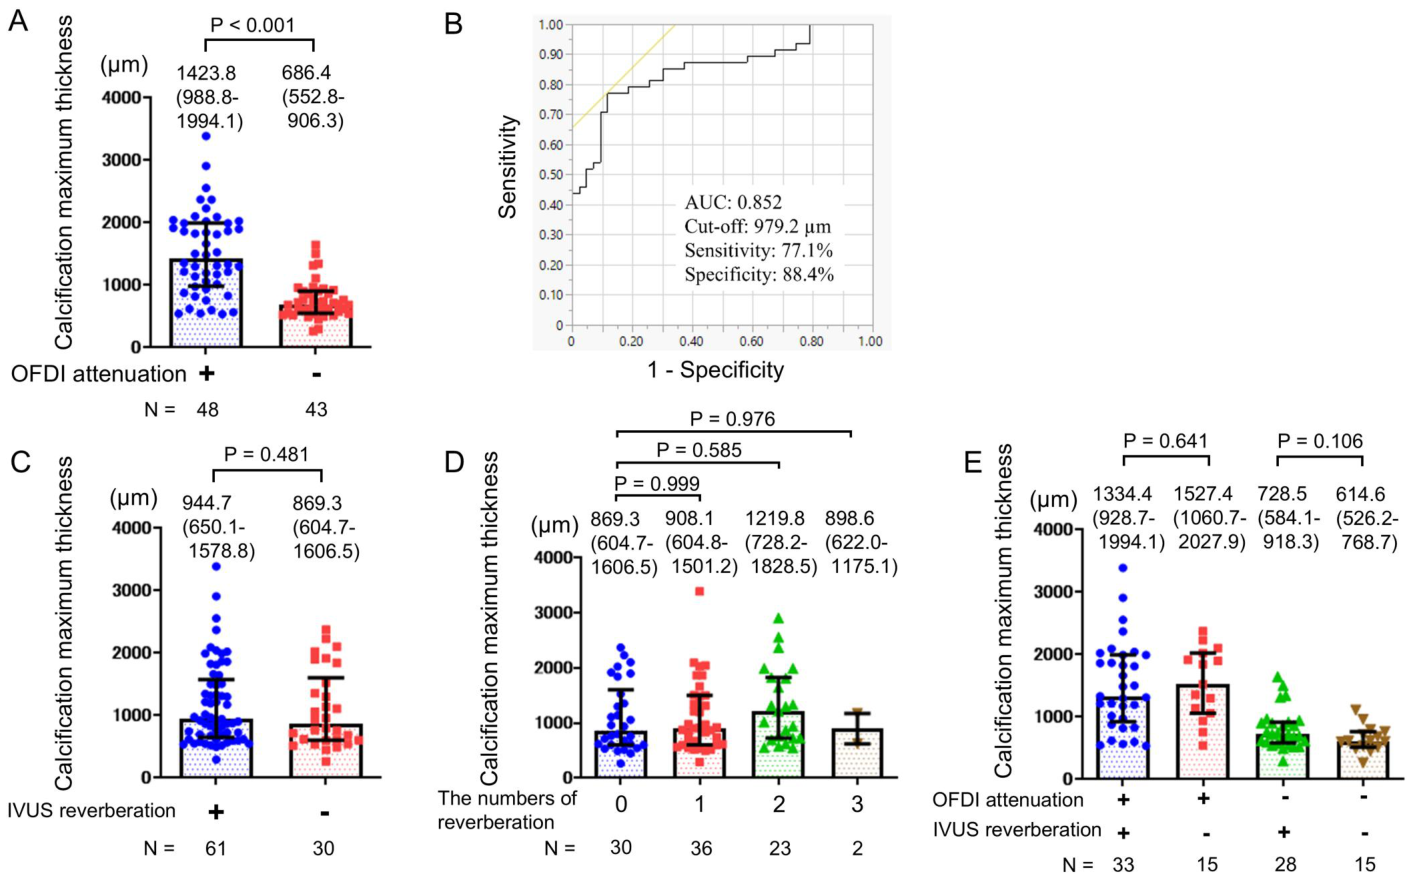
PCIの治療計画において、石灰化の有無だけでなくその厚さを知ることは非常に重要です。厚い石灰化は、ステントの留置を難しくし、治療後の成績にも影響を与える可能性があるためです。この研究では、OFDIの信号減衰とIVUSの残響アーチファクトが、石灰化の厚さを予測する指標となり得るかを検討しました。結果として、OFDI減衰が確認された石灰化は、減衰がなかったものと比較して、最大厚さが有意に大きいことが示されました(平均1423.8 µm vs 686.4 µm、p < 0.001)。
Figure 4. FIGURE 4 | Associations of OFDI attenuation and IVUS reverberation with maximum calcification thickness. (A) Comparison of maximum calcification thickness between calcifications with and without OFDI attenuation. (B) Receiver operating characteristic curve for OFDI attenuation positivity based on maximum calcification thickness. (C−E) Comparison of maximum calcification thickness according to the presence or absence of IVUS reverberation (C), the number of IVUS reverberations (D), and the combination of OFDI attenuation and IVUS reverberation (E). Calcifications with OFDI attenuation had significantly greater maximum calcification thickness, with a cutoff of 979.2 µm for positive attenuation. IVUS rever beration and the number of reverberations were not associated with maximum calcification thickness. Bars and error bars represent the median and interquartile range. AUC, area under the curve; IVUS, intravascular ultrasound; OFDI, optical frequency domain imaging. [Color figure can be viewed at wileyonlinelibrary.com]解説: この図は、OFDI減衰とIVUS残響が最大石灰化厚さとどのように関連するかを示しています。OFDI減衰がある場合、石灰化の最大厚さが有意に厚いことが示されており、979.2 µmを超える厚さを予測するカットオフ値が示されています。一方、IVUS残響は最大石灰化厚さとは関連がありませんでした。
コメントを残す