どうも、Beyond the Pixelです。脳の健康状態を評価するために、脳血流(CBF)や血液脳関門(BBB)の機能解析は非常に重要です。動脈スピンラベリング(ASL)MRIは、造影剤や放射線被曝なしに、脳の各領域への血流(灌流)を定量的に測定できる唯一の非侵襲的な技術として、脳血管障害、神経変性疾患、精神疾患などの臨床評価に広く採用されています。CBFだけでなく、ASLは動脈通過時間(ATT)、血液脳関門(BBB)水交換時間、血液脳脊髄液関門(BCB)水交換時間といった、より詳細な神経血管パラメータの測定にも拡張され、脳の血行動態と微小血管機能の包括的な特性評価が可能になっています。しかし、マルチパラメトリックな神経血管イメージング、特に複数のポストラベル遅延時間(PLD)やエコー時間(TE)、繰り返しのコントロール-ラベル収集を組み合わせた場合、スキャン時間が大幅に長くなるという大きな課題がありました。例えば、最近提案されたエコー時間分解ASL(TASL)では、14エコー、4組のコントロール-ラベル測定、36スライス、4PLDの全脳プロトコルで、一般的な高速撮像技術を組み合わせても約1時間を要します。このような長時間スキャンは、対象者の負担を増やし、動きによるアーチファクトのリスクを高めるため、臨床現場での実用性を阻害しています。この研究は、この課題を解決するため、複数の次元でデータを効率的に収集し、それを高度な数学的手法で再構成することで、高速かつ正確なマルチパラメトリックASL MRIを実現する新しいフレームワークを開発しました。
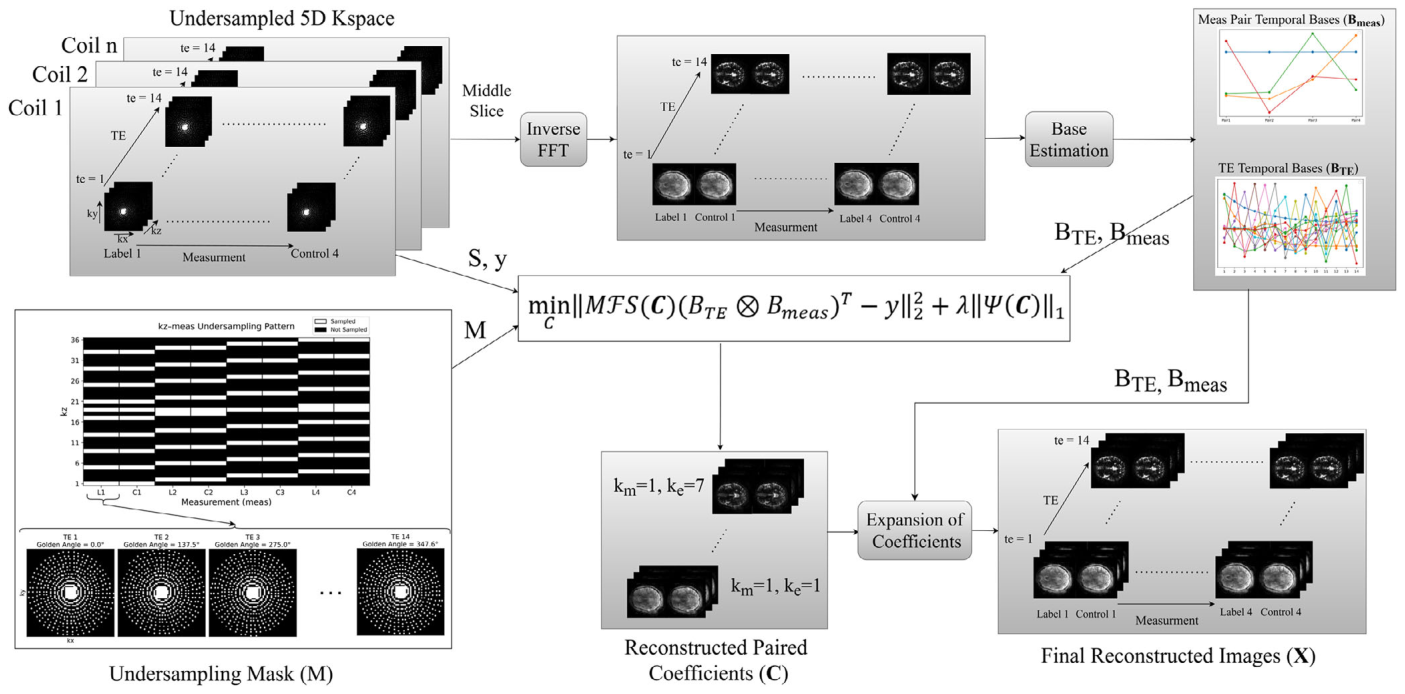
Figure 1. FIGURE 1 | Block diagram of the full reconstruction pipeline. Undersampled multi-coil k-space data are first acquired using the proposed sampling strategy (Figure 2). Temporal bases are then estimated from a fully sampled reference slice using PCA (Figure 3). Finally, subspace coefficient maps are reconstructed using a sparsity-regularized optimization framework, and the full image is recovered by projecting onto the learned subspace. This integrated approach enables accurate reconstruction under severe undersampling.解説: フル再構成パイプラインのブロック図です。アンダーサンプリングされたマルチコイルk空間データが取得され、完全にサンプリングされた中央スライスから時間基底が推定されます。その後、スパース性正則化された最適化フレームワークを使用してサブスペース係数マップが再構成され、学習されたサブスペースに投影することで完全な画像が回復されます。この統合されたアプローチにより、厳しいアンダーサンプリング条件下でも正確な再構成が可能になります。
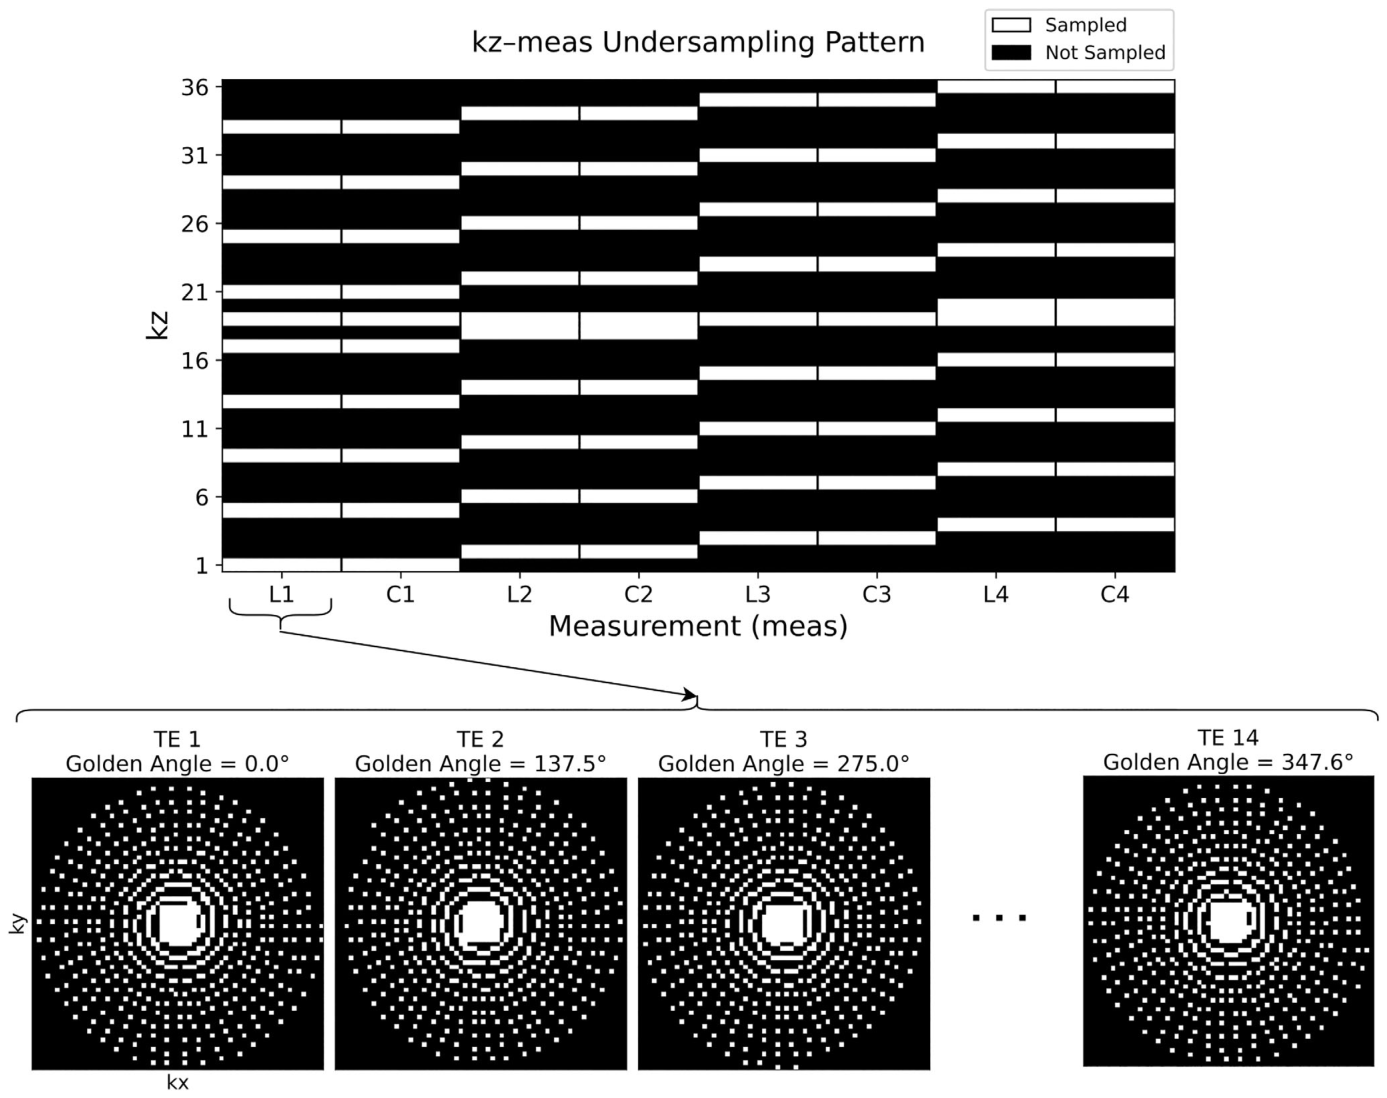
Figure 2. FIGURE 2 | Illustration of the proposed sampling pattern in the 𝑘x –𝑘y plane across echo times (TE), and the 𝑘z –measurement domain. In-plane sampling uses a golden-angle rotated Cartesian pattern with variable density and a fully sampled central region (ACS), providing complementary k-space coverage across TEs. Through-plane sampling distributes control–label measurements across slices, with full sampling in the central 𝑘z region. Together, these strategies enable high acceleration while preserving reconstructability through shared temporal structure.解説: エコー時間(TE)にわたるkx–ky面およびkz–測定ドメインにおける提案サンプリングパターンの図です。面内サンプリングはゴールデンアングル回転カーテシアンパターンで可変密度かつ中央領域は完全にサンプリングされており、TE全体にわたって相補的なk空間カバレッジを提供します。面貫通サンプリングはコントロール–ラベル測定をスライス全体に分散させ、中央のkz領域はすべての測定で完全にサンプリングされます。これらの戦略は、共有された時間構造を通じて高い加速率と再構成可能性を両立させます。
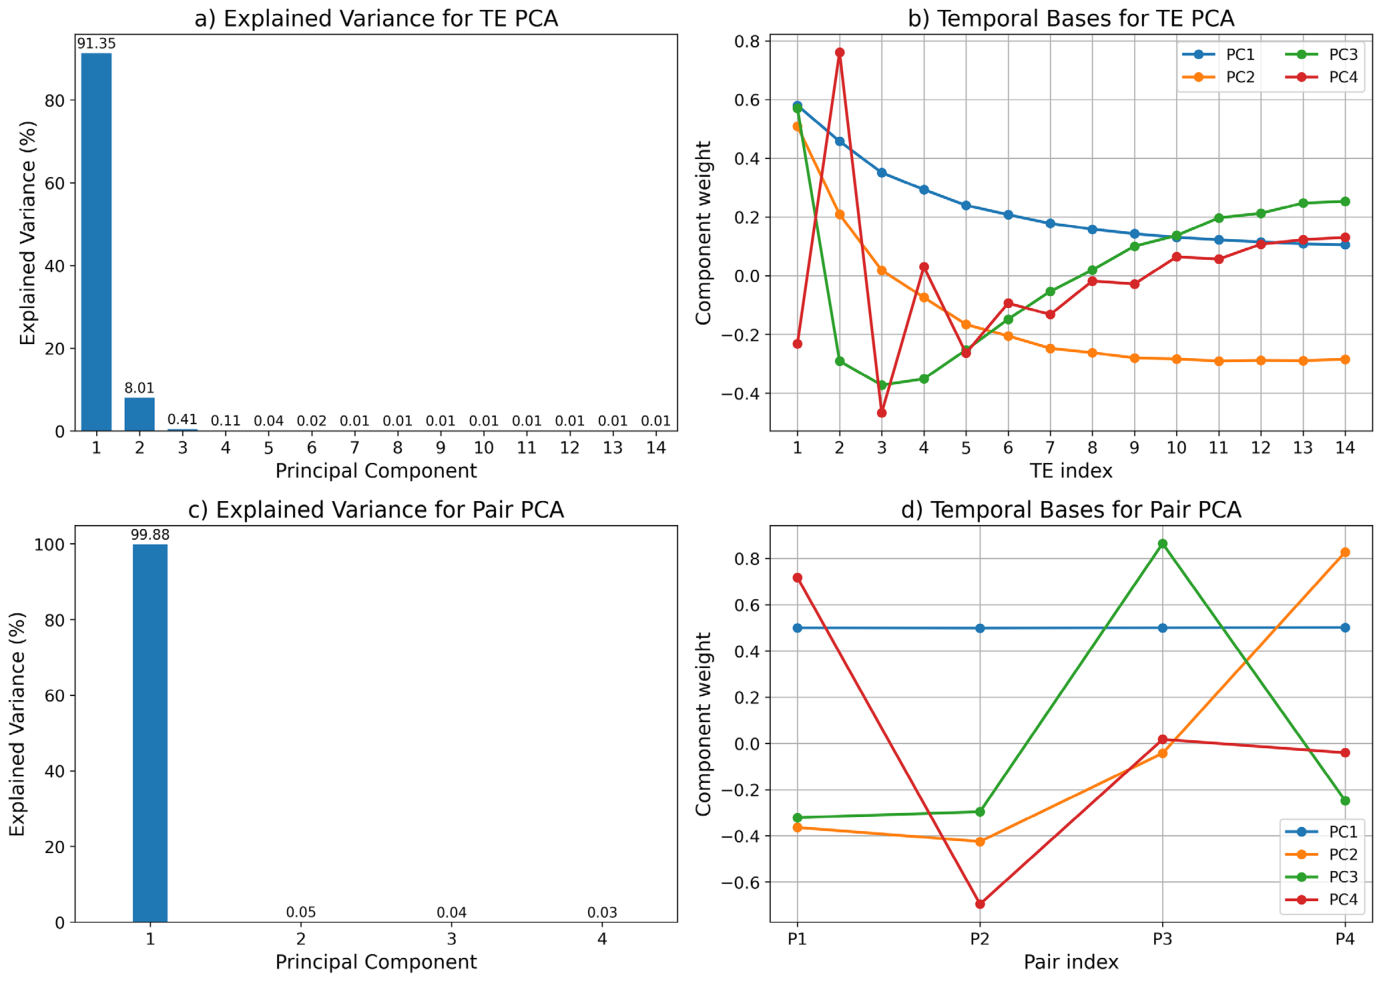
Figure 3. FIGURE 3 | Principal component analysis (PCA) of the echo time (TE) and pair (control–label) dimensions, estimated from a fully sampled middle slice. (a) Explained variance of the TE PCA components. (b) Temporal basis functions corresponding to the first four TE principal components. (c) Explained variance of the Pair PCA components. (d) Temporal basis functions corresponding to the Pair PCA components. The explained variance plots demonstrate that the signal can be accurately represented within a low-rank subspace, with only a small number of principal components capturing the dominant temporal dynamics. This observation supports the proposed dimensionality reduction strategy and enables efficient image reconstruction.解説: 完全にサンプリングされた中央スライスから推定された、エコー時間(TE)次元とペア(コントロール–ラベル)次元の主成分分析(PCA)の結果です。(a)TE PCAコンポーネントの説明分散を示します。(b)最初の4つのTE主成分に対応する時間基底関数です。(c)ペアPCAコンポーネントの説明分散を示します。(d)ペアPCAコンポーネントに対応する時間基底関数です。説明分散のプロットは、少数の主成分が主要な時間的動態を捉えるため、信号が低ランクサブスペース内で正確に表現できることを示しています。
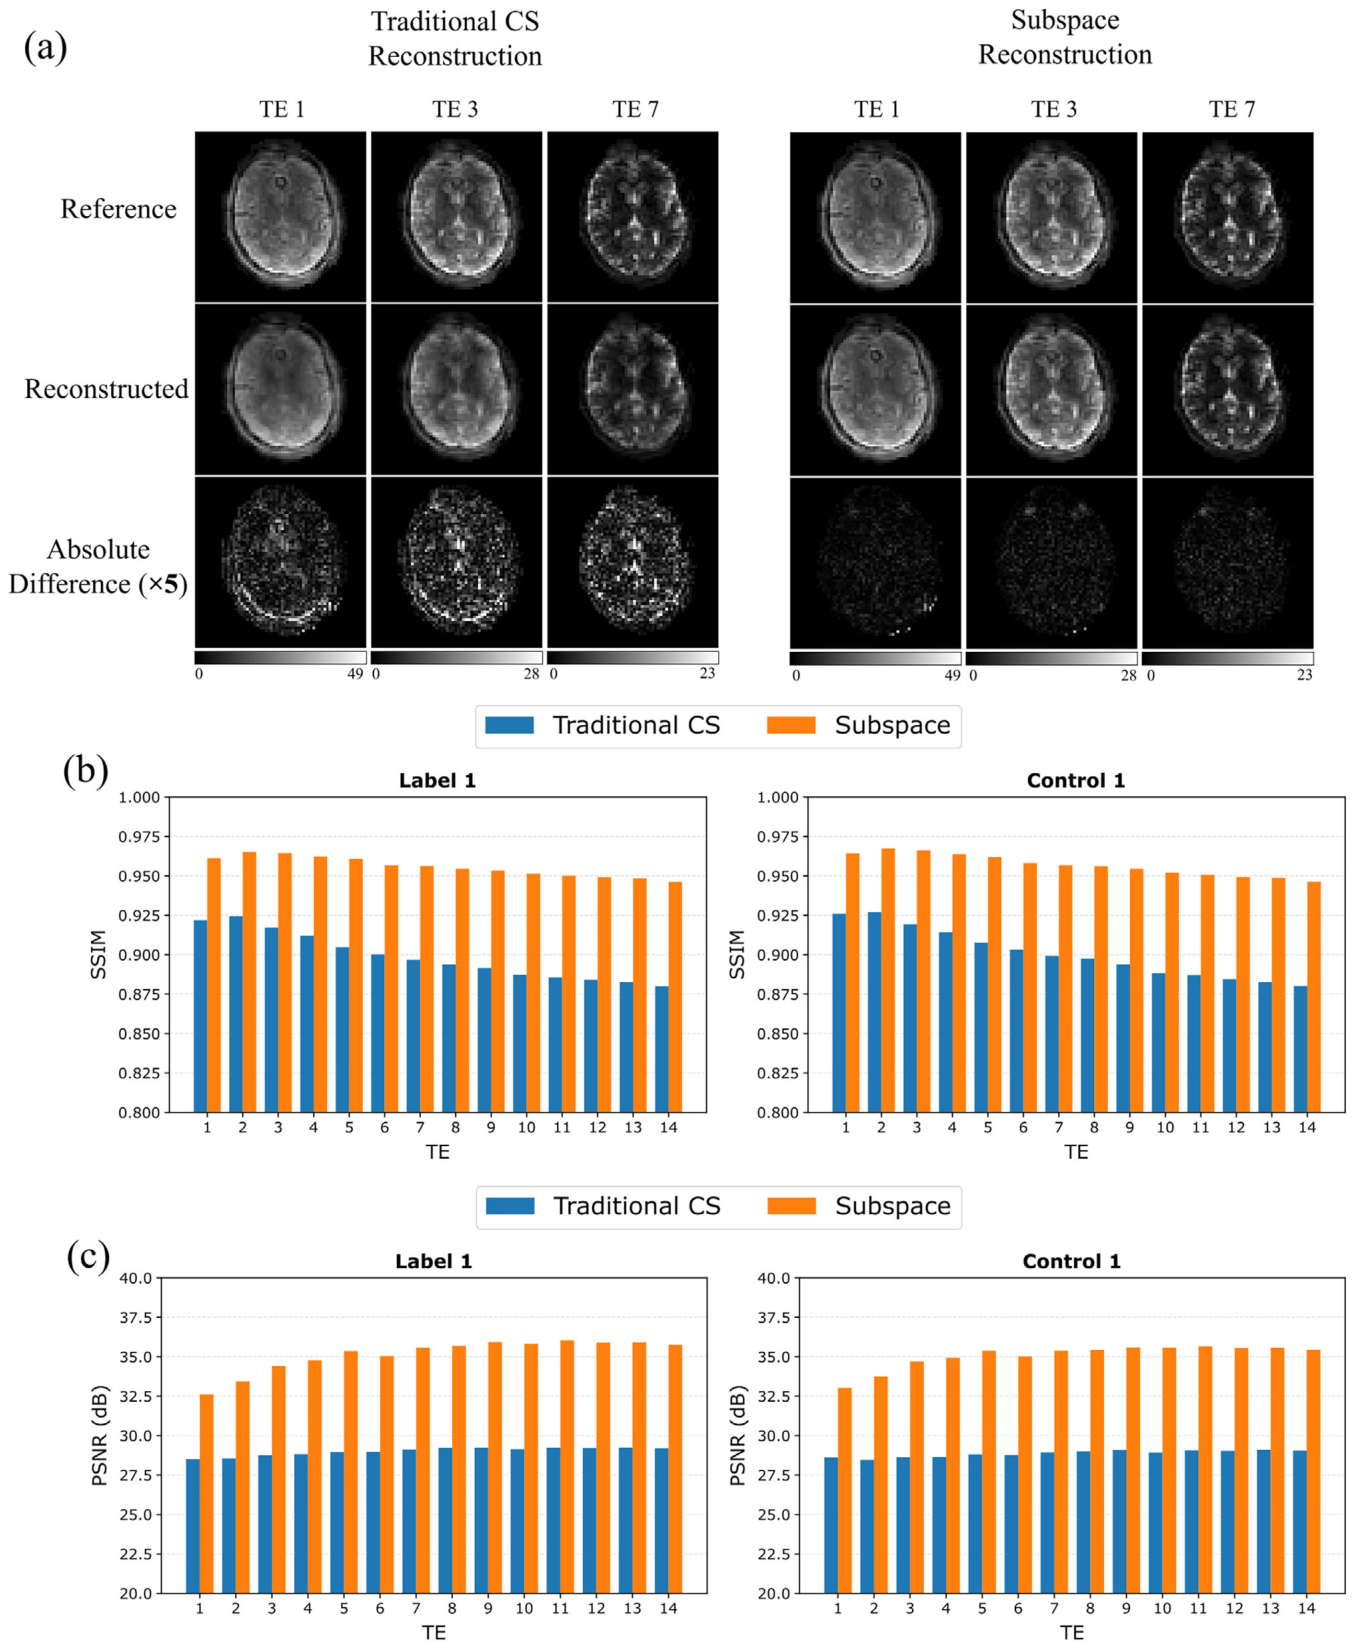
Figure 4. FIGURE 4 | Qualitative and quantitative evaluation of reconstruction performance for one representative subject. (a) Representative reconstruction results at multiple echo times (TEs) comparing the fully sampled reference, traditional compressed-sensing (CS) reconstruction, and proposed subspace reconstruction. Absolute difference maps relative to the fully sampled reference are shown below each reconstruction and are displayed at 5 × their original magnitude to improve visualization of subtle reconstruction errors; the same scaling and display range are used for both reconstruction methods. (b) Structural similarity index measure (SSIM) across all echo times for the first control–label measurement pair (Label 1 and Control 1). (c) Peak signal-to-noise ratio (PSNR) across all echo times for the same measurement pair. Corresponding SSIM and PSNR results for the remaining three measurement pairs are provided in Figure S1. The proposed subspace reconstruction consistently demonstrates improved image fidelity relative to traditional CS reconstruction, with lower residual error, higher SSIM, and higher PSNR. Performance gains become increasingly pronounced at later echo times, where signal levels are lower and the reconstruction problem is more challenging.解説: 一人の代表的な対象者に対する再構成性能の定性的および定量的評価を示します。(a)複数のエコー時間(TE)における代表的な再構成結果を、完全にサンプリングされた参照データ、従来の圧縮センシング(CS)再構成、および提案サブスペース再構成で比較しています。各再構成の下には、参照データとの絶対差マップが、微妙な再構成エラーを視覚化しやすくするために元の5倍の大きさで表示されています。(b)最初のコントロール–ラベル測定ペア(Label 1とControl 1)の全エコー時間にわたる構造的類似性指標(SSIM)です。(c)同じ測定ペアの全エコー時間にわたるピーク信号対雑音比(PSNR)です。提案サブスペース再構成は、従来のCS再構成と比較して一貫して改善された画像忠実度を示し、残存エラーが少なく、SSIMとPSNRが高いことがわかります。
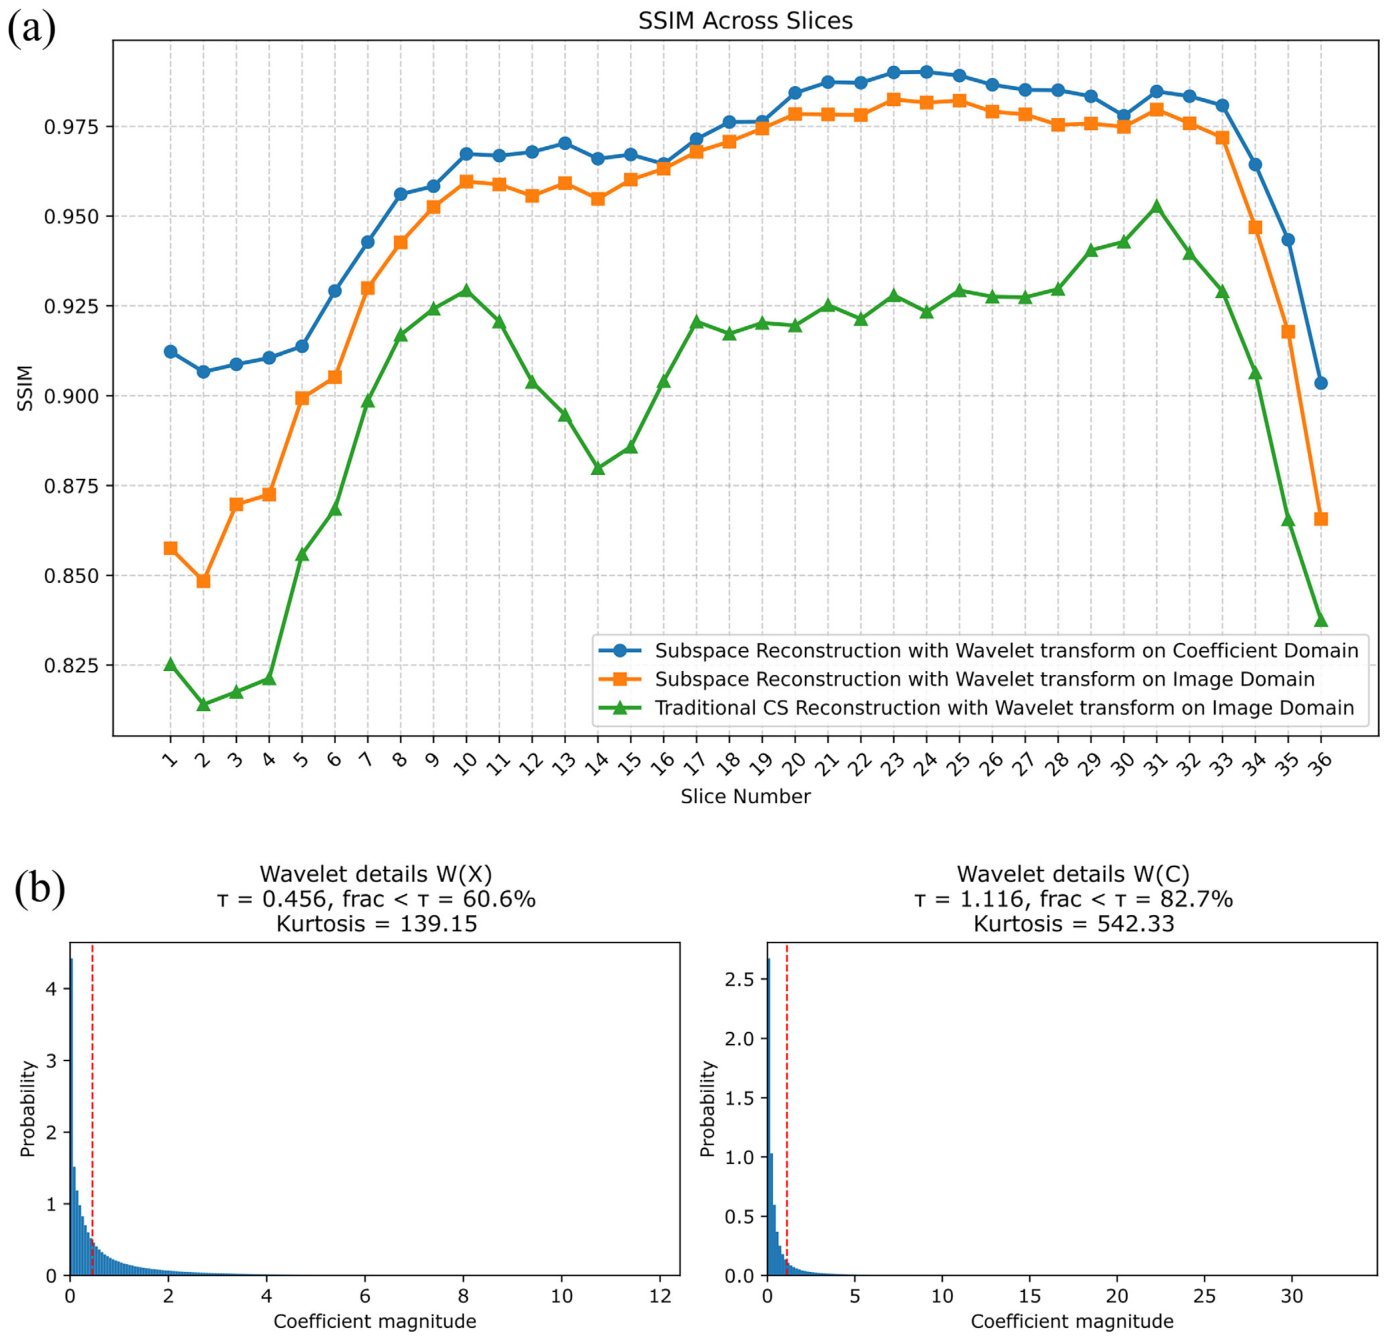
Figure 5. FIGURE 5 | Effect of subspace representation and sparsity domain on reconstruction performance. (a) Slice-wise SSIM comparison for three recon- struction strategies: Subspace reconstruction with coefficient-domain sparsity (proposed), subspace reconstruction with image-domain sparsity, and traditional CS reconstruction. (b) Probability density functions of wavelet detail coefficients in the image domain, W(X), and coefficient domain, W(C). A sparsity threshold 𝜏was defined as 5% of the 99th-percentile coefficient magnitude. The coefficient-domain representation exhibits a greater concen- tration of coefficients near zero, a larger fraction of coefficients below τ, and higher kurtosis, indicating increased sparsity. These results explain the improved reconstruction performance obtained when sparsity regularization is applied in the coefficient domain.解説: サブスペース表現とスパース性ドメインが再構成性能に与える影響を示します。(a)3つの再構成戦略(係数ドメインのスパース性を用いたサブスペース再構成(提案手法)、画像ドメインのスパース性を用いたサブスペース再構成、従来のCS再構成)のスライスごとのSSIM比較です。(b)画像ドメインのウェーブレット詳細係数W(X)と係数ドメインのウェーブレット詳細係数W(C)の確率密度関数です。係数ドメイン表現は、ゼロ付近に集中する係数が多く、閾値以下の係数の割合が大きく、高い尖度を示しており、スパース性が向上していることを示しています。
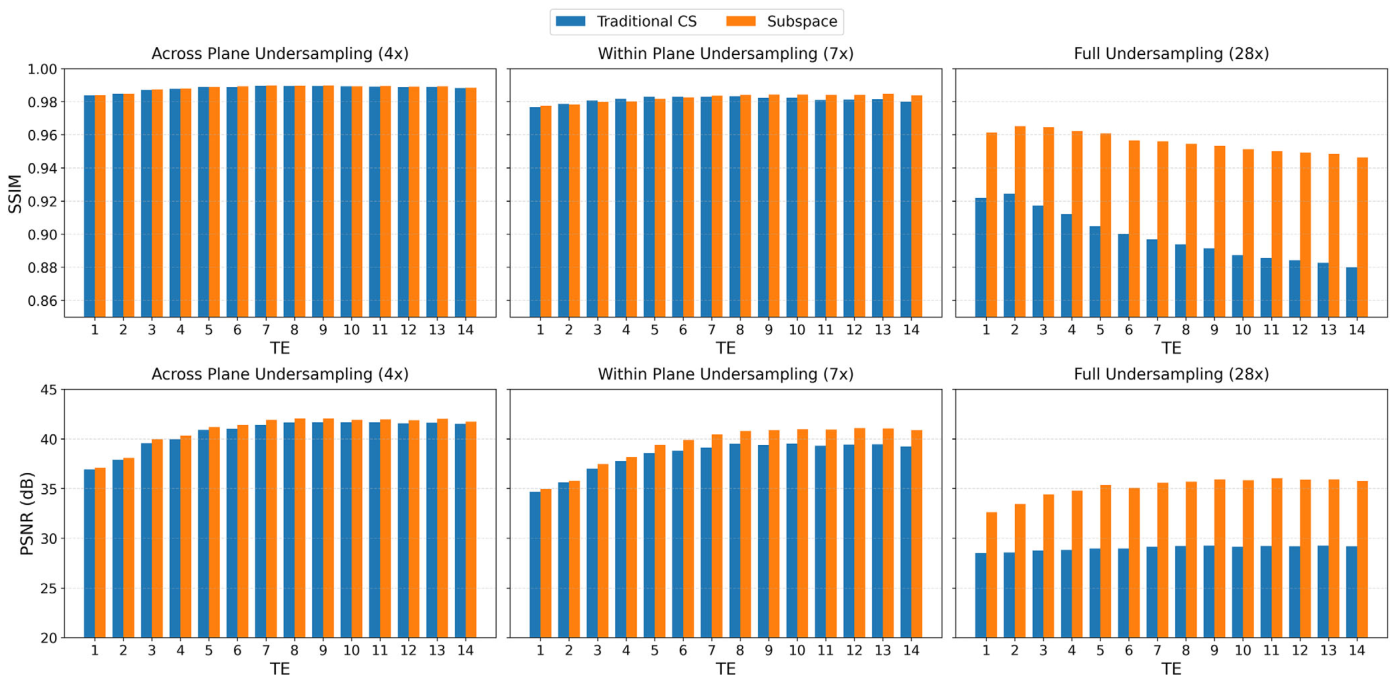
Figure 6. FIGURE 6 | Reconstruction performance under different undersampling regimes, including kz –measurement undersampling (R≈4), kx –ky –TE undersampling (R ≈7), and combined five-dimensional undersampling (R≈28), for one label measurement and all 14 echo times. SSIM and PSNR values were computed relative to the fully sampled reference and averaged across all slices. At the lower undersampling regimes (R≈4 and R≈7), the proposed subspace and traditional CS reconstructions exhibit comparable performance, with only minor differences across echo times. Under the full five-dimensional undersampling regime (R≈28), the proposed method consistently achieves higher SSIM and PSNR, demonstrating improved reconstruction performance under severe undersampling.解説: 異なるアンダーサンプリング条件下での再構成性能を示します。これには、kz–測定アンダーサンプリング(R≈4)、kx–ky–TEアンダーサンプリング(R≈7)、および結合された5次元アンダーサンプリング(R≈28)が含まれ、1つのラベル測定と全14エコー時間について示されています。SSIMとPSNR値は、完全にサンプリングされた参照データに対して計算され、すべてのスライスで平均化されています。低いアンダーサンプリング条件下(R≈4およびR≈7)では、提案サブスペース再構成と従来のCS再構成は同等の性能を示しますが、全5次元アンダーサンプリング(R≈28)の下では、提案手法が一貫して高いSSIMとPSNRを達成し、厳しいアンダーサンプリング条件下での再構成性能の改善を示しています。
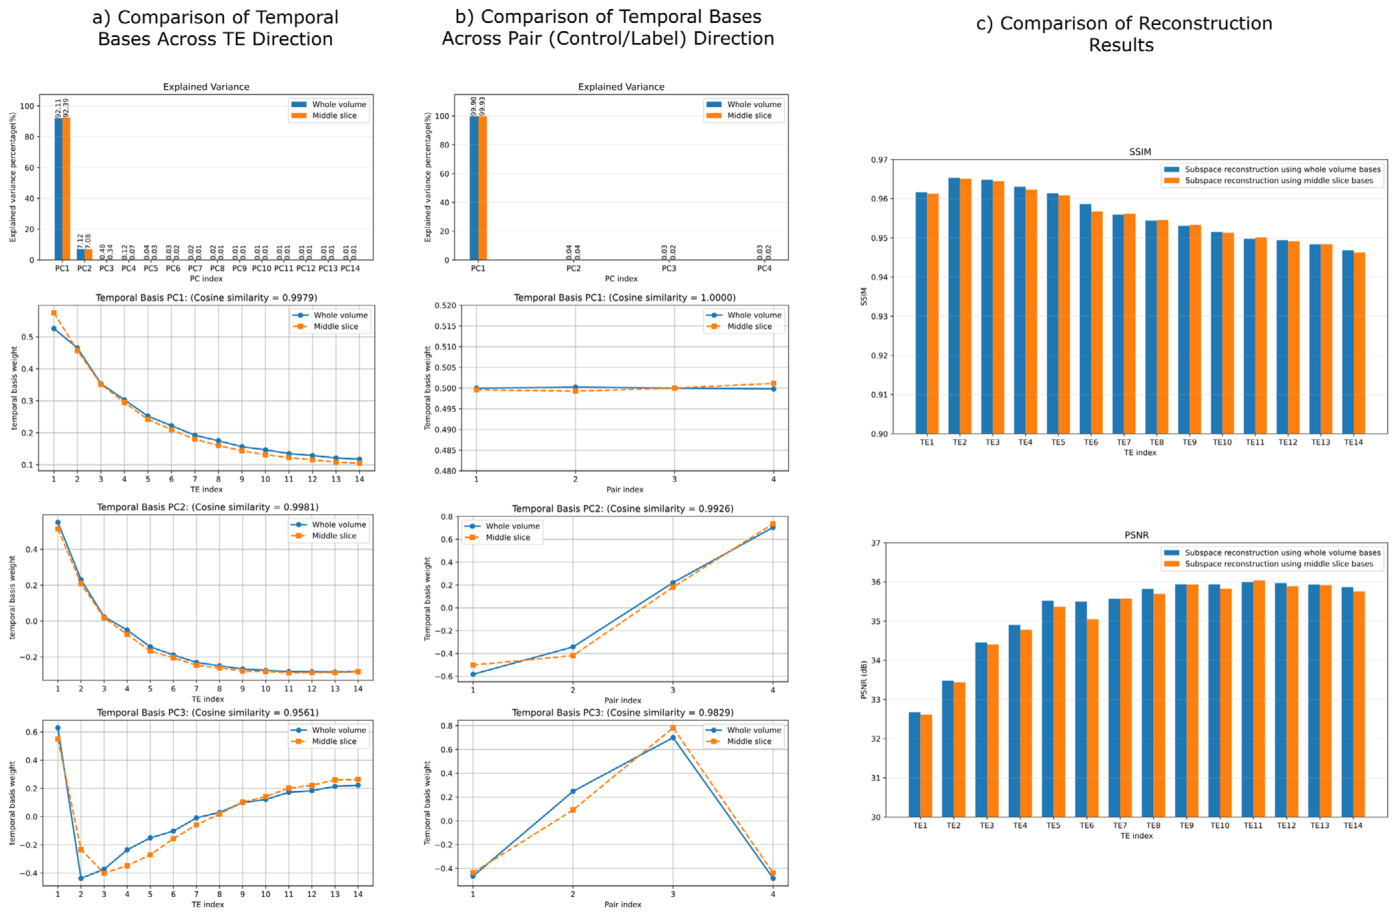
Figure 7. FIGURE 7 | Validation of middle-slice temporal basis estimation for one representative subject. (a) Comparison of temporal bases across the echo-time (TE) direction. The explained variance spectra from whole-volume and middle-slice PCA are shown at the top, followed by representa- tive TE temporal basis functions. The corresponding cosine similarity values indicate close agreement between the middle-slice and whole-volume TE bases, especially for the dominant components. (b) Comparison of temporal bases across the control–label pair direction. The explained variance spectra show that the first pair component explains nearly all variance for both whole-volume and middle-slice PCA. The temporal basis plots further show that the middle-slice bases closely follow the whole-volume bases, with high cosine similarity across the pair components. (c) Reconstruction performance obtained using temporal bases estimated either from the whole volume or from the middle slice. SSIM and PSNR were computed for the first label volume (the first measurement) across all 14 TEs and averaged over all slices. The two approaches produce very similar SSIM and PSNR values across echo times, supporting the use of the middle slice as a practical representative calibration slice for temporal basis estimation.解説: 一人の代表的な対象者に対する中央スライスからの時間基底推定の妥当性検証です。(a)エコー時間(TE)方向の時間基底の比較です。全ボリュームおよび中央スライスPCAから得られた説明分散スペクトルと、代表的なTE時間基底関数が示されています。対応するコサイン類似度値は、特に主要な成分において、中央スライスと全ボリュームのTE基底間での密接な一致を示しています。(b)コントロール–ラベルペア方向の時間基底の比較です。説明分散スペクトルは、最初のペア成分が全ボリュームと中央スライスPCAの両方でほぼすべての分散を説明することを示しています。時間基底のプロットは、中央スライス基底が全ボリューム基底に密接に従っており、ペア成分全体で高いコサイン類似度を示しています。(c)全ボリュームまたは中央スライスから推定された時間基底を用いた再構成性能の比較です。SSIMとPSNRは、すべての14TEにわたる最初のラベルボリューム(最初の測定)について計算され、すべてのスライスで平均化されています。両アプローチはTE全体で非常に類似したSSIMとPSNR値を示しており、時間基底推定のための実用的な代表的校正スライスとして中央スライスを使用することを支持しています。
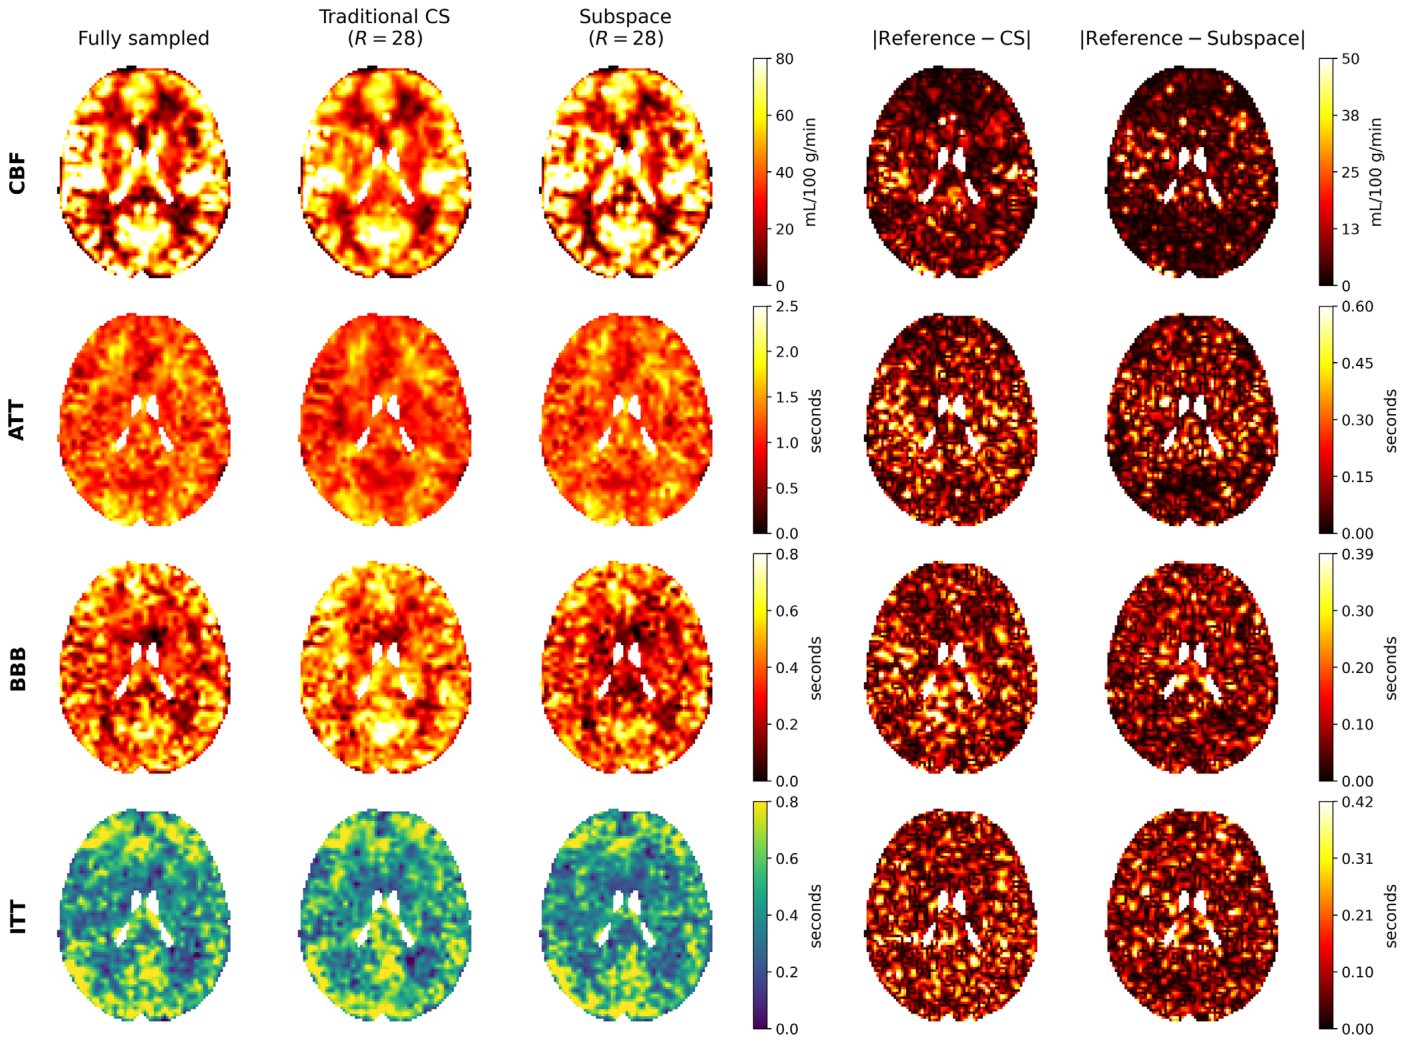
Figure 8. FIGURE 8 | Direct comparison of quantitative physiological parameter maps at (R = 28). Cerebral blood flow (CBF), arterial transit time (ATT), BBB water-exchange time, and intravascular transit time (ITT) maps are shown for one representative subject. For each parameter, the fully sampled reference, traditional compressed-sensing (CS) reconstruction, and proposed subspace reconstruction are shown together with absolute difference maps relative to the fully sampled reference. Identical display ranges are used for the reference and reconstructed maps within each parameter, and a common scale is used for the corresponding traditional-CS and subspace absolute difference maps. The proposed reconstruction shows closer visual agreement with the fully sampled reference and generally smaller residual differences than traditional CS. Note that ventricles were excluded during data fitting. The complete all-subject parameter-map comparison is provided in Figure S2.解説: R=28における定量的生理学的パラメータマップの直接比較です。脳血流(CBF)、動脈通過時間(ATT)、BBB水交換時間、および血管内通過時間(ITT)マップが一人の代表的な対象者について示されています。各パラメータについて、完全にサンプリングされた参照データ、従来の圧縮センシング(CS)再構成、提案サブスペース再構成が、参照データに対する絶対差マップとともに表示されています。提案再構成は、完全にサンプリングされた参照データと視覚的にもより近く、従来のCSよりも残差が一般的に小さいことがわかります。
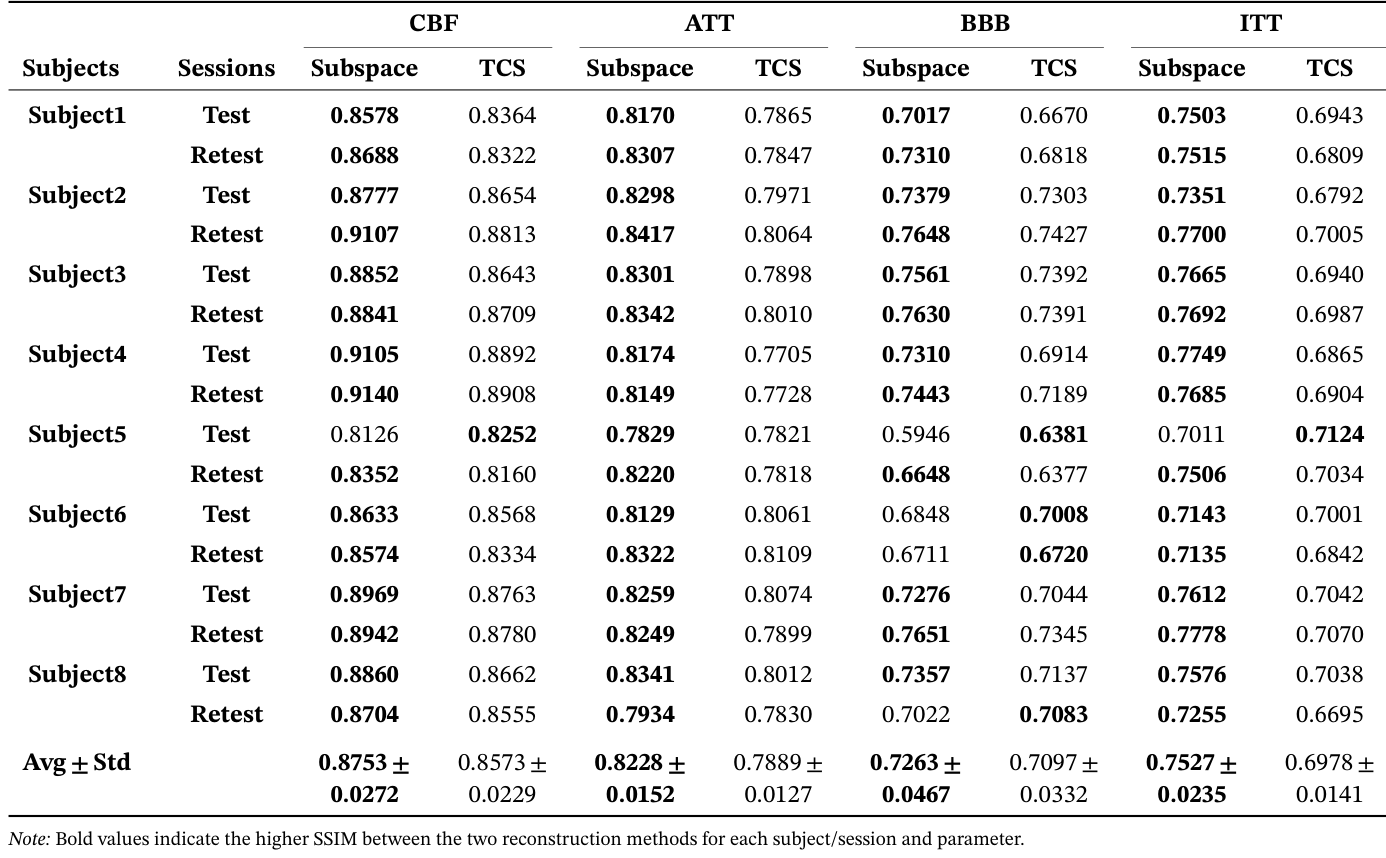
例えば、CBFでは平均0.8753 vs 0.8573、BBBでは平均0.7263 vs 0.7097でした。
Table 1. TABLE 1 | Whole volume SSIM comparison of quantitative parameter maps for our subspace reconstruction and traditional CS (TCS) reconstruc- tion. This table reports SSIM values for CBF, ATT, BBB, and ITT maps reconstructed using the proposed subspace method and the traditional CS reconstruction method, evaluated separately for test and retest sessions and averaged across all subjects.解説: サブスペース再構成と従来のCS(TCS)再構成における定量的パラメータマップの全ボリュームSSIM比較を示します。この表は、CBF、ATT、BBB、ITTマップについて、提案サブスペース法と従来のCS再構成法で再構成されたSSIM値を、テストおよびリテストセッションごとに報告し、すべての対象者で平均したものです。提案サブスペース再構成は、ほとんどのパラメータとセッションで従来のCSよりも高いSSIMを達成しました。
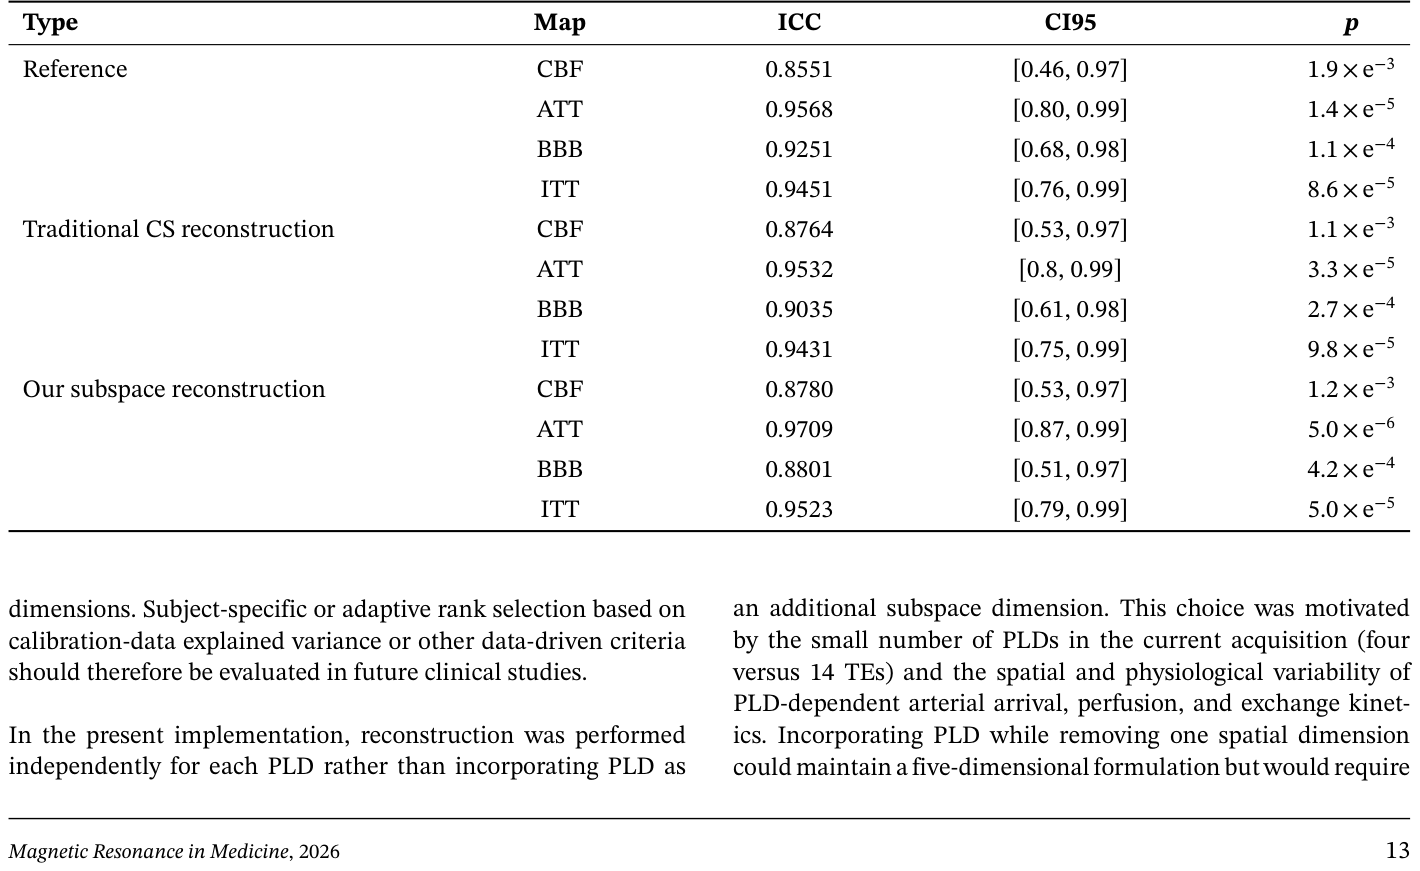
Table 2. TABLE 2 | Test–retest reliability of physiological parameter estimates from the fully sampled reference and 𝑅= 28 reconstructions. ICC values, 95% confidence intervals, and statistical significance are reported for CBF, ATT, BBB water-exchange, and ITT estimates obtained from the fully sampled reference, traditional CS reconstruction at 𝑅= 28, and proposed subspace reconstruction at 𝑅= 28. ICCs were calculated between the independently acquired test and retest sessions within each dataset type.解説: 完全にサンプリングされた参照データとR=28再構成から得られた生理学的パラメータ推定値のテスト–リテスト信頼性を示します。CBF、ATT、BBB水交換、ITT推定値について、完全にサンプリングされた参照データ、R=28での従来のCS再構成、およびR=28での提案サブスペース再構成から得られたICC値、95%信頼区間、統計的有意差が報告されています。提案サブスペース再構成は、参照データと同等の高い信頼性を示しています。

コメントを残す