どうも、Beyond the Pixelです。間質性肺炎(IP)は、肺の間質という部分に炎症や線維化が起こり、呼吸機能が徐々に低下していく進行性の肺疾患であり、その予後評価は治療方針を決定する上で非常に重要です。現在、間質性肺炎の対象者のリスク評価には、性別、年齢、生理機能(呼吸機能検査の結果)から算出される「GAPスコア」や、心エコー検査による「三尖弁逆流圧較差(TRPG)」を用いた肺動脈圧の推定が日常的に行われています。しかし、これらの既存の検査方法は、肺の血管系の状態を直接的に観察するものではありません。GAPスコアは努力に依存する呼吸機能検査を必要とし、最も予備能力が低い対象者では実施が困難な場合があります。また、心エコーによる肺動脈圧の推定は、血管床が十分に失われ抵抗が上昇してからでなければ圧の上昇を捉えられないという限界があります。これらの既存指標では捉えきれない、間質性肺炎における肺血流の異常が予後に影響を与える可能性が示唆されていました。そんな中、日本の専門家チームが、短時間深吸気息止め(STDIBH)肺血流SPECT/CTで測定される「血流欠損率(%PPD)」が、間質性肺炎の予後予測において、既存指標とは独立した新たなリスク情報を提供する可能性を検証しました。この研究は、肺の血管性病変という新たな視点から間質性肺炎のリスク層別化に貢献する画期的なものです。
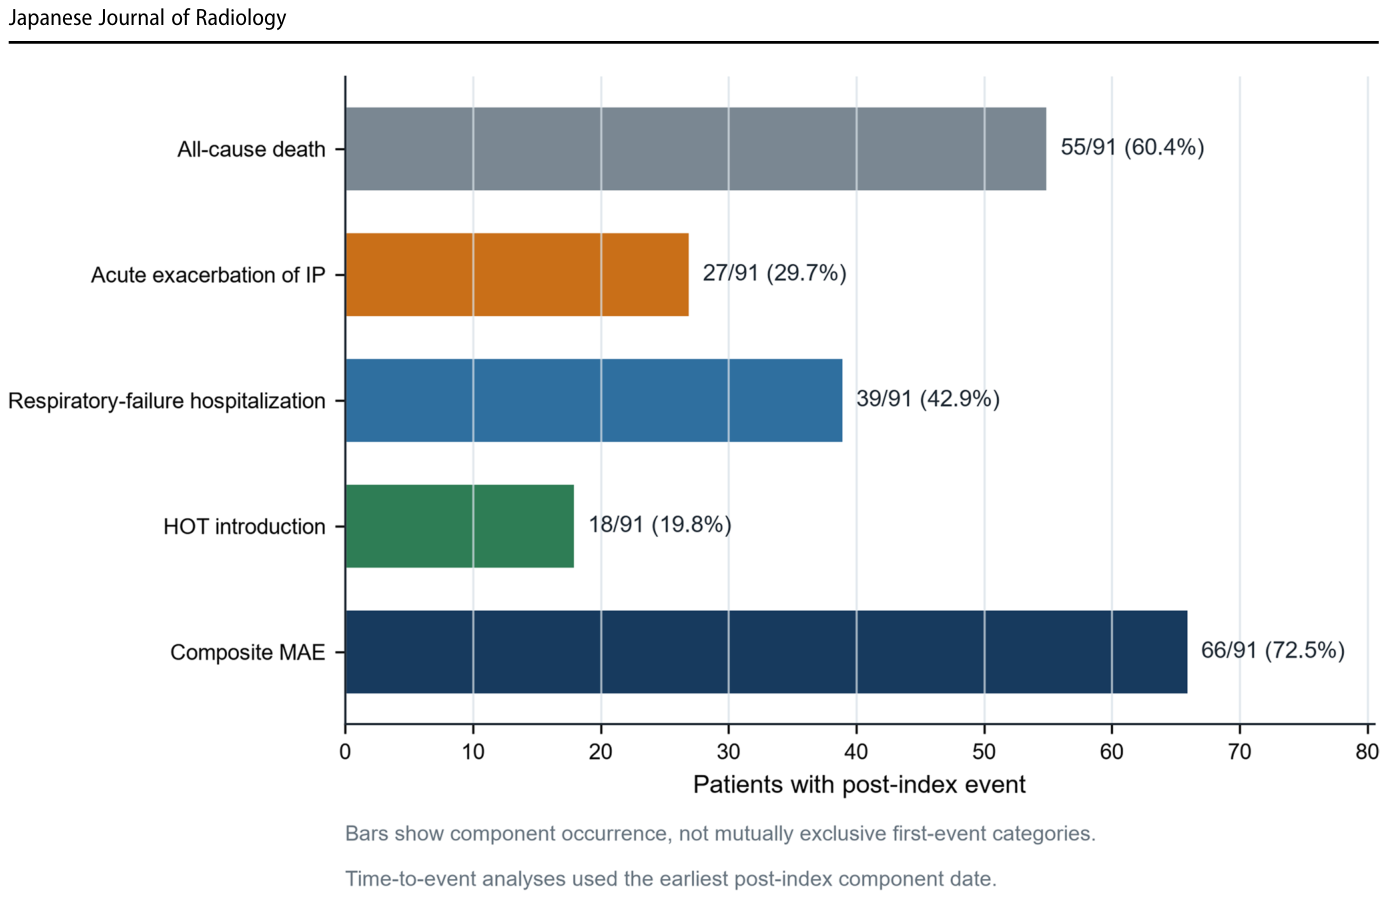
Figure 2. Fig. 2 Four-component major adverse event (MAE) endpoint: all- cause death, acute exacerbation of interstitial pneumonia, respiratory- failure hospitalization, or initiation of home oxygen therapy after the index short-time deep-inspiratory breath-hold pulmonary perfusion解説: この図は、間質性肺炎の対象者における主要有害事象(MAE)の構成要素の発生状況を示しています。全91名の対象者のうち、複合MAEは66名(72.5%)で発生しました。それぞれの成分別では、全死因死亡が55名(60.4%)、間質性肺炎の急性増悪が27名(29.7%)、呼吸不全による入院が39名(42.9%)、在宅酸素療法の開始が18名(19.8%)で認められました。
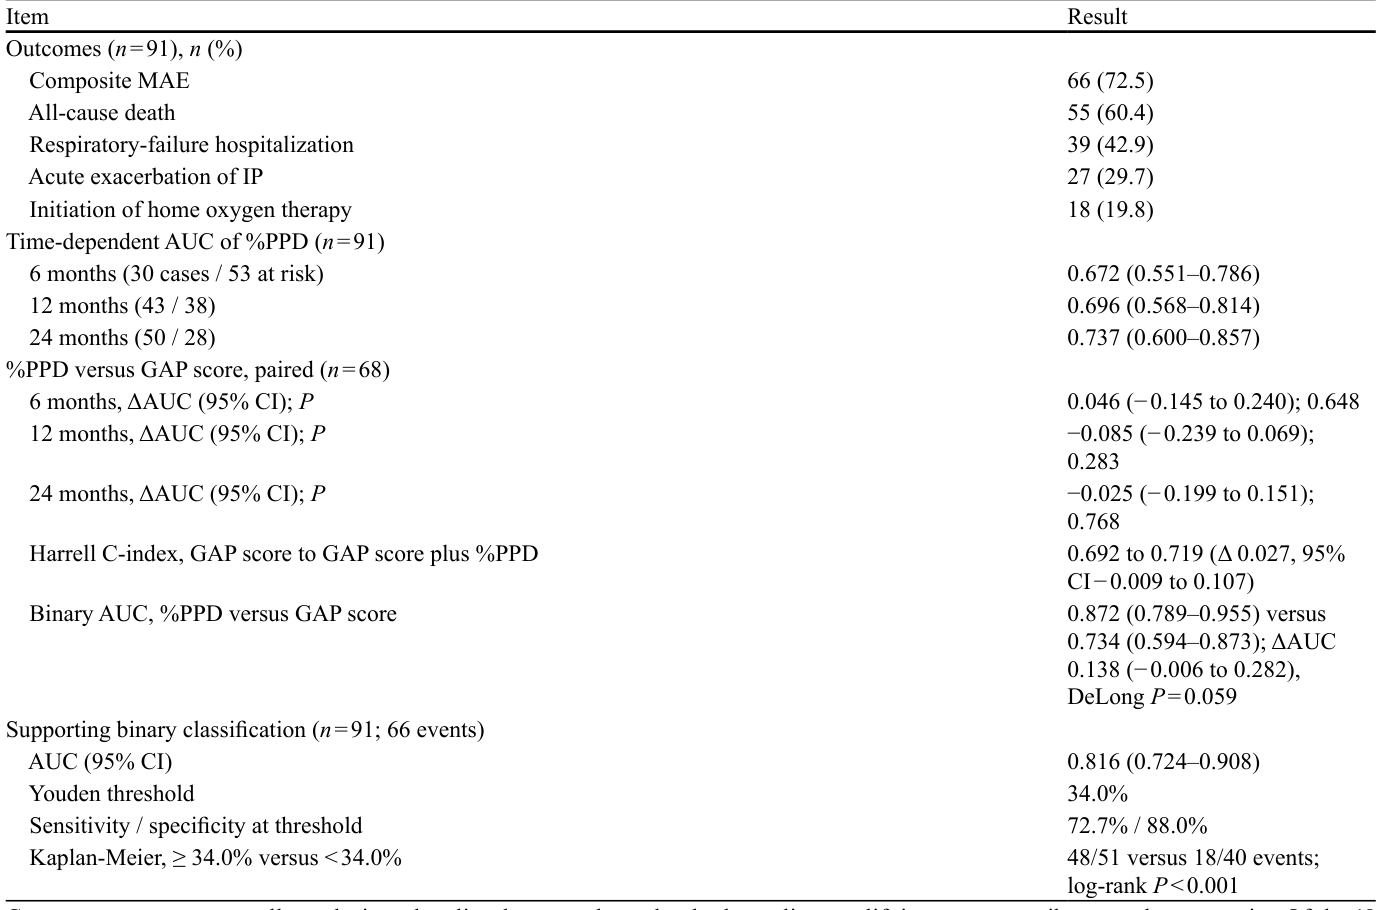
Table 2. Table 2 Outcomes and discrimination Item Result Outcomes (n = 91), n (%) Composite MAE 66 (72.5) All-cause death 55 (60.4) Respiratory-failure hospitalization 39 (42.9) Acute exacerbation of IP 27 (29.7) Initiation of home oxygen therapy 18 (19.8) Time-dependent AUC of %PPD (n = 91) 6 months (30 cases / 53 at risk) 0.672 (0.551–0.786) 12 months (43 / 38) 0.696 (0.568–0.814) 24 months (50 / 28) 0.737 (0.600–0.857) %PPD versus GAP score, paired (n = 68) 6 months, ΔAUC (95% CI); P 0.046 (− 0.145 to 0.240); 0.648 12 months, ΔAUC (95% CI); P −0.085 (− 0.239 to 0.069); 0.283 24 months, ΔAUC (95% CI); P −0.025 (− 0.199 to 0.151); 0.768 Harrell C-index, GAP score to GAP score plus %PPD 0.692 to 0.719 (Δ 0.027, 95% CI − 0.009 to 0.107) Binary AUC, %PPD versus GAP score 0.872 (0.789–0.955) versus 0.734 (0.594–0.873); ΔAUC 0.138 (− 0.006 to 0.282), DeLong P = 0.059 Supporting binary classification (n = 91; 66 events) AUC (95% CI) 0.816 (0.724–0.908) Youden threshold 34.0% Sensitivity / specificity at threshold 72.7% / 88.0% Kaplan-Meier, ≥ 34.0% versus < 34.0% 48/51 versus 18/40 events; log-rank P < 0.001 Components are not mutually exclusive when listed separately, and only the earliest qualifying event contributes to the composite. Of the 18 initiations of home oxygen therapy, 17 occurred among the 55 patients not already receiving it at baseline and 1 among the 36 who were, so that component applies to a smaller at-risk group than the other three. All outcome percentages are of the full cohort. Time-dependent AUC is the cumulative/dynamic estimate with inverse-probability-of-censoring weights, and confidence intervals are from 2000 bootstrap resamples. The paired comparison uses the 68 patients with both measures. The binary AUC treats MAE as an ever-event outcome and ignores censoring, so it is reported only as a supporting classification measure解説: この表は、対象者のアウトカムと識別能力に関する結果をまとめています。複合MAEや各構成要素の発生率、%PPDの時間依存性AUC(6ヶ月、12ヶ月、24ヶ月)、%PPDとGAPスコアの識別能力の比較、GAPスコアに%PPDを追加した場合のC指数の変化、および%PPDの二値分類におけるAUC、Youden閾値、感度・特異度、Kaplan-Meier分析の結果が示されています。
は、これらのアウトカムと判別能力に関する詳細な結果を示しています。
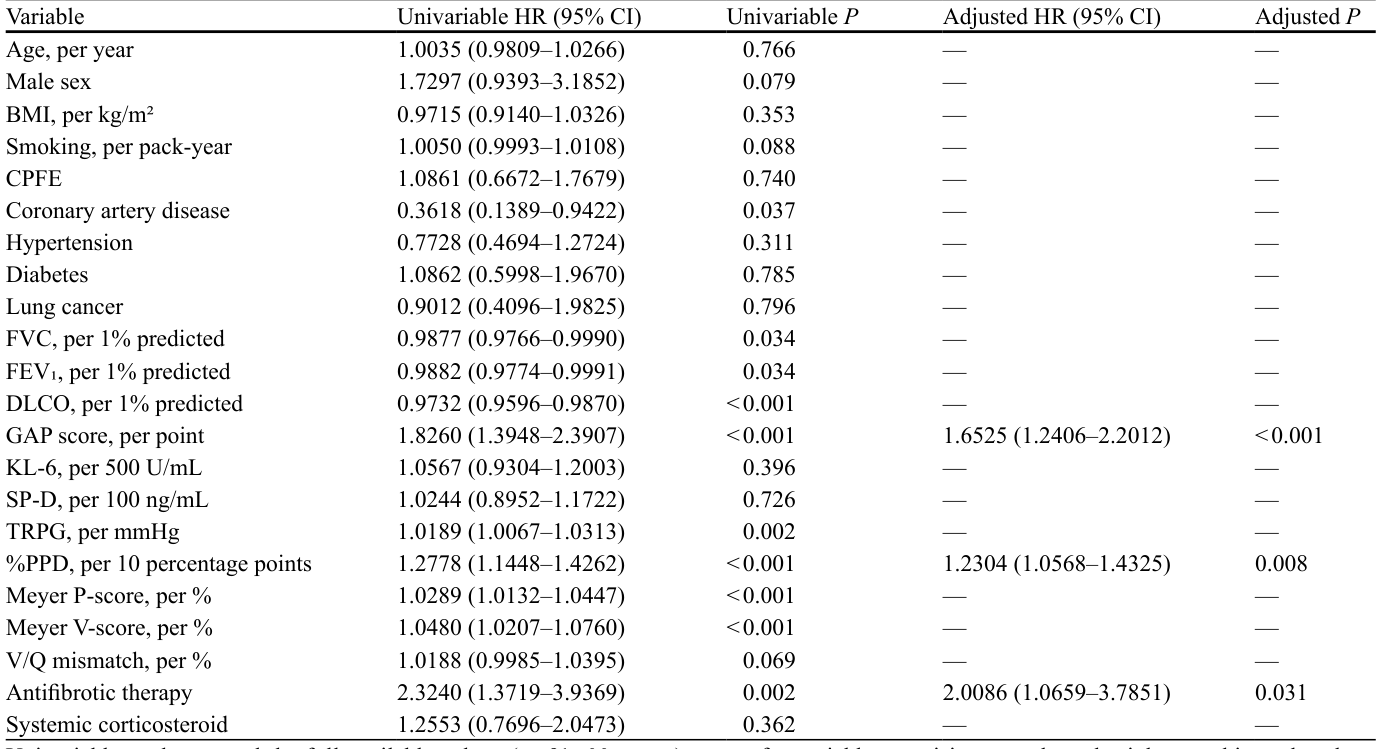
Table 3. Table 3 Univariable and adjusted Cox proportional-hazards models for MAE Variable Univariable HR (95% CI) Univariable P Adjusted HR (95% CI) Adjusted P Age, per year 1.0035 (0.9809–1.0266) 0.766 — — Male sex 1.7297 (0.9393–3.1852) 0.079 — — BMI, per kg/m² 0.9715 (0.9140–1.0326) 0.353 — — Smoking, per pack-year 1.0050 (0.9993–1.0108) 0.088 — — CPFE 1.0861 (0.6672–1.7679) 0.740 — — Coronary artery disease 0.3618 (0.1389–0.9422) 0.037 — — Hypertension 0.7728 (0.4694–1.2724) 0.311 — — Diabetes 1.0862 (0.5998–1.9670) 0.785 — — Lung cancer 0.9012 (0.4096–1.9825) 0.796 — — FVC, per 1% predicted 0.9877 (0.9766–0.9990) 0.034 — — FEV₁, per 1% predicted 0.9882 (0.9774–0.9991) 0.034 — — DLCO, per 1% predicted 0.9732 (0.9596–0.9870) < 0.001 — — GAP score, per point 1.8260 (1.3948–2.3907) < 0.001 1.6525 (1.2406–2.2012) < 0.001 KL-6, per 500 U/mL 1.0567 (0.9304–1.2003) 0.396 — — SP-D, per 100 ng/mL 1.0244 (0.8952–1.1722) 0.726 — — TRPG, per mmHg 1.0189 (1.0067–1.0313) 0.002 — — %PPD, per 10 percentage points 1.2778 (1.1448–1.4262) < 0.001 1.2304 (1.0568–1.4325) 0.008 Meyer P-score, per % 1.0289 (1.0132–1.0447) < 0.001 — — Meyer V-score, per % 1.0480 (1.0207–1.0760) < 0.001 — — V/Q mismatch, per % 1.0188 (0.9985–1.0395) 0.069 — — Antifibrotic therapy 2.3240 (1.3719–3.9369) 0.002 2.0086 (1.0659–3.7851) 0.031 Systemic corticosteroid 1.2553 (0.7696–2.0473) 0.362 — — Univariable analyses used the full available cohort (n = 91; 66 events) except for variables requiring complete physiology or biomarker data, which were analyzed on their respective complete-case subsets, and the Meyer P-score, Meyer V-score, and V/Q mismatch, which were ana lyzed in the paired-ventilation subset (n = 54; 42 events). The adjusted model (complete case, n = 68; 51 events) comprised %PPD, the GAP score entered in place of its collinear constituents, and antifibrotic therapy selected by the Akaike information criterion. Covariates not entered into the multivariable model are marked “—“. Reference categories were female sex, IP-only phenotype, absence of each comorbidity, and no antifibrotic or corticosteroid therapy解説: この表は、主要有害事象(MAE)に対する単変量および調整済みCox比例ハザードモデルの結果を示しています。年齢、性別、BMI、喫煙歴、CPFE、FVC、DLCO、GAPスコア、TRPG、%PPD、Meyer P-スコア、Meyer V-スコア、V/Qミスマッチ、抗線維化療法など、様々な変数のハザード比とP値が示されています。調整モデルには、%PPD、GAPスコア、抗線維化療法が含まれています。
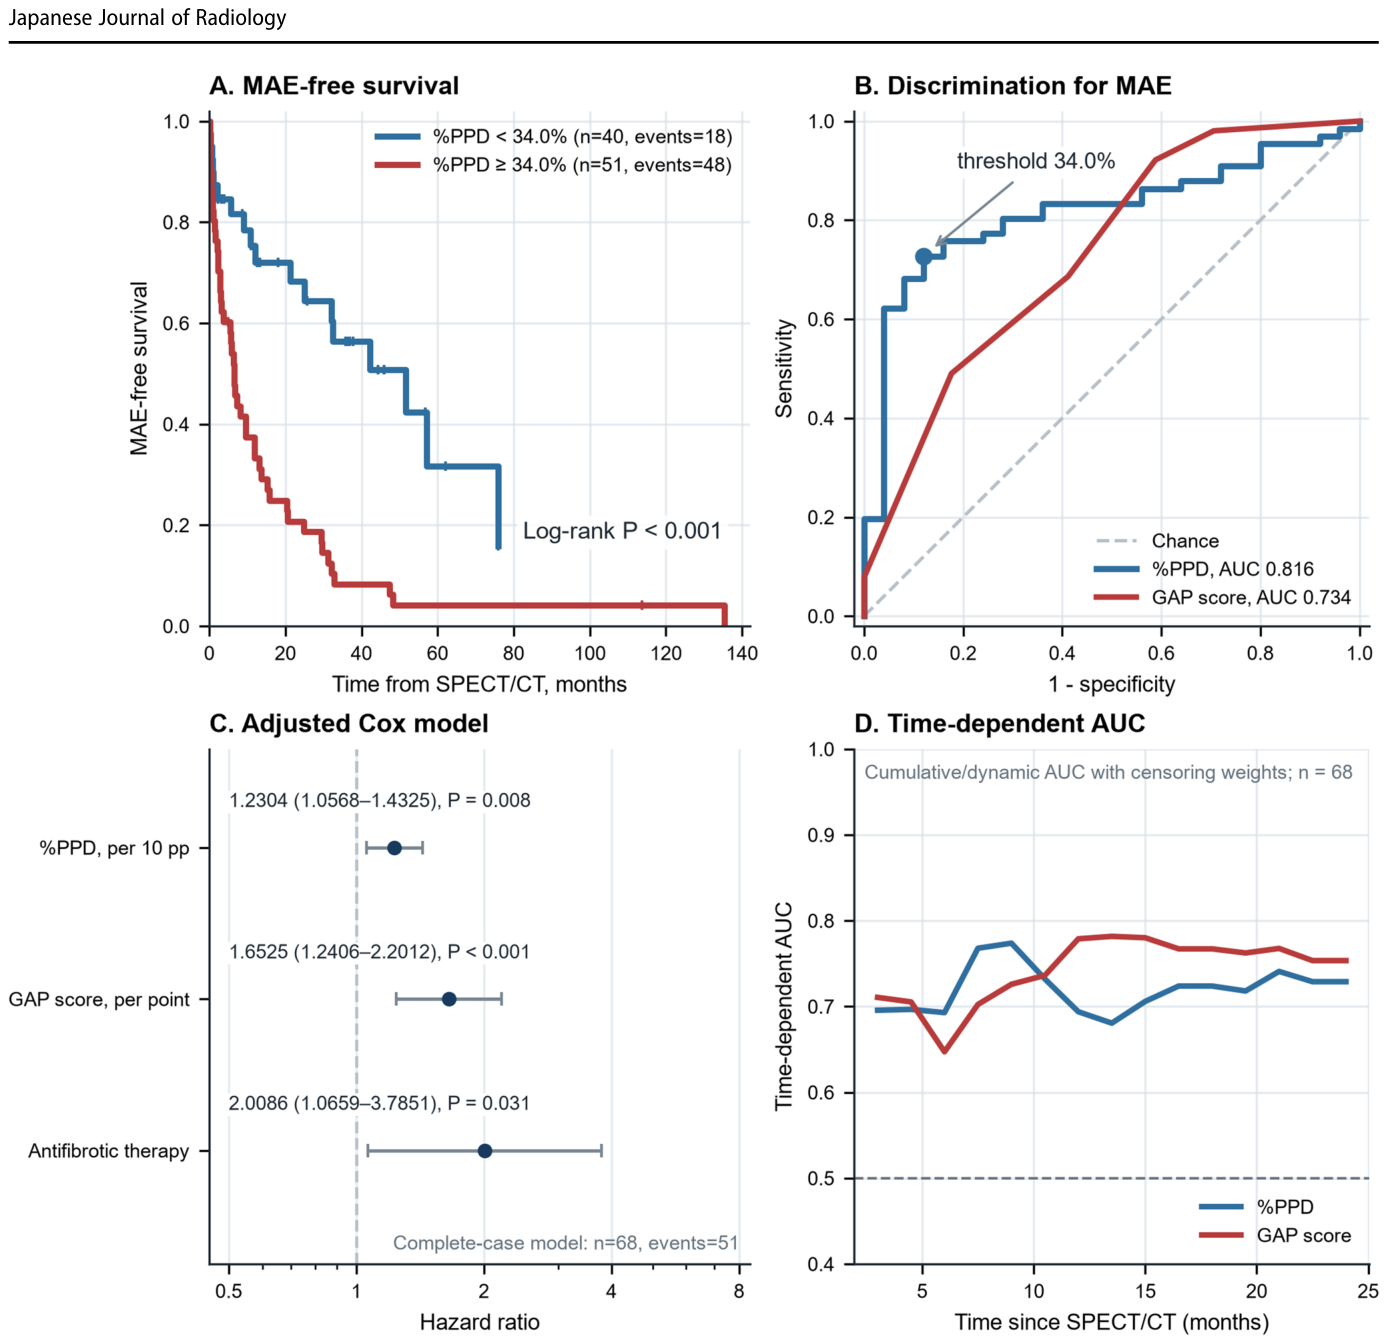
Figure 3. Fig. 3 Primary prognostic performance of percent perfusion defect (%PPD). A MAE-free survival stratified by the within-cohort explor atory Youden-derived %PPD threshold of 34.0%. B Receiver operating characteristic curves for %PPD and GAP score, shown as a support ing classification measure because a binary curve ignores censoring.解説: この図は、血流欠損率(%PPD)の主要な予後予測性能を示しています。Aは、%PPDのカットオフ値34.0%で層別化したMAEのない生存期間を示しており、%PPDが高いグループで生存期間が短いことが分かります。Bは、%PPDとGAPスコアのMAEに対するROC曲線を示しています。Cは、調整済みCoxモデルにおける%PPD、GAPスコア、抗線維化療法の影響をハザード比で示しています。Dは、%PPDとGAPスコアの時間依存性AUCを示しており、追跡期間における両指標の識別能力を比較しています。
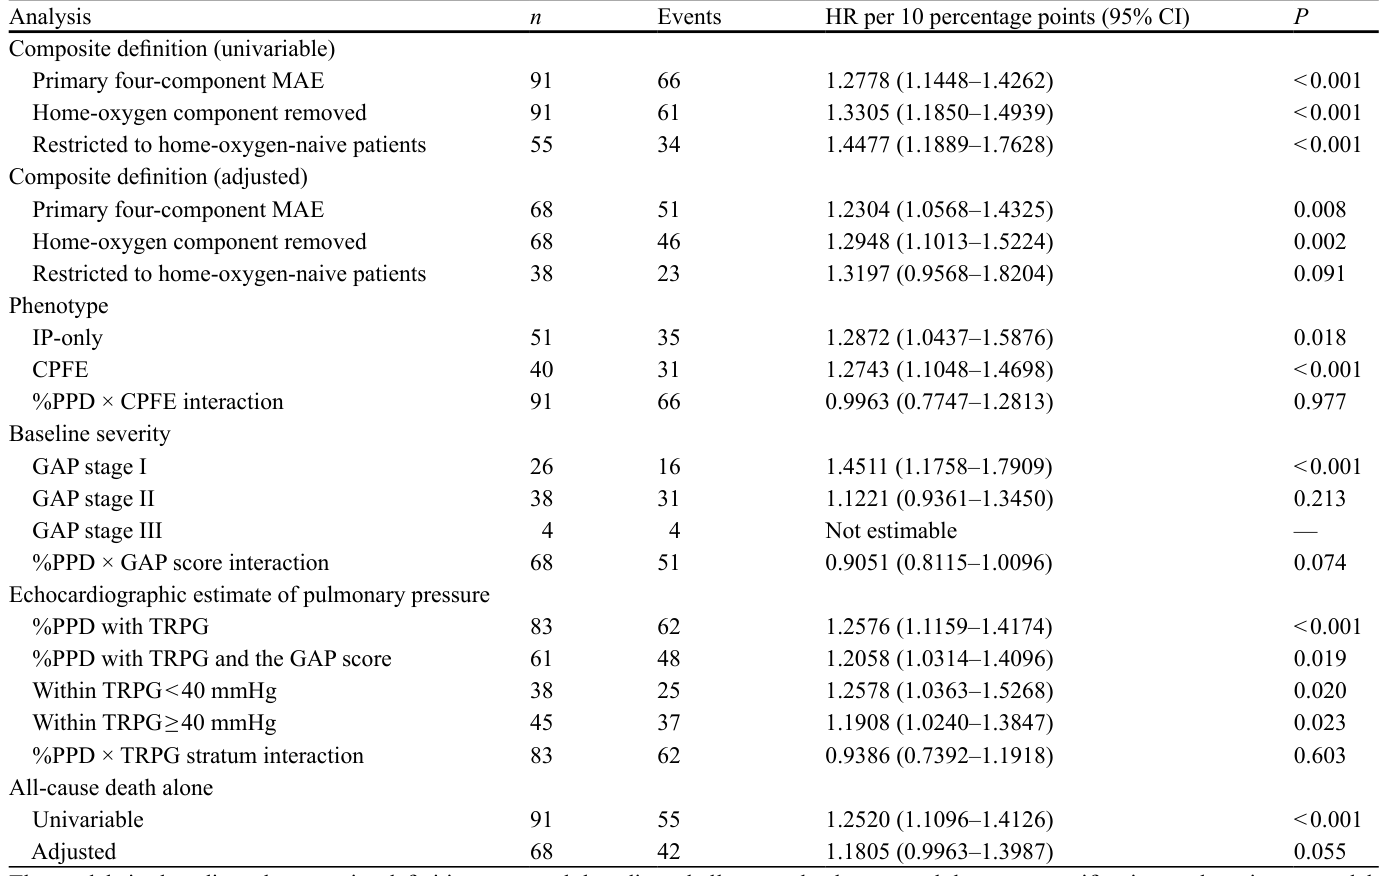
Table 4. Table 4 Sensitivity, interaction, and secondary analyses Analysis n Events HR per 10 percentage points (95% CI) P Composite definition (univariable) Primary four-component MAE 91 66 1.2778 (1.1448–1.4262) < 0.001 Home-oxygen component removed 91 61 1.3305 (1.1850–1.4939) < 0.001 Restricted to home-oxygen-naive patients 55 34 1.4477 (1.1889–1.7628) < 0.001 Composite definition (adjusted) Primary four-component MAE 68 51 1.2304 (1.0568–1.4325) 0.008 Home-oxygen component removed 68 46 1.2948 (1.1013–1.5224) 0.002 Restricted to home-oxygen-naive patients 38 23 1.3197 (0.9568–1.8204) 0.091 Phenotype IP-only 51 35 1.2872 (1.0437–1.5876) 0.018 CPFE 40 31 1.2743 (1.1048–1.4698) < 0.001 %PPD × CPFE interaction 91 66 0.9963 (0.7747–1.2813) 0.977 Baseline severity GAP stage I 26 16 1.4511 (1.1758–1.7909) < 0.001 GAP stage II 38 31 1.1221 (0.9361–1.3450) 0.213 GAP stage III 4 4 Not estimable — %PPD × GAP score interaction 68 51 0.9051 (0.8115–1.0096) 0.074 Echocardiographic estimate of pulmonary pressure %PPD with TRPG 83 62 1.2576 (1.1159–1.4174) < 0.001 %PPD with TRPG and the GAP score 61 48 1.2058 (1.0314–1.4096) 0.019 Within TRPG < 40 mmHg 38 25 1.2578 (1.0363–1.5268) 0.020 Within TRPG ≥ 40 mmHg 45 37 1.1908 (1.0240–1.3847) 0.023 %PPD × TRPG stratum interaction 83 62 0.9386 (0.7392–1.1918) 0.603 All-cause death alone Univariable 91 55 1.2520 (1.1096–1.4126) < 0.001 Adjusted 68 42 1.1805 (0.9963–1.3987) 0.055 The models in the adjusted composite-definition rows and the adjusted all-cause-death row used the same specification as the primary model, namely %PPD, the GAP score, and antifibrotic therapy, so their sample sizes are limited to patients with a computable GAP score. The models in the first two echocardiographic rows entered %PPD with the tricuspid regurgitation pressure gradient, alone or together with the GAP score. The within-stratum models for phenotype, GAP stage, and TRPG were univariable. Interaction rows report the multiplicative interaction term from a model containing both main effects, per 10 percentage points of %PPD and, for the GAP score, per point. The symbol “—” denotes not applicable. The echocardiographic analyses were post hoc and are limited to the 83 patients with a recorded tricuspid regurgitation pressure gradient解説: この表は、感度分析、交互作用分析、および二次解析の結果を示しています。主要有害事象(MAE)の複合エンドポイントの定義を変更した場合や、病型、ベースラインの重症度(GAPステージ)、心エコーによる肺動脈圧推定値との関係、そして全死因死亡のみをエンドポイントとした場合の%PPDのハザード比とP値が報告されています。

コメントを残す