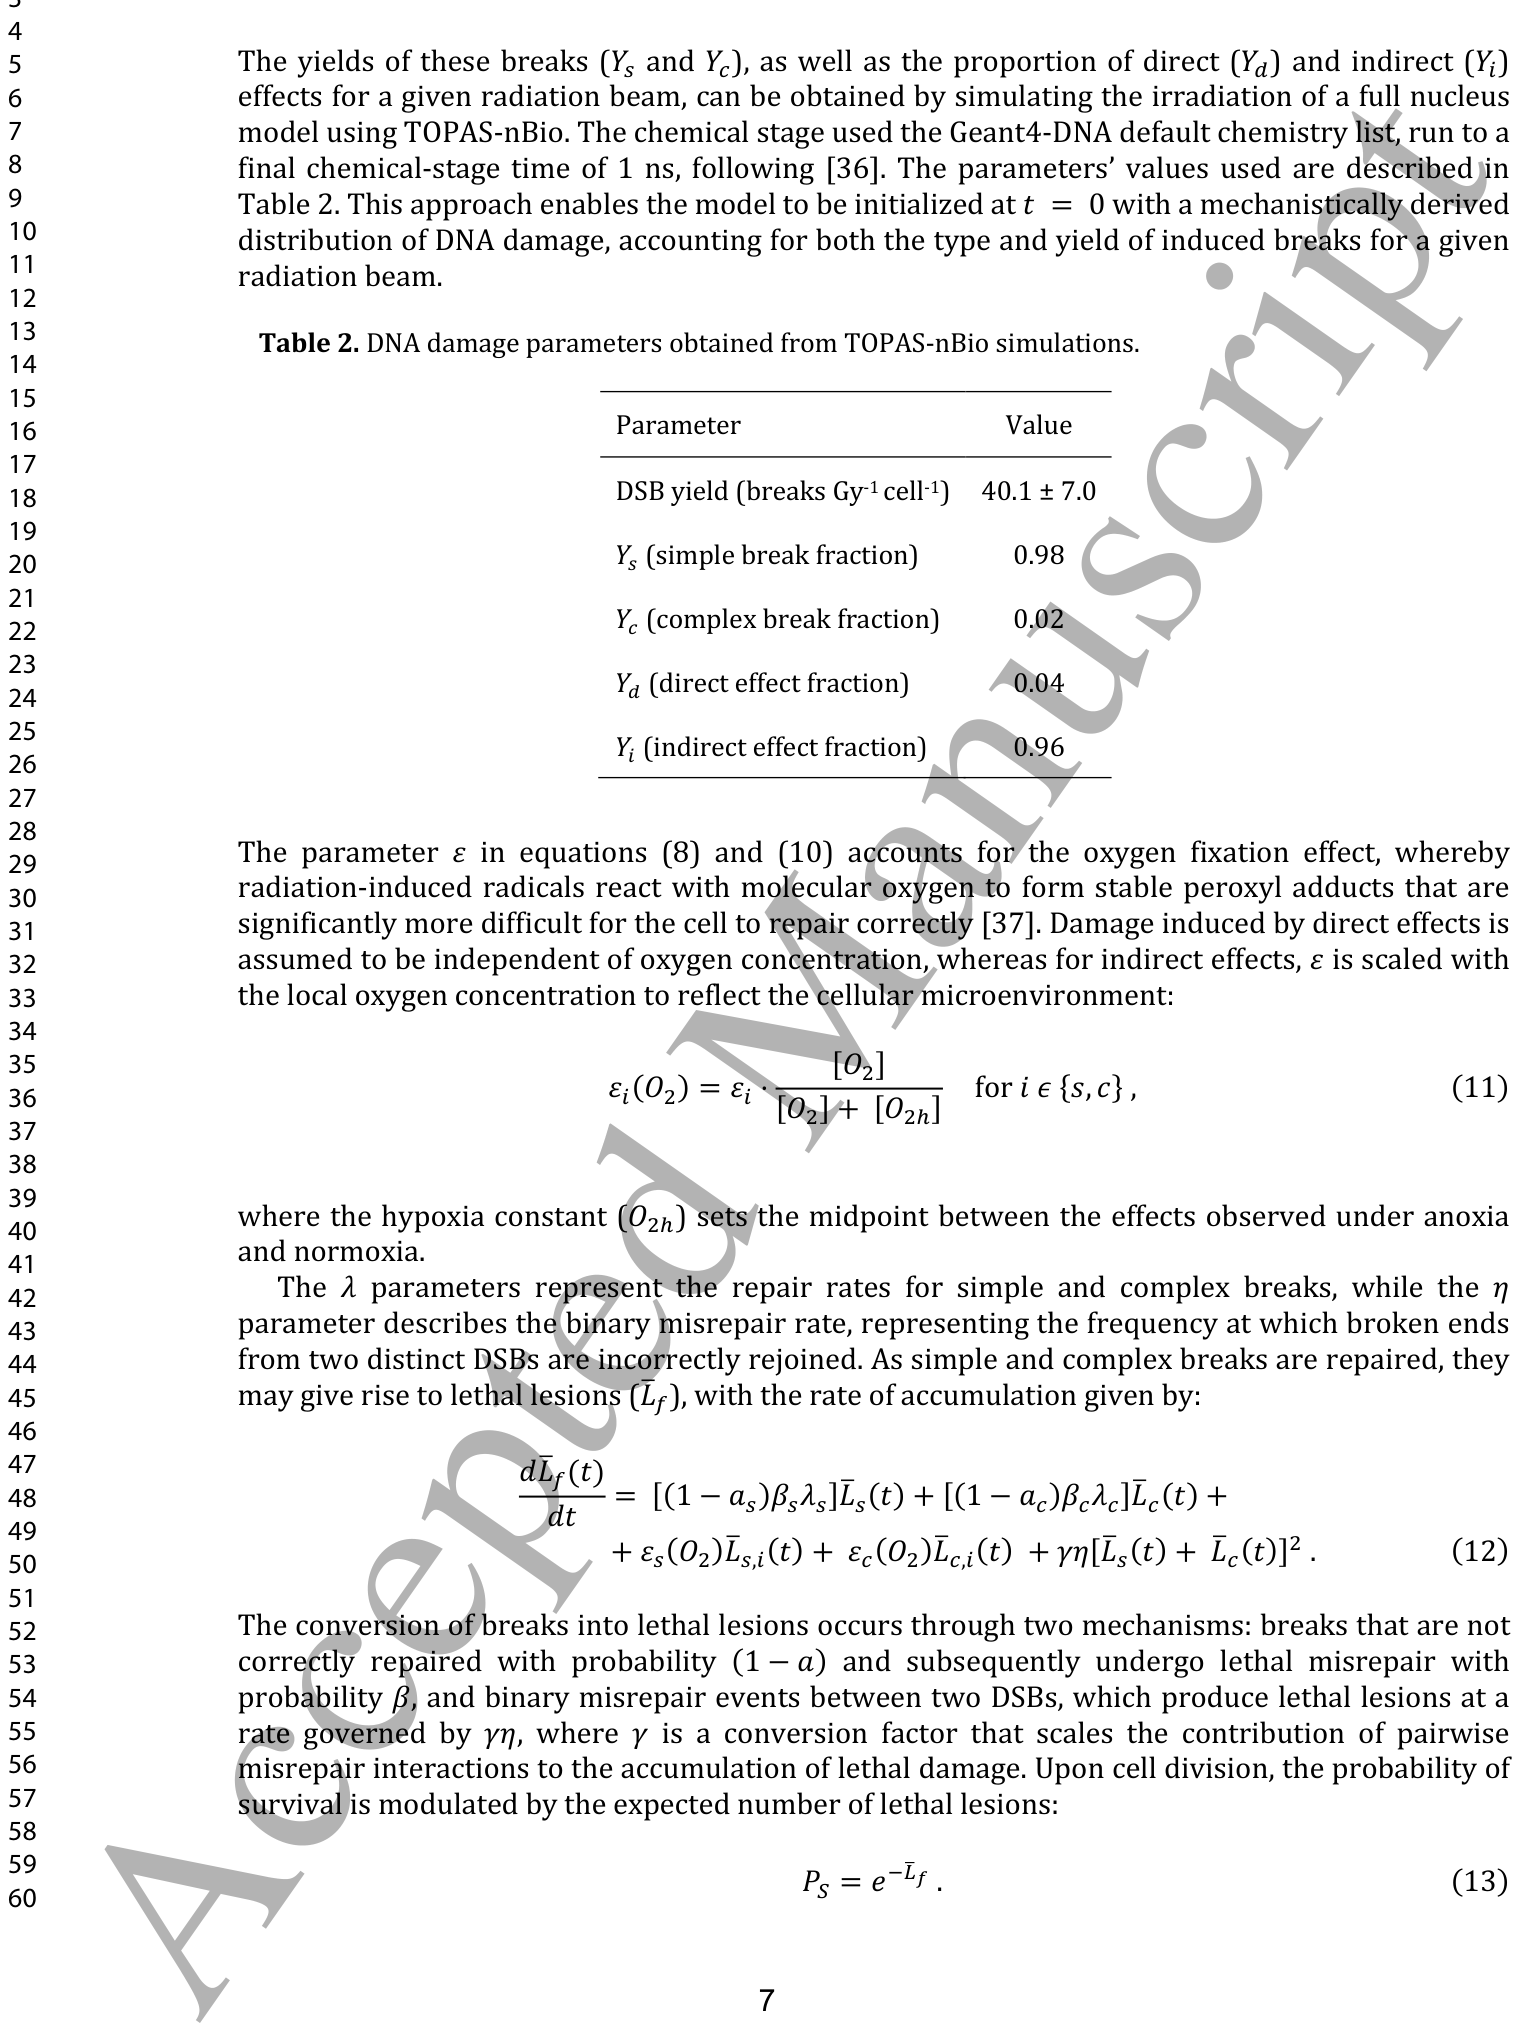
どうも、Beyond the Pixelです。放射線治療は、がん管理において中心的な役割を果たす最も広く利用されている治療法の一つです。その精度、適応性、そして治癒の可能性は、現代のがん治療の礎となっています。しかし、がん組織への線量を最大化しつつ、周囲の健康な組織への損傷を最小限に抑えるというデリケートなバランスが求められます。従来、放射線生物学の研究は2次元の細胞培養に依存していましたが、これらのアッセイは生体内の腫瘍環境を十分に反映しているとは言えません。腫瘍は3次元構造を持ち、細胞が互いに、細胞外マトリックスと、そして周囲の組織の細胞と相互作用し、栄養素、酸素、シグナル分子の勾配の影響を受けます。これらの要因は放射線応答に影響を与え、スフェロイド(3次元細胞構造で、その増殖、生存能力、および組織構造による放射線応答の調節といった基本的な細胞挙動を、従来の2D培養よりも生体内に近い環境で検証するのに役立つ)のような3D細胞モデルを用いることでより良く研究できます。これらのモデルとin silicoモデル(コンピュータシミュレーションを用いて生物学的プロセスや現象をモデル化・解析する手法)の統合は、放射線治療のモデリングにさらなる洞察をもたらします。過去の研究では、エージェントベースモデルとモンテカルロ法(多数のランダムな事象をシミュレートすることで、複雑な物理現象の確率的な振る舞いを予測する計算手法)を組み合わせる試みがされてきましたが、DNA修復動態や酸素依存性の放射線感受性をモデル化していない、2D幾何学に限定されている、特定の実験データとエンドツーエンドで検証されていないといった側面が未解決でした。この研究では、腫瘍スフェロイドの成長ダイナミクスから分割照射、そして治療後の生存率と形態に至るまで、各段階で実験データとエンドツーエンドで較正された、完全なスフェロイド生存アッセイを段階的に再現する独自のアプローチを開発しました。
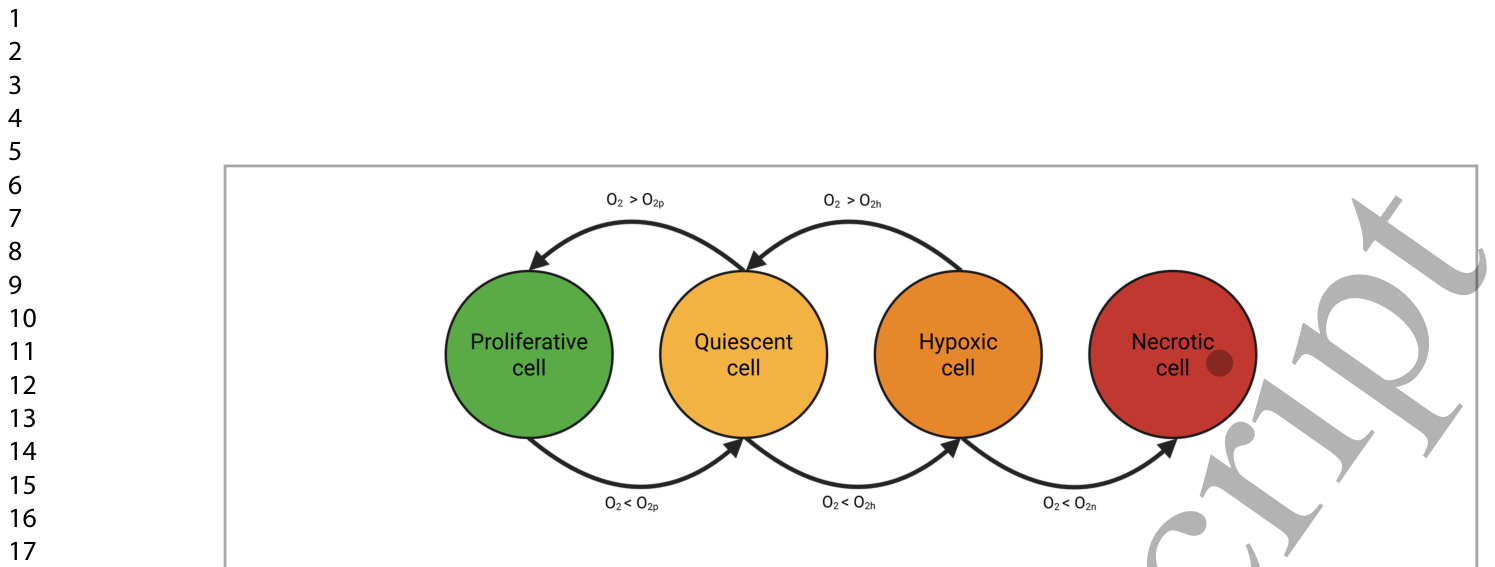
Figure 1. Figure 1. Cell states in tissues or 3D cultures progressively change depending on its oxygen availability. As oxygen diffuses outwards, it creates a gradient that determines the proliferative, quiescent, hypoxic and necrotic states of the cells.解説: この図は、組織または3D培養における細胞の状態が酸素利用可能性に応じて段階的に変化する様子を示しています。酸素が外側に拡散するにつれて勾配が生じ、細胞の増殖期、静止期、低酸素期、壊死期の各状態が決定されることを表しています。
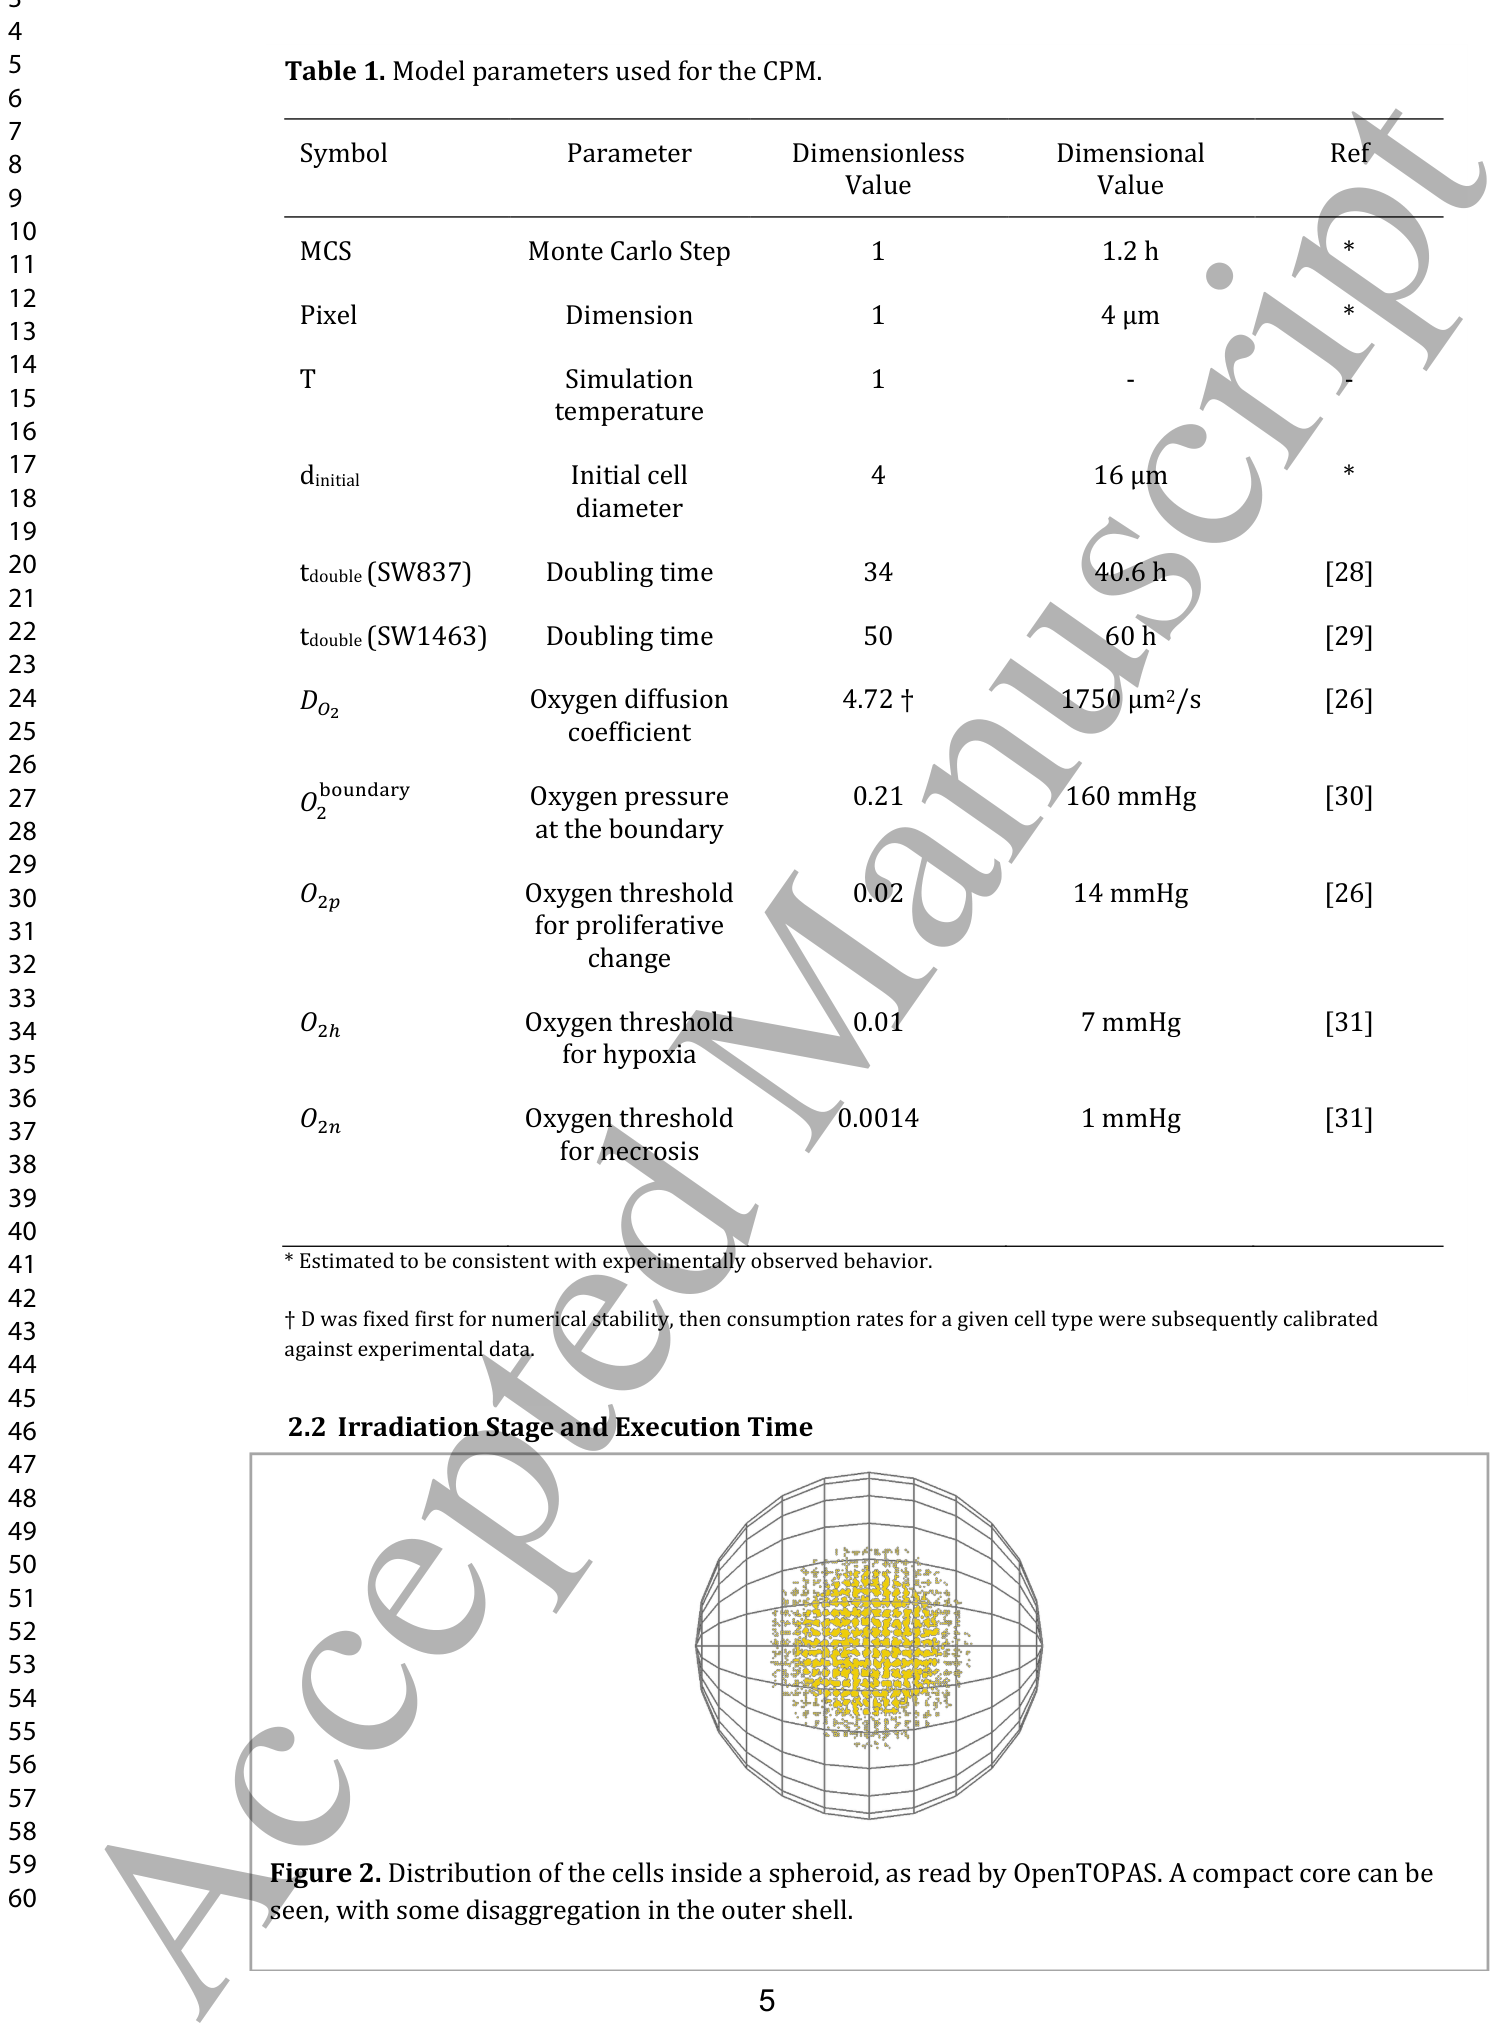
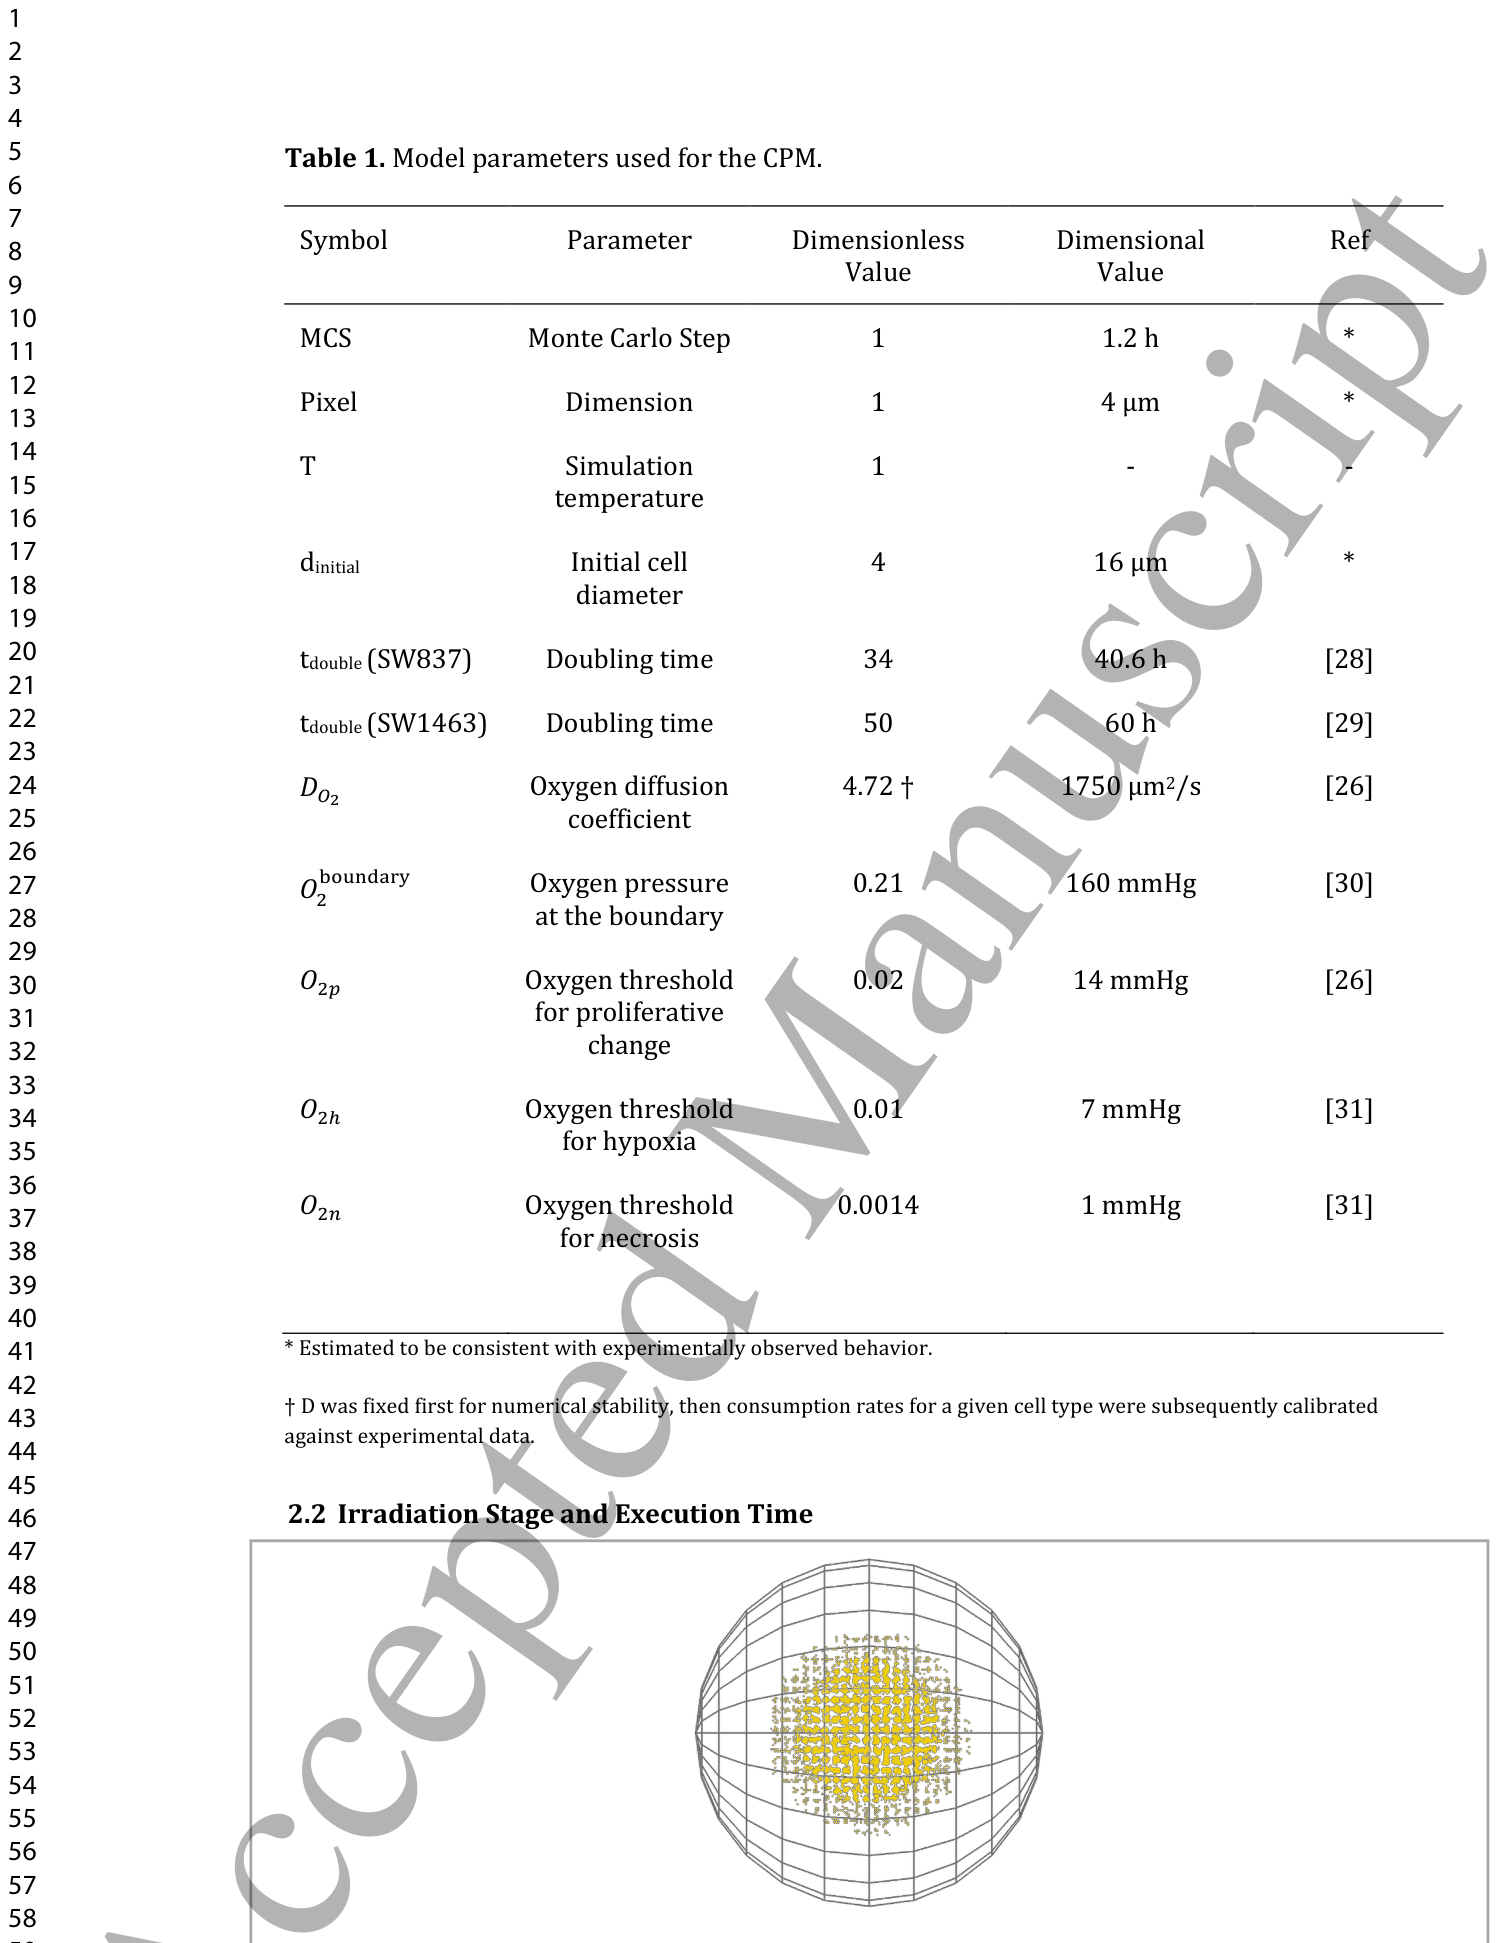
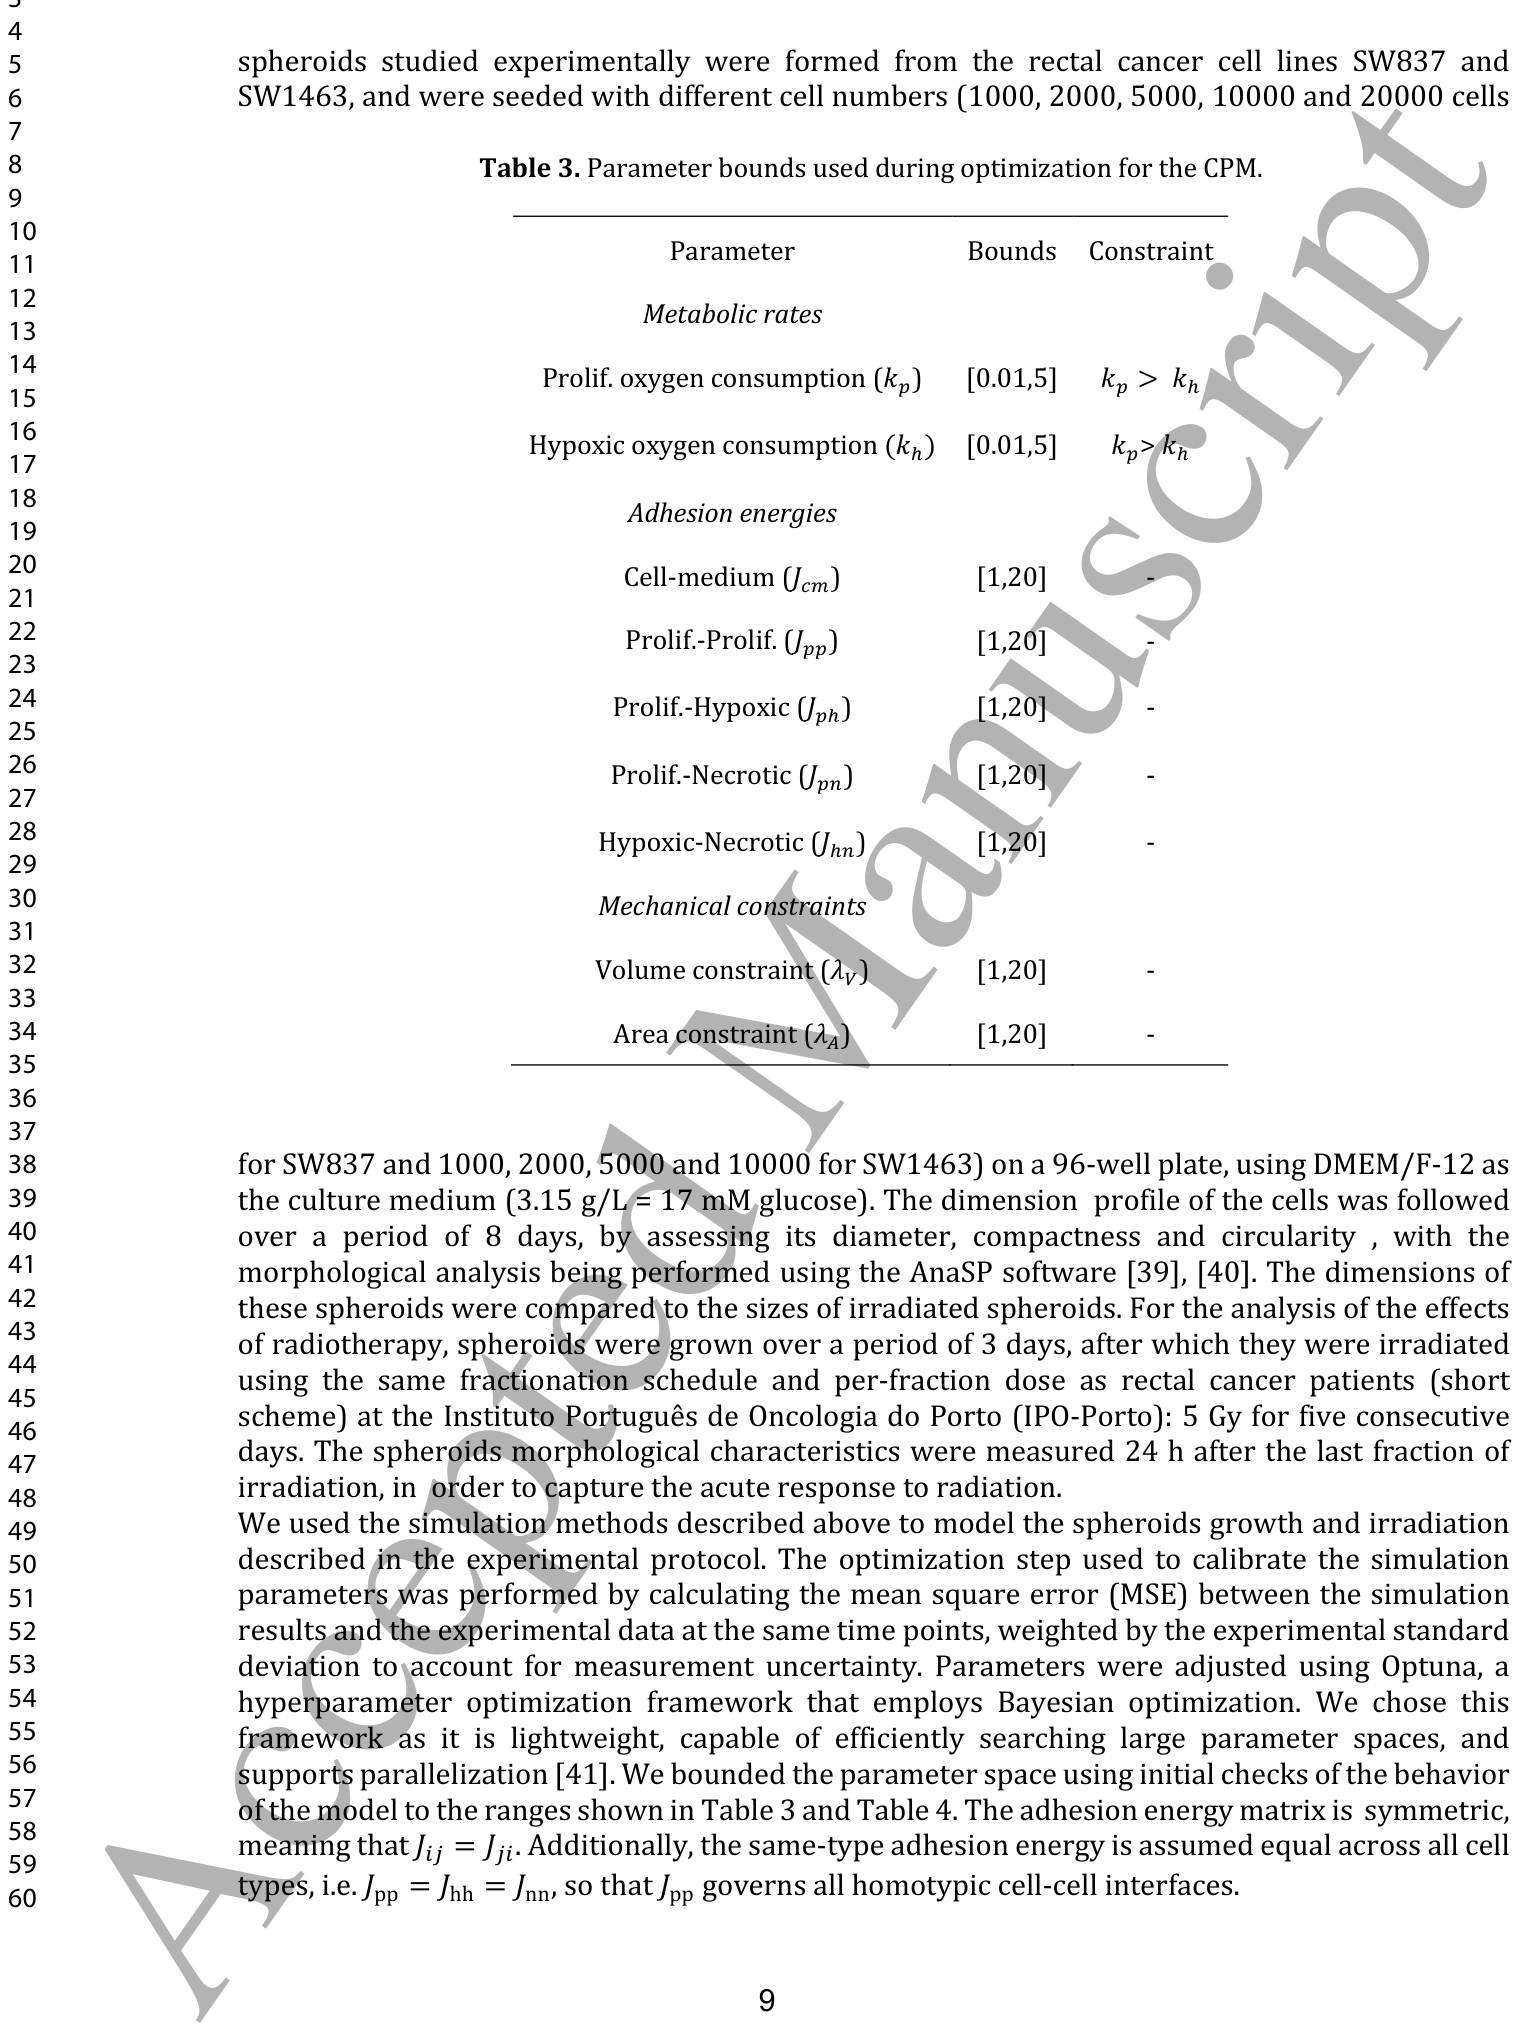
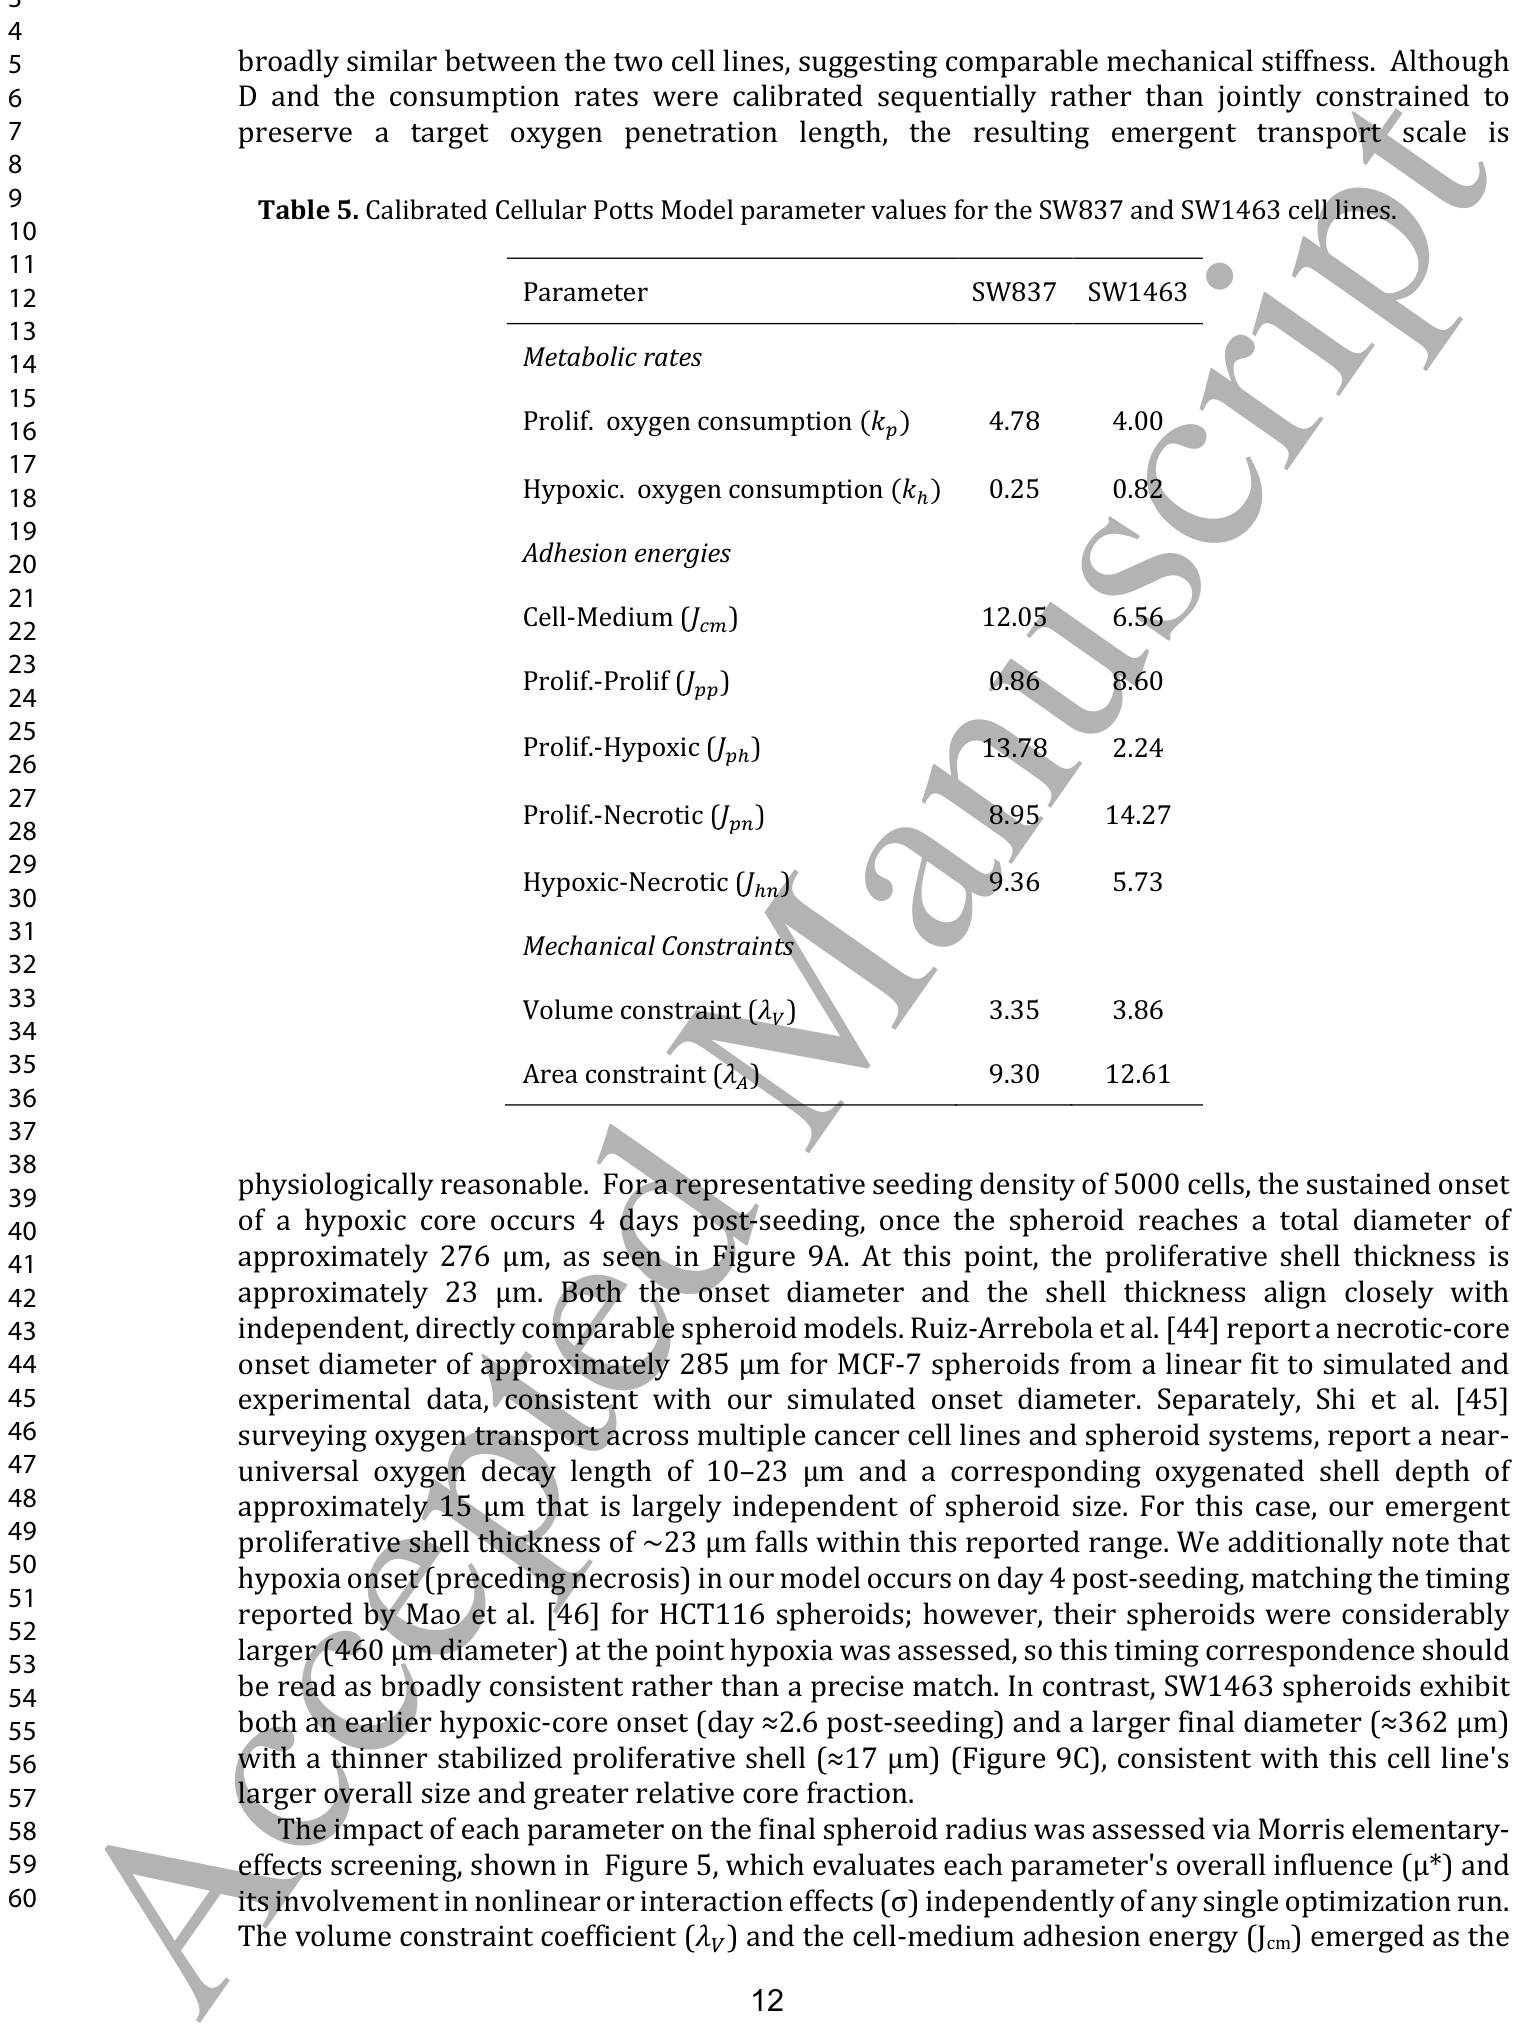
Table 1. Table 1. Model parameters used for the CPM.
に示されています。
照射シミュレーション:OpenTOPASの活用
CPMシミュレーション中に、任意の時点で細胞の位置と半径をOpenTOPAS(Open TOol for PArticle Simulation:Geant4モンテカルロツールキットを基盤とする、粒子線相互作用シミュレーションのためのユーザーフレンドリーなインターフェース)と互換性のある形式でエクスポートできます。
Figure 2. Figure 2. Distribution of the cells inside a spheroid, as read by OpenTOPAS. A compact core can be seen, with some disaggregation in the outer shell.解説: この図は、OpenTOPASによって読み込まれたスフェロイド内部の細胞分布を示しています。外層ではわずかな凝集の崩壊が見られるものの、コンパクトなコアが存在することが確認できます。
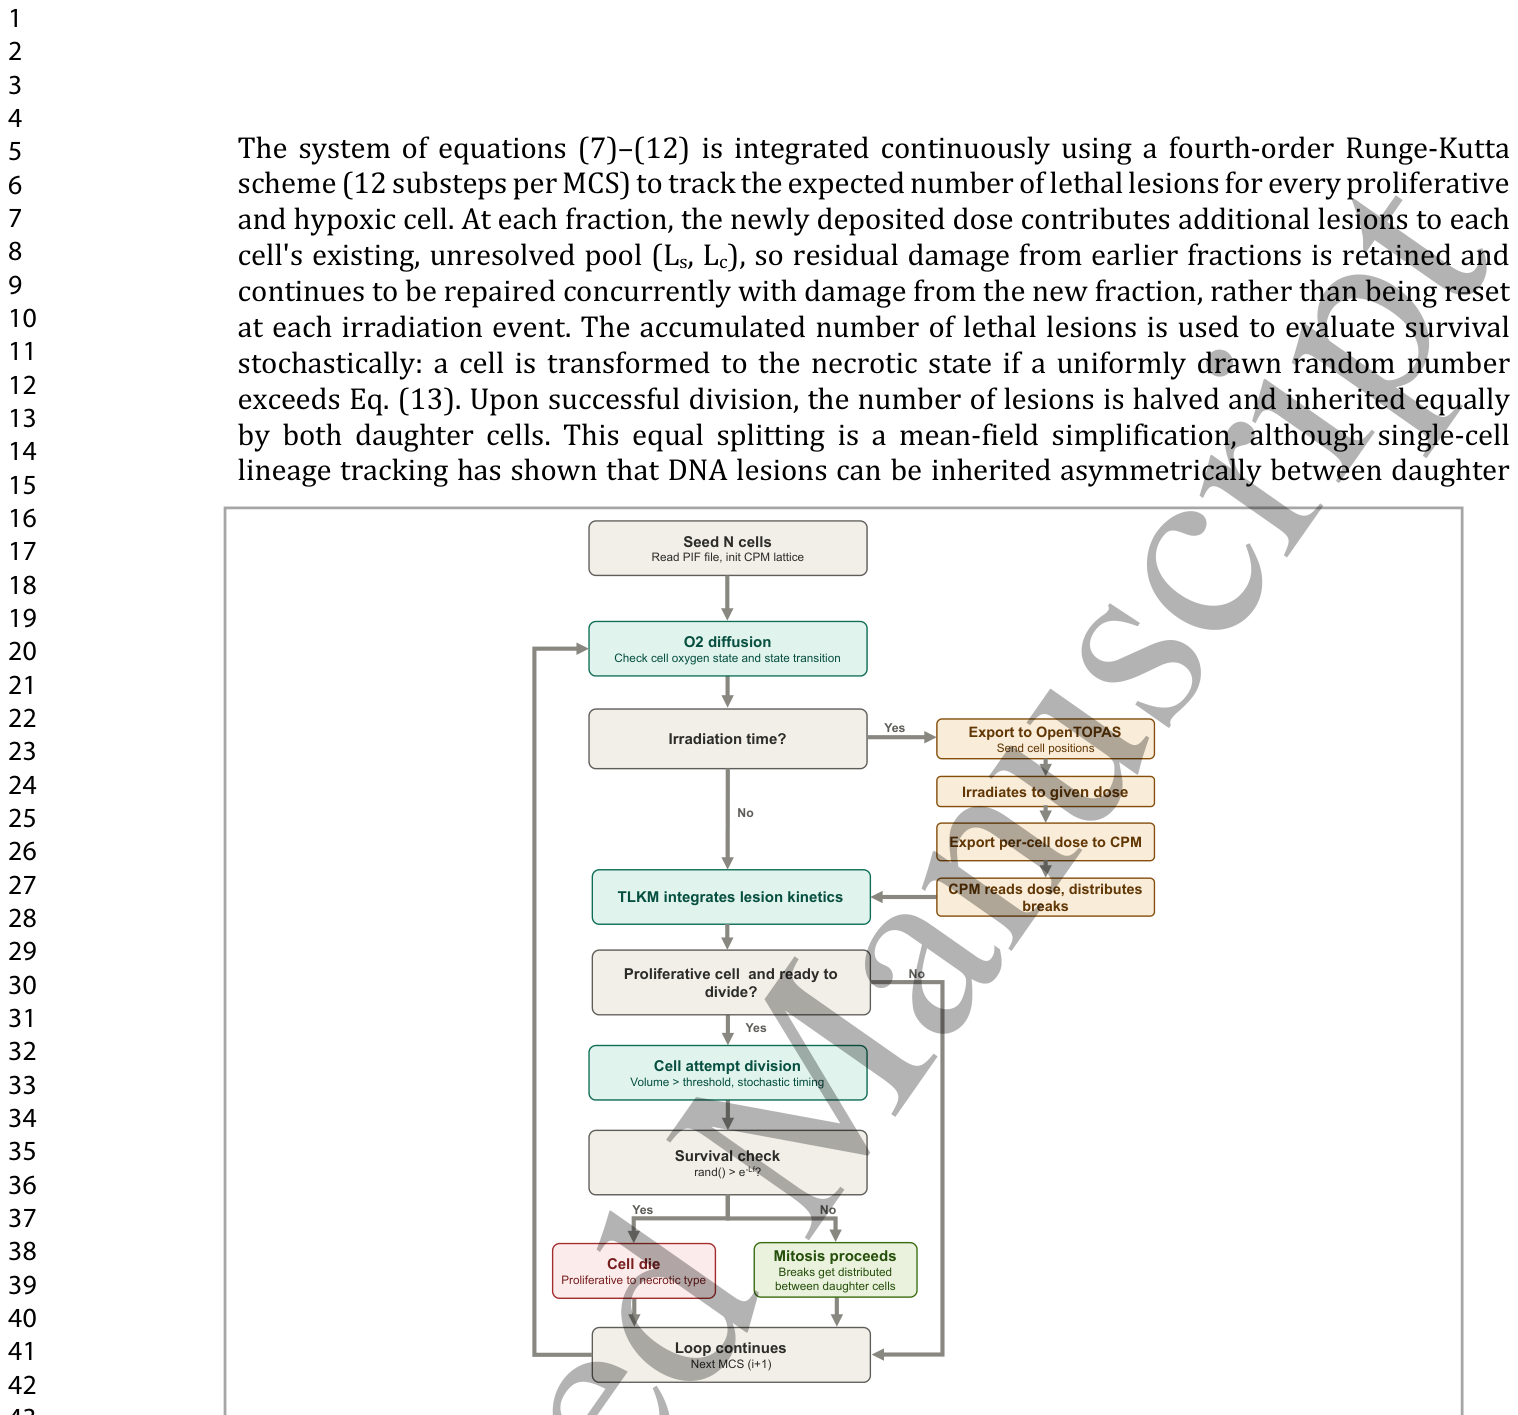
Figure 3. Figure 3. Workflow of the coupled CPM–OpenTOPAS–TLKM simulation. At each Monte Carlo Step (MCS), the oxygen field is updated and used to evaluate each cell's oxygen state and any resulting state transition. When the scheduled irradiation time is reached, cell positions are exported to OpenTOPAS, the spheroid is irradiated to the prescribed dose, and the resulting per-cell dose is returned to the CPM, where the TLKM uses it to integrate lesion kinetics and distribute DNA breaks. Proliferative cells that have reached the division threshold attempt mitosis, subject to a stochastic timing condition and a survival check based on the expected number of lethal lesions; cells that fail this check turn into a necrotic cell, while surviving cells divide and their breaks are distributed between daughter cells. The loop then proceeds to the next MCS.解説: この図は、CPM、OpenTOPAS、TLKMを結合したシミュレーションのワークフローを示しています。各モンテカルロステップ(MCS)で酸素場が更新され、細胞の酸素状態とそれに伴う状態遷移が評価されます。予定された照射時刻に達すると、細胞位置がOpenTOPASにエクスポートされ、スフェロイドが所定線量で照射され、その結果得られる細胞ごとの線量がCPMに返されます。CPMではTLKMが損傷動力学を統合し、DNA切断を分配します。分裂閾値に達した増殖細胞は有糸分裂を試み、確率的なタイミング条件と致死性病変の予測数に基づく生存チェックを受けます。このチェックに失敗した細胞は壊死細胞へと変化し、生き残った細胞は分裂し、その損傷は娘細胞に分配されます。その後、ループは次のMCSに進みます。
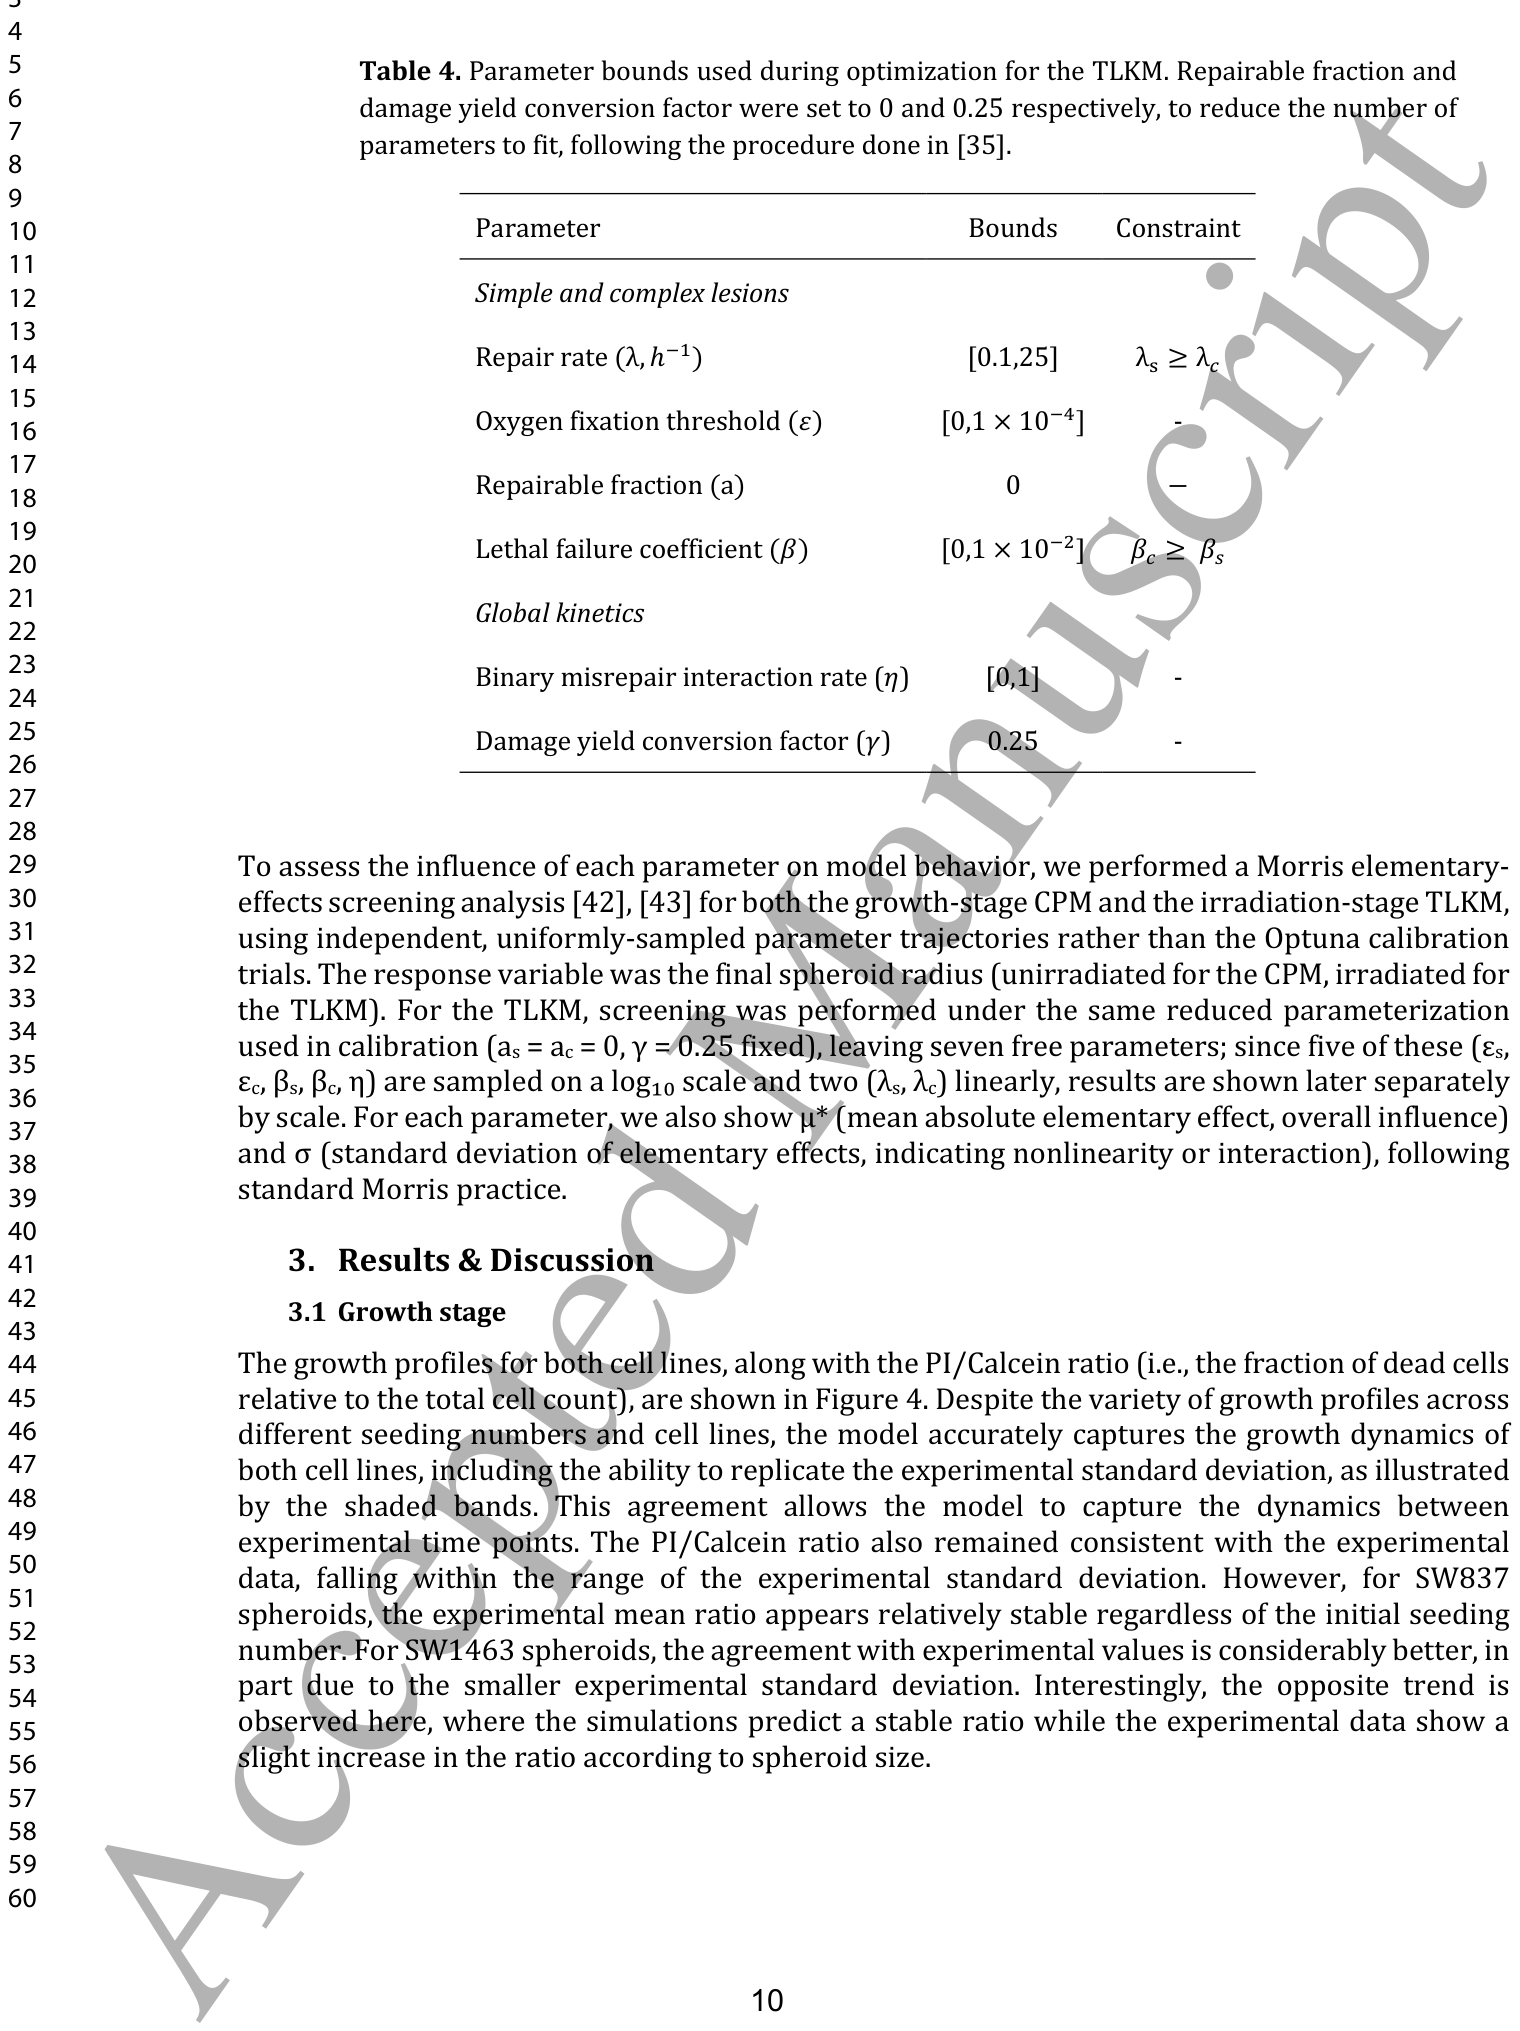
に示されています。TLKMの最適化に使用されるパラメータの上限は
Table 4. Table 4. Parameter bounds used during optimization for the TLKM. Repairable fraction and damage yield conversion factor were set to 0 and 0.25 respectively, to reduce the number of parameters to fit, following the procedure done in [35].
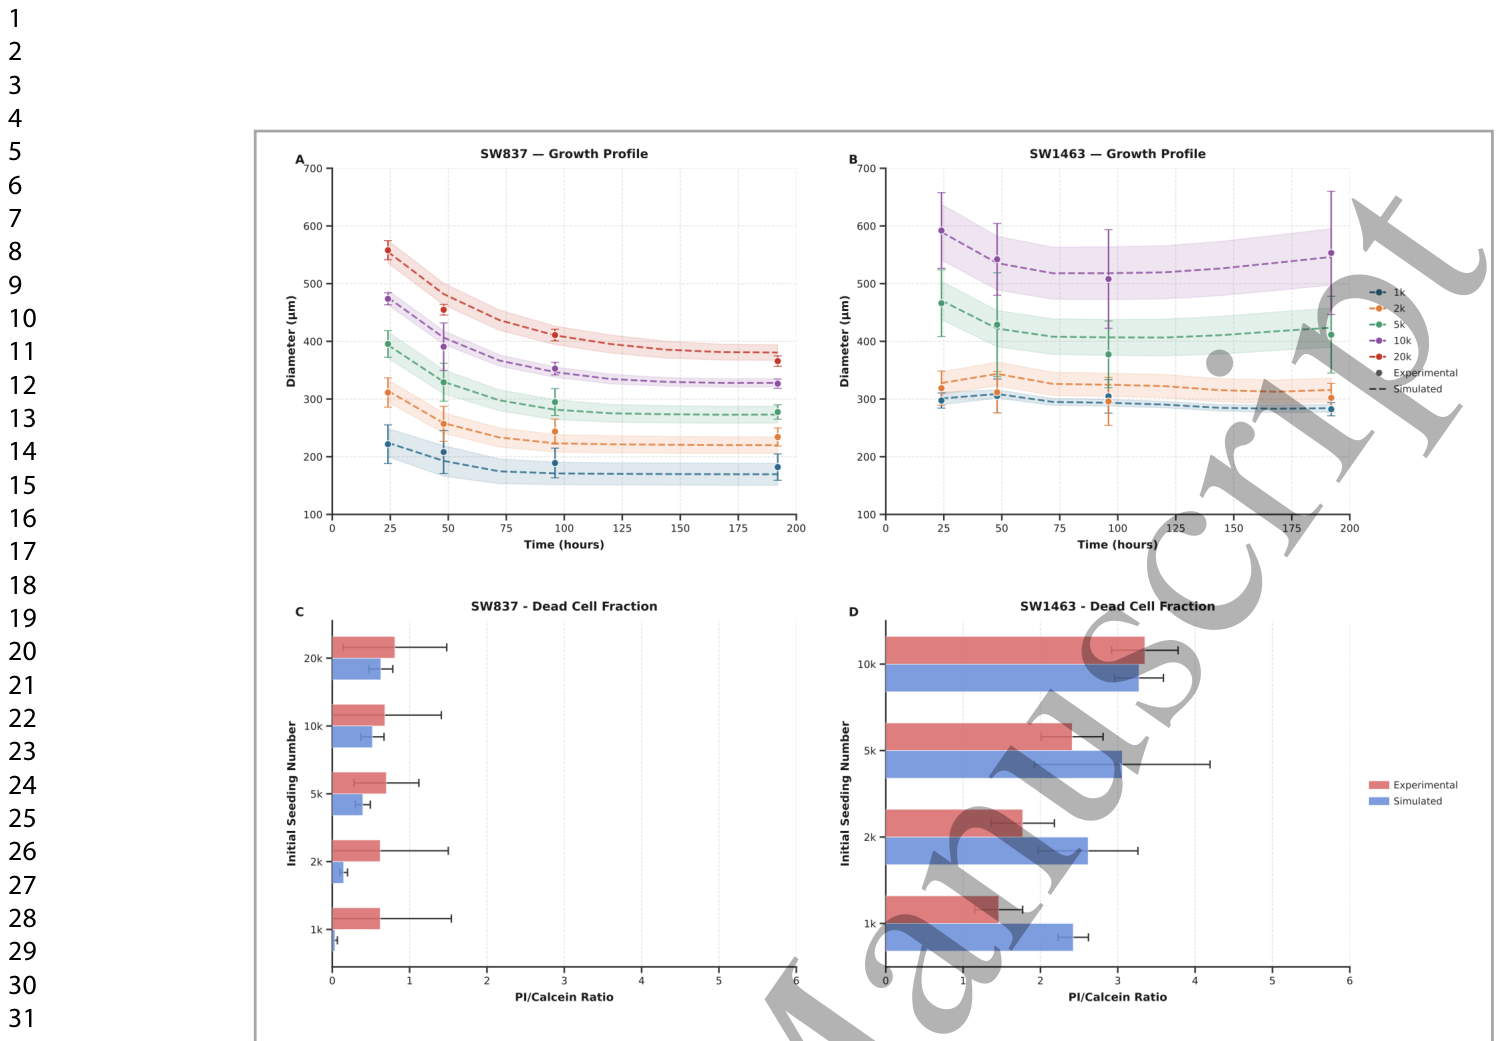
Figure 4. Figure 4. Comparison of experimental and simulated results for SW837 (A, C) and SW1463 (B, D) spheroids across different initial seeding densities (from 1000 to 20000 cells). Panels A and B show the spheroid growth profiles, where dots represent the experimental mean diameter with error bars denoting the experimental standard deviation, and dashed lines represent the mean simulated diameter across N=5 independent runs, with the shaded overlay indicating the standard deviation. Panels C and D show the PI/Calcein ratio, where experimental values are shown with error bars representing the experimental standard deviation, and simulated values are shown with error bars representing the standard deviation across N=5 independent runs.解説: SW837(A, C)およびSW1463(B, D)スフェロイドについて、異なる初期播種密度(1000~20000細胞)における実験結果とシミュレーション結果の比較を示しています。パネルAとBはスフェロイドの成長プロファイルを示しており、点線がN=5回の独立したシミュレーション実行における平均シミュレーション直径、網掛けの領域が標準偏差を表しています。パネルCとDはPI/Calcein比を示しており、実験値は実験標準偏差を示すエラーバーと共に、シミュレーション値はN=5回の独立したシミュレーション実行における標準偏差を示すエラーバーと共に表示されています。
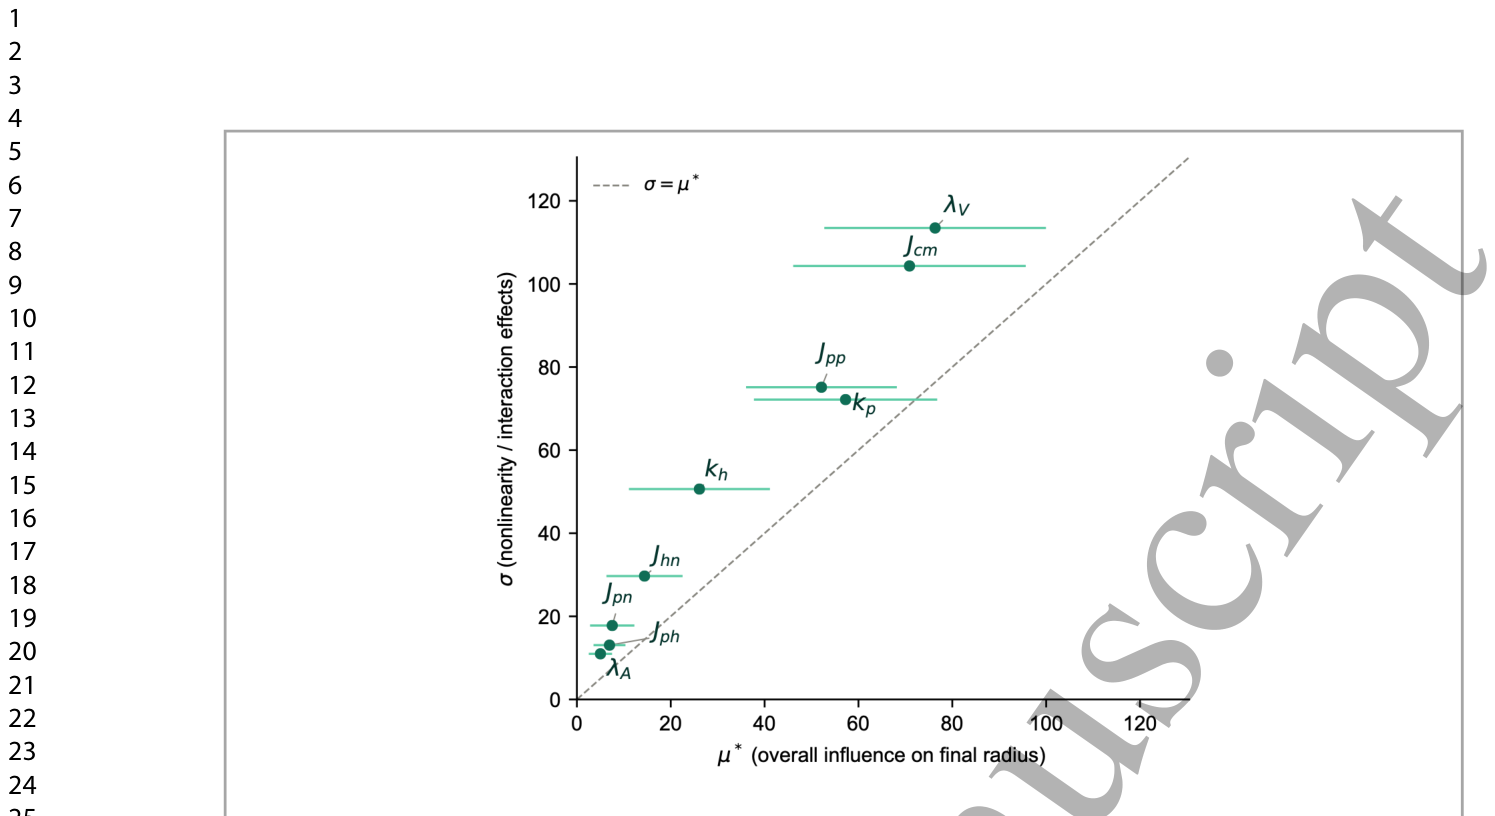
Figure 5. Figure 5. Morris elementary-effects screening of the nine growth-stage CPM parameters affecting the final (unirradiated) spheroid radius. Each point shows a parameter's overall influence (μ*, mean absolute elementary effect) plotted against its involvement in nonlinear or interaction effects (σ, standard deviation of elementary effects); horizontal error bars denote the confidence interval on μ*. The dashed line marks σ = μ*, the standard Morris reference indicating equal linear and nonlinear/interaction contribution. The volume constraint (λV) and cell-medium adhesion energy (Jcm) show the greatest overall influence on the final radius, followed by the proliferative oxygen consumption rate (kp) and proliferative-proliferative interfacial energy (Jpp). All nine parameters fall above the σ = μ* line, indicating that nonlinear and interaction effects dominate over independent, additive contributions across the parameter space.解説: この図は、最終的な(非照射)スフェロイド半径に影響を与える9つの成長段階CPMパラメータのMorris elementary-effectsスクリーニング分析を示しています。各点は、パラメータの全体的な影響(μ*、平均絶対基本効果)と非線形または相互作用効果への関与(σ、基本効果の標準偏差)をプロットしたもので、横方向のエラーバーはμ*の信頼区間を示しています。破線はσ = μ*を示し、線形および非線形/相互作用の寄与が等しいことを示す標準的なMorris参照線です。体積制約($ ext{λ}_V$)と細胞-培地接着エネルギー($J_{cm}$)が最終的な半径に最も大きな全体的影響を示し、増殖期酸素消費率($k_p$)と増殖期-増殖期界面エネルギー($J_{pp}$)がそれに続きます。9つのパラメータすべてがσ = μ*線の上に位置しており、パラメータ空間全体で非線形および相互作用効果が独立した相加的寄与よりも支配的であることを示しています。
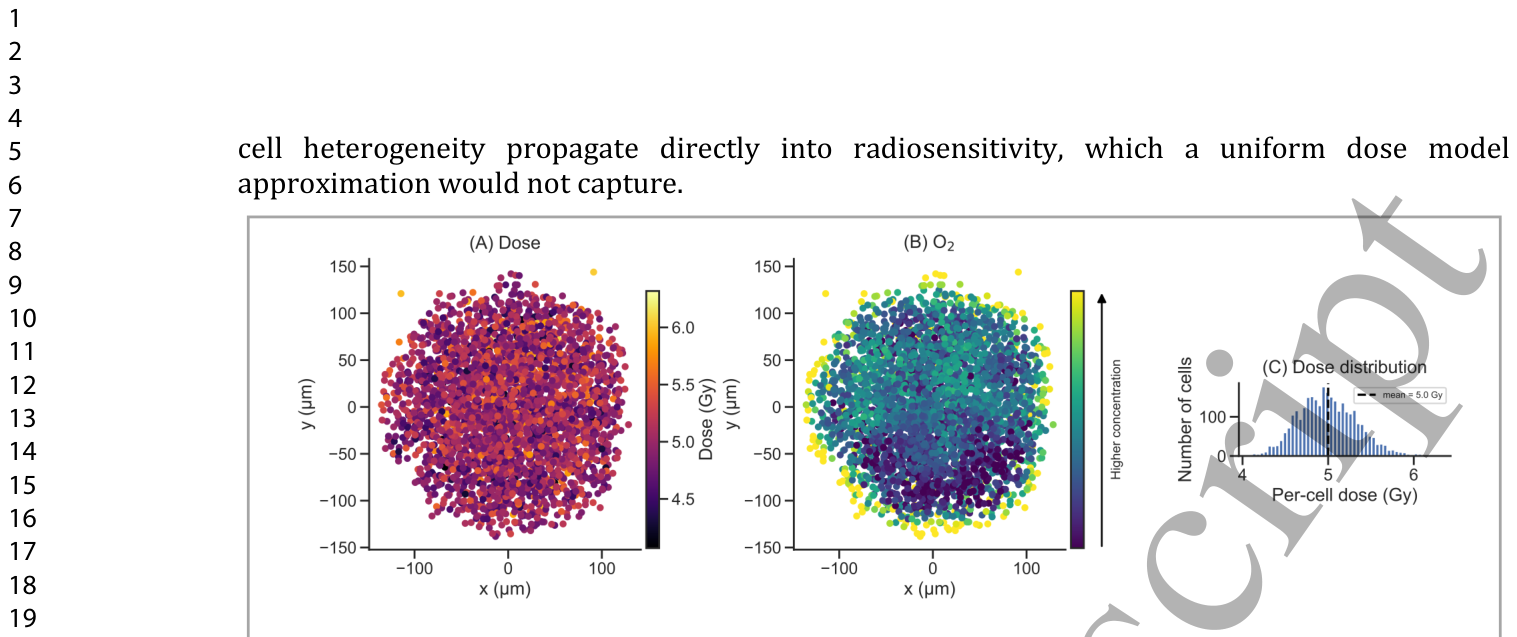
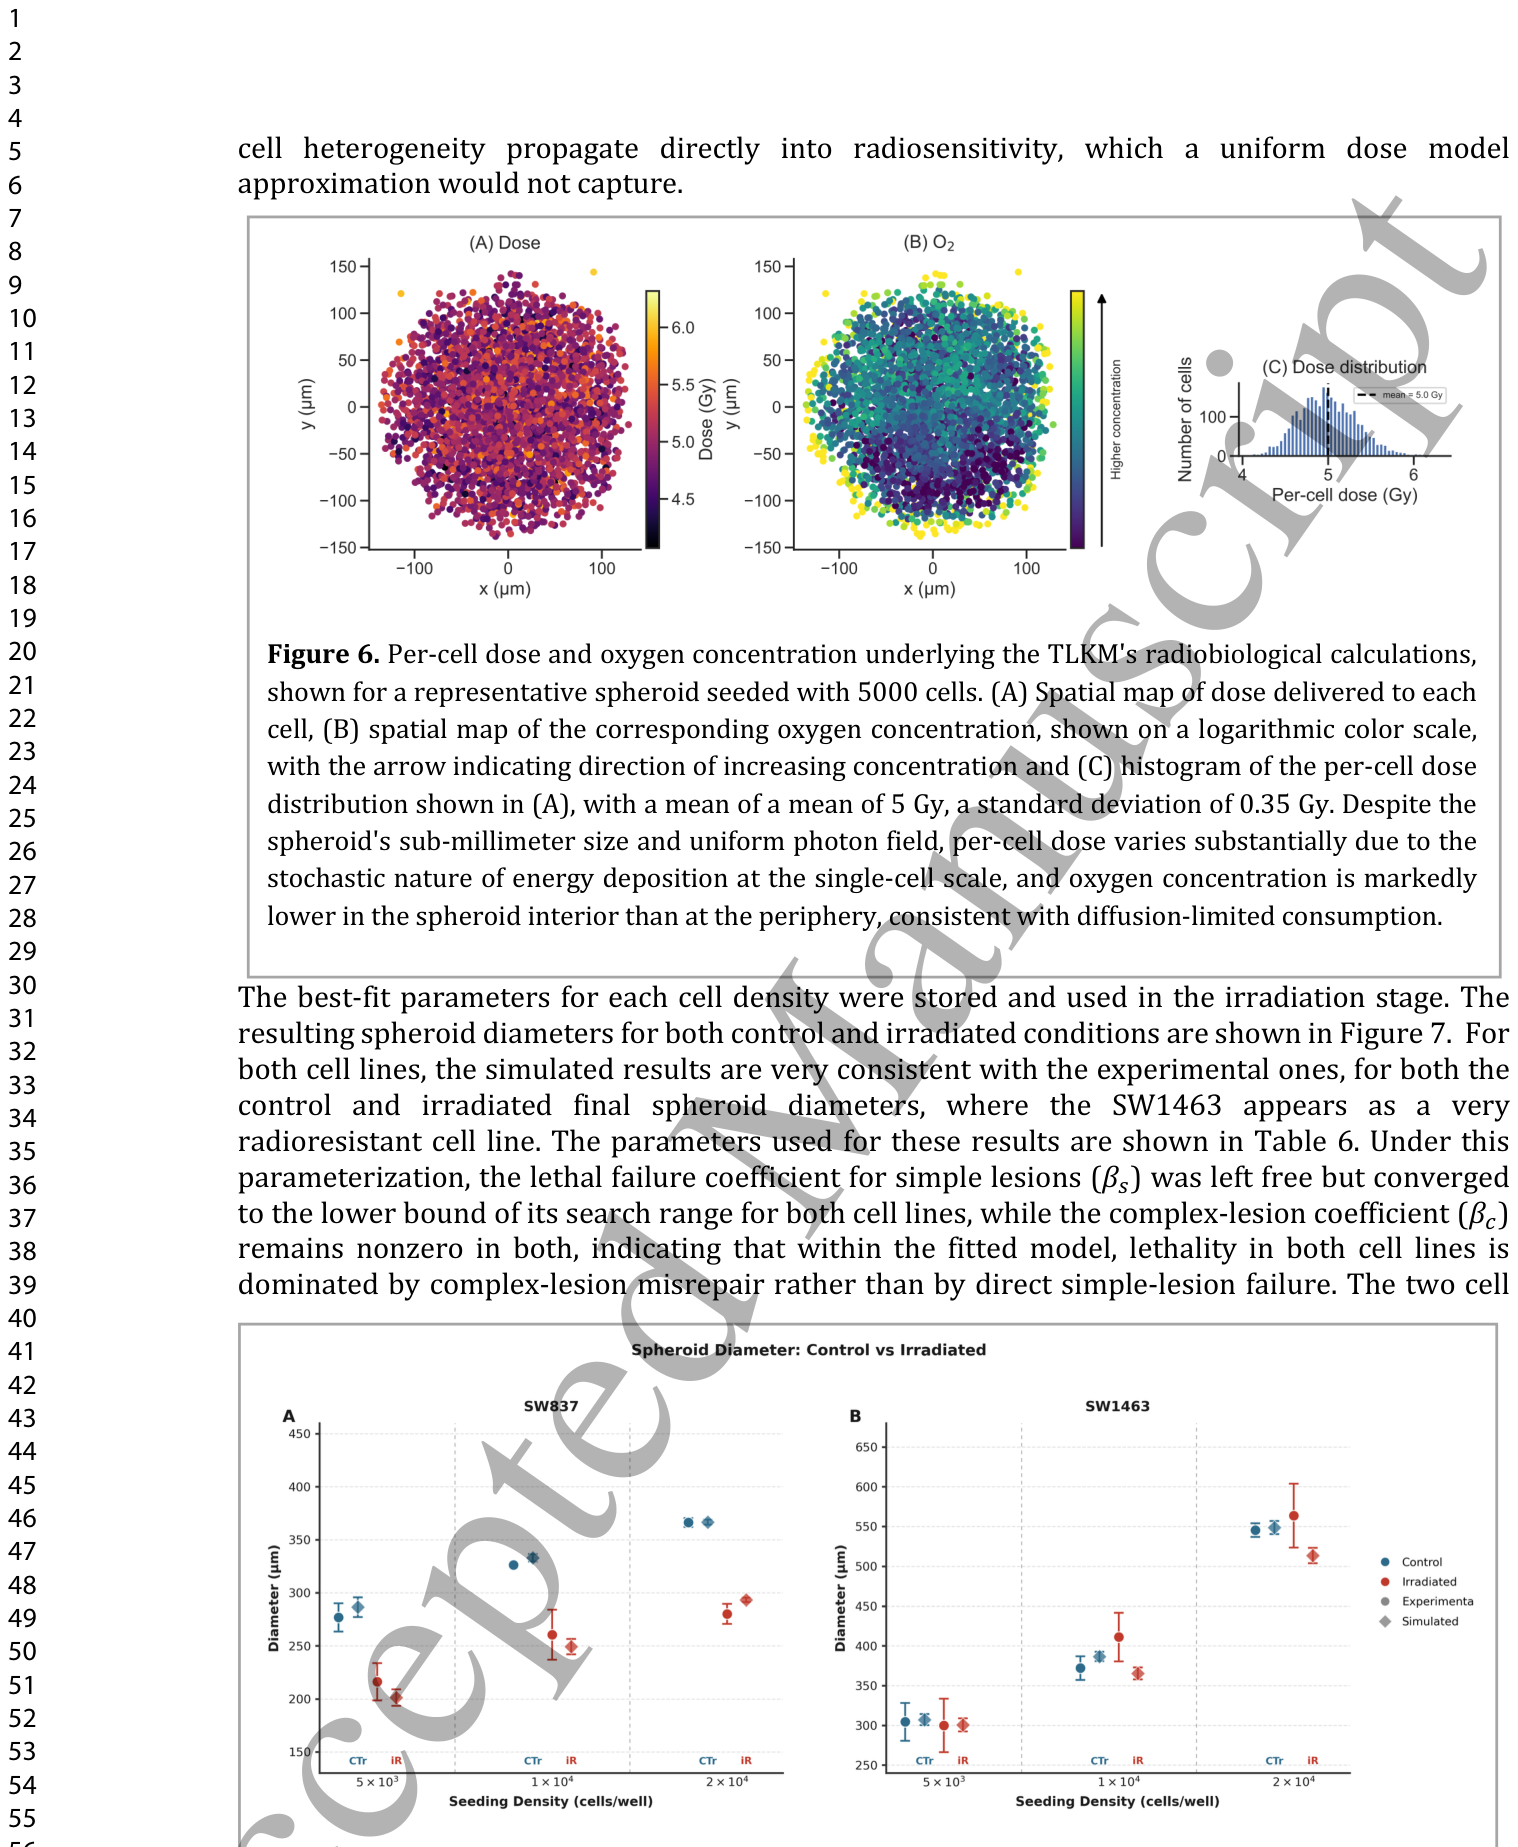
Figure 6. Figure 6. Per-cell dose and oxygen concentration underlying the TLKM's radiobiological calculations, shown for a representative spheroid seeded with 5000 cells. (A) Spatial map of dose delivered to each cell, (B) spatial map of the corresponding oxygen concentration, shown on a logarithmic color scale, with the arrow indicating direction of increasing concentration and (C) histogram of the per-cell dose distribution shown in (A), with a mean of a mean of 5 Gy, a standard deviation of 0.35 Gy. Despite the spheroid's sub-millimeter size and uniform photon field, per-cell dose varies substantially due to the stochastic nature of energy deposition at the single-cell scale, and oxygen concentration is markedly lower in the spheroid interior than at the periphery, consistent with diffusion-limited consumption.解説: TLKMの放射線生物学的計算の基礎となる細胞ごとの線量と酸素濃度を示しており、代表的な5000細胞播種スフェロイドで示されています。(A) 各細胞に与えられた線量の空間マップ、(B) 対応する酸素濃度の空間マップ(対数カラースケールで示され、矢印は濃度増加方向を示している)、および(C) (A)に示された細胞ごとの線量分布のヒストグラムで、平均5 Gy、標準偏差0.35 Gyです。スフェロイドのサブミリメートルサイズと均一な光子場にもかかわらず、単一細胞スケールでのエネルギー沈着の確率的性質により、細胞ごとの線量は大きく異なり、酸素濃度は拡散律速消費と一致して、スフェロイド内部では周辺部よりも著しく低くなっています。
Figure 7. Figure 7. Comparison of spheroid diameters between control and irradiated conditions for both experimental data and simulation results.解説: この図は、実験データとシミュレーション結果の両方について、コントロール条件と照射条件間のスフェロイド直径の比較を示しています。
これらの結果に用いられたパラメータは
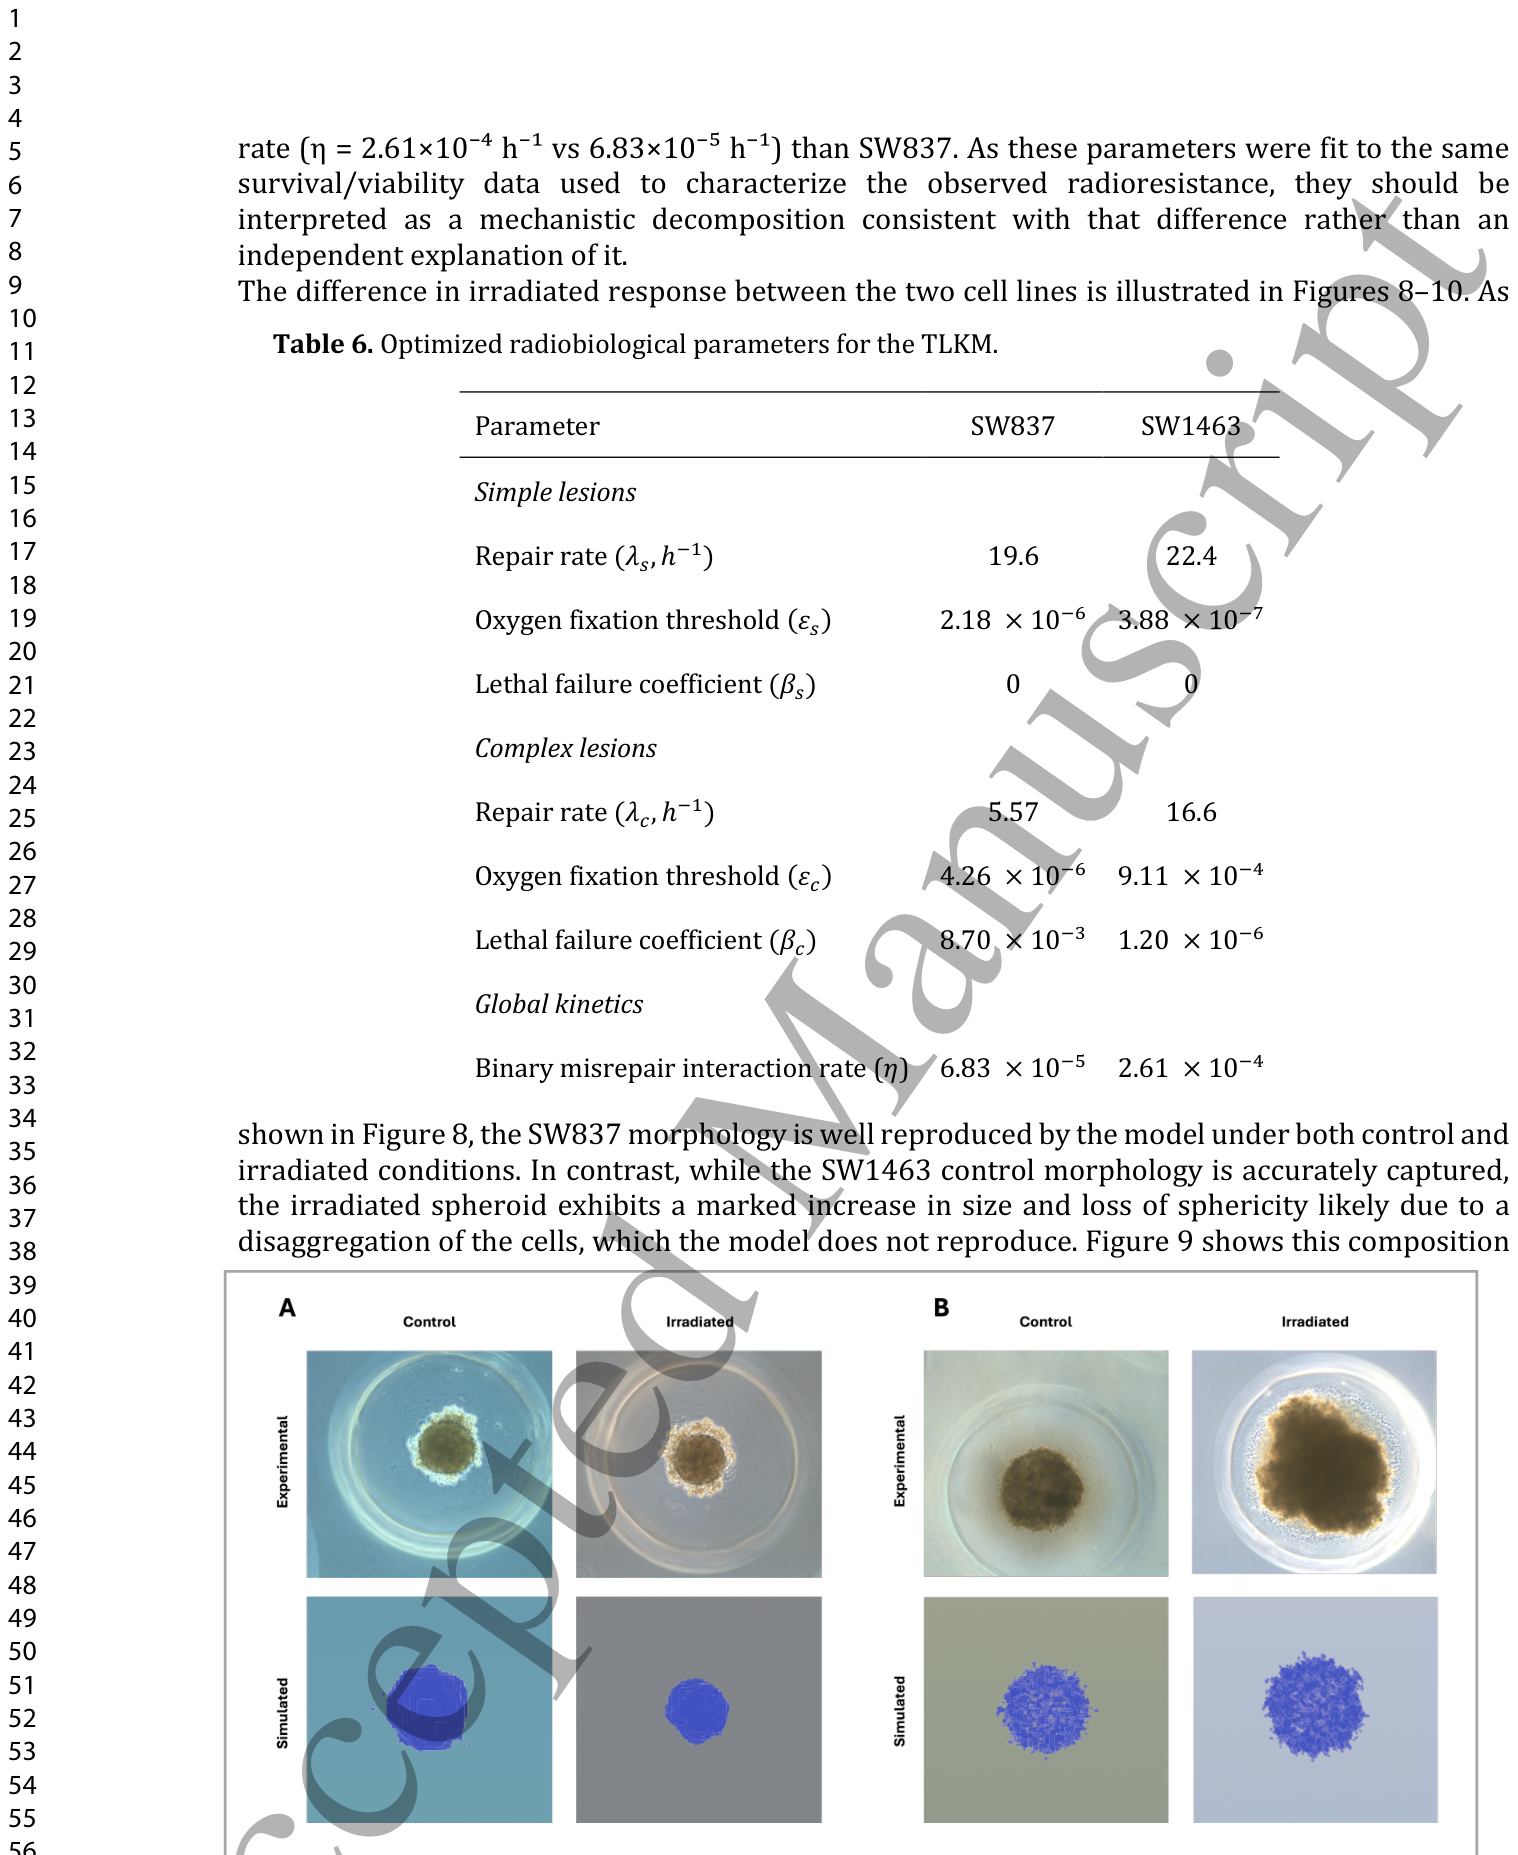
Table 6. Table 6. Optimized radiobiological parameters for the TLKM.
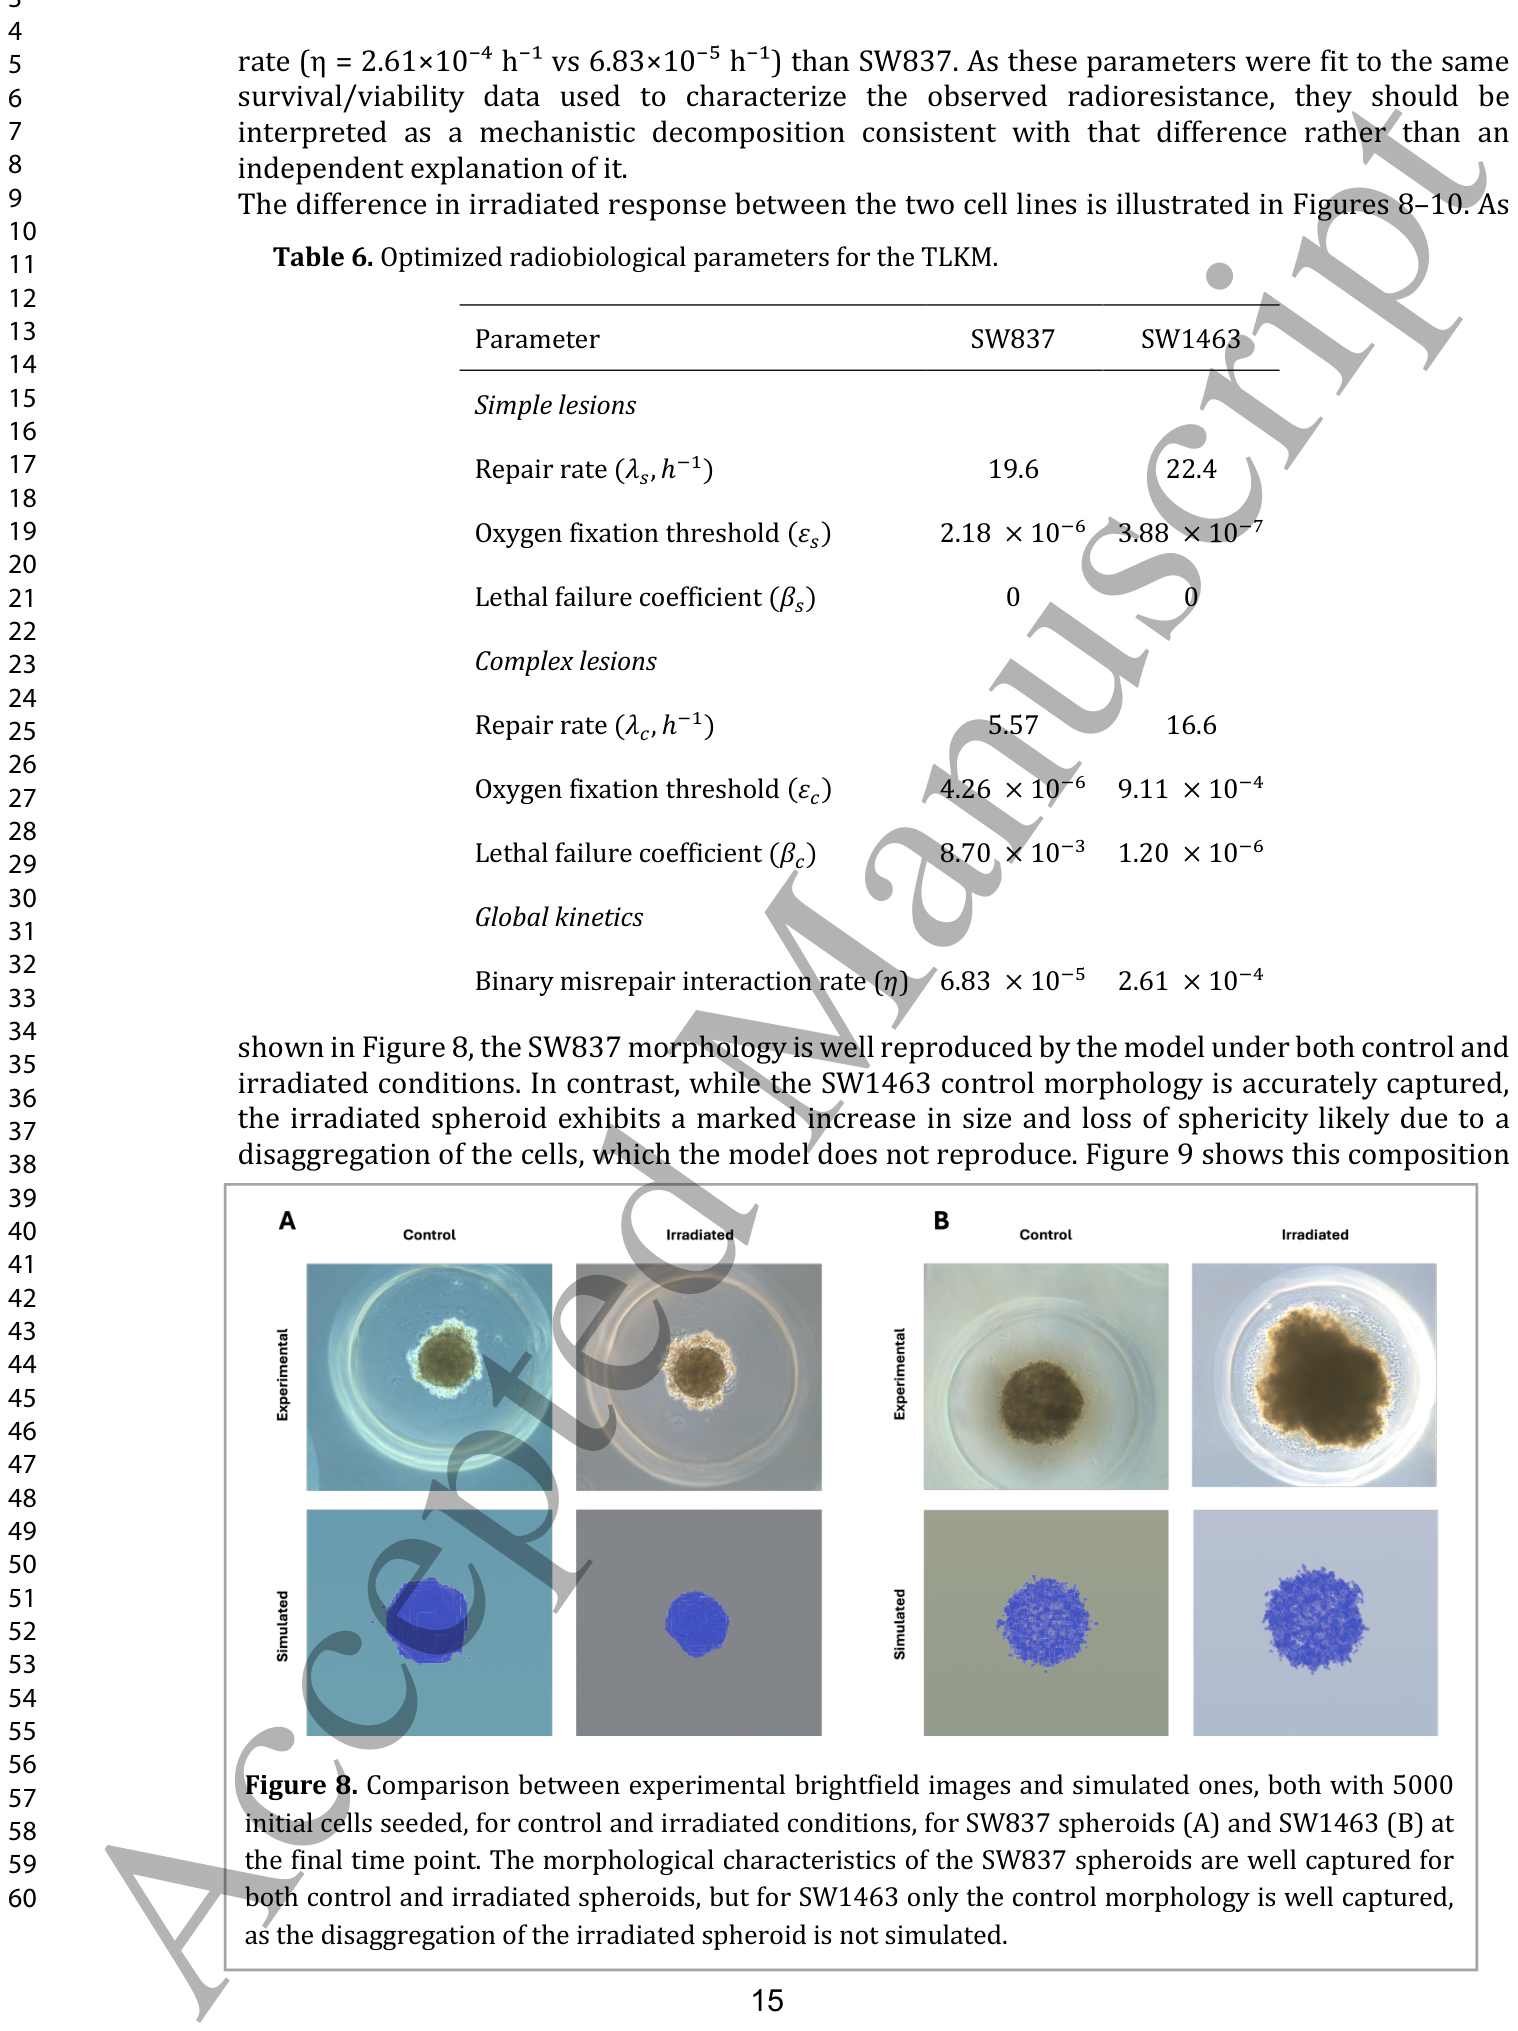
Figure 8. Figure 8. Comparison between experimental brightfield images and simulated ones, both with 5000 initial cells seeded, for control and irradiated conditions, for SW837 spheroids (A) and SW1463 (B) at the final time point. The morphological characteristics of the SW837 spheroids are well captured for both control and irradiated spheroids, but for SW1463 only the control morphology is well captured, as the disaggregation of the irradiated spheroid is not simulated.解説: SW837スフェロイド(A)とSW1463スフェロイド(B)の最終時点における、5000初期細胞を播種したコントロール条件および照射条件下での実験明視野画像とシミュレーション画像の比較です。SW837スフェロイドの形態学的特徴は、コントロールと照射されたスフェロイドの両方でよく捉えられていますが、SW1463では、照射されたスフェロイドの凝集崩壊がシミュレートされていないため、コントロール形態のみがよく捉えられています。
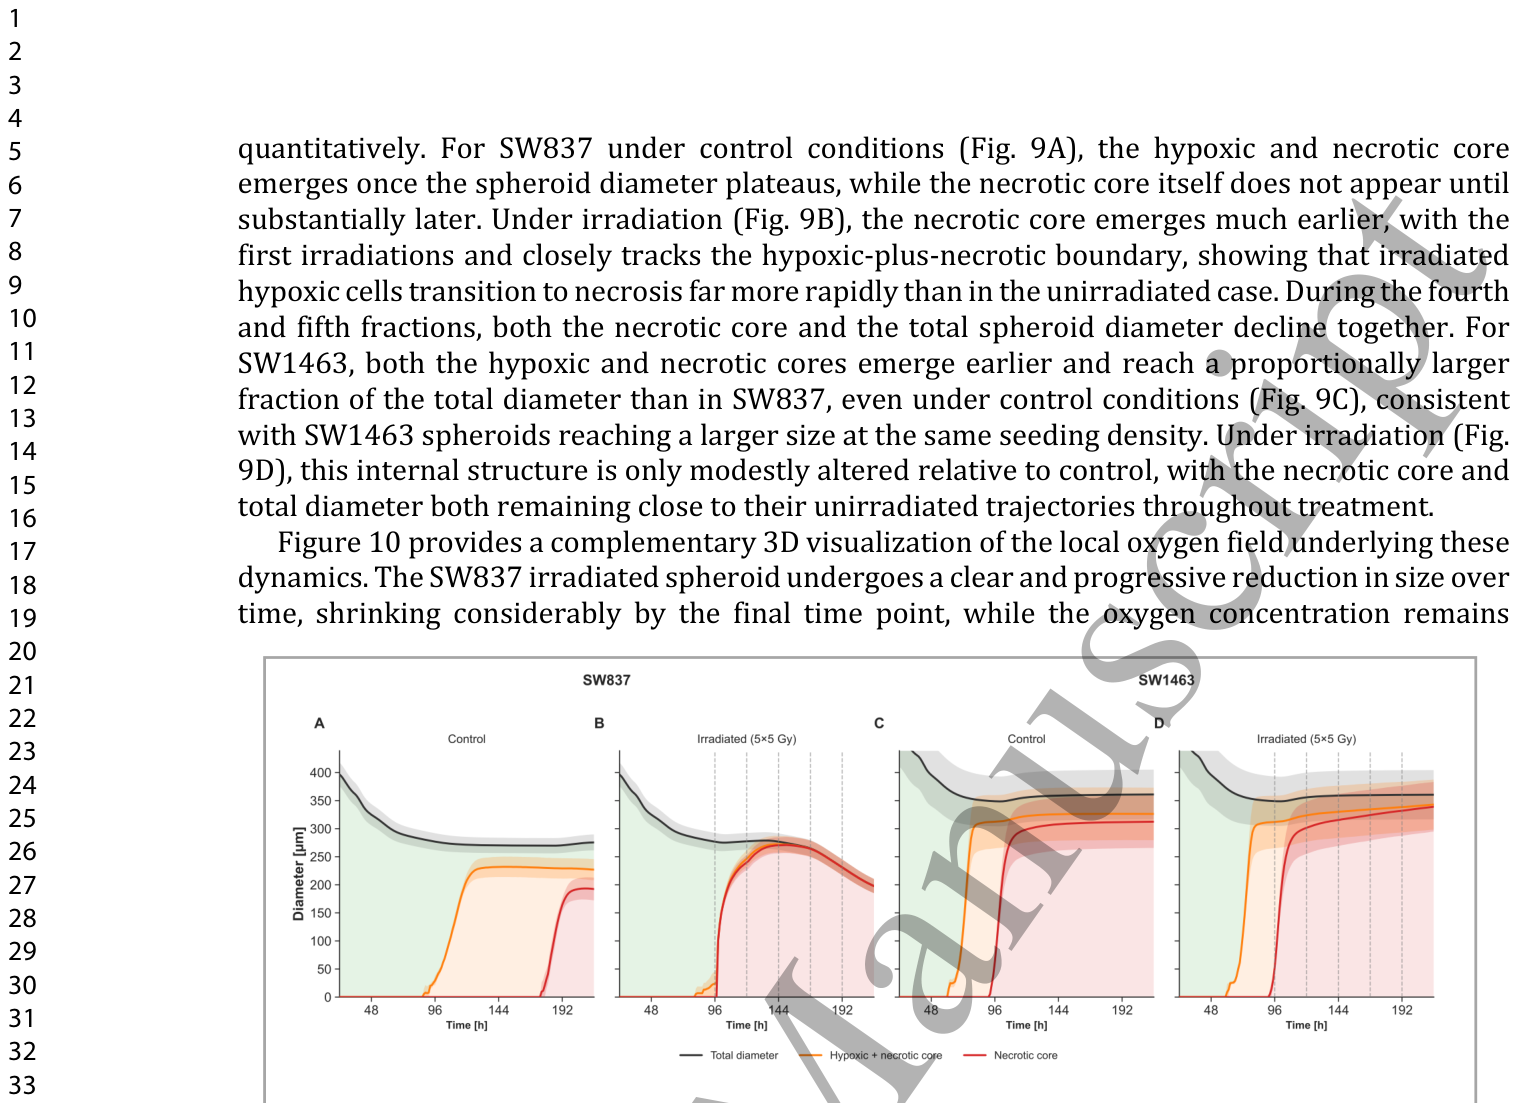
Figure 9. Figure 9. Simulated internal spheroid zonation over time for SW837 (A, B) and SW1463 (C, D), under control (A, C) and irradiated (B, D) conditions, for a representative seeding density of 5000 cells. Curves give the total spheroid diameter (black), the outer boundary of the hypoxic-plus- necrotic core, and the outer boundary of the necrotic core. The shaded bands between them give the radial extent of the proliferative (green), hypoxic (orange), and necrotic (red) zones. Vertical dashed lines in panels B and D mark the delivery of each of the five 5 Gy fractions.解説: 代表的な5000細胞播種密度におけるSW837(A, B)とSW1463(C, D)のコントロール条件(A, C)と照射条件(B, D)でのシミュレーションされた内部スフェロイド帯状構造の時間的変化を示しています。曲線は、総スフェロイド直径(黒)、低酸素+壊死コアの外部境界、および壊死コアの外部境界を示しています。それらの間の網掛けの領域は、増殖期(緑)、低酸素期(オレンジ)、壊死期(赤)ゾーンの半径方向の範囲を示しています。パネルBとDの垂直破線は、5回の5 Gy分割照射の各回が実施されたことを示しています。
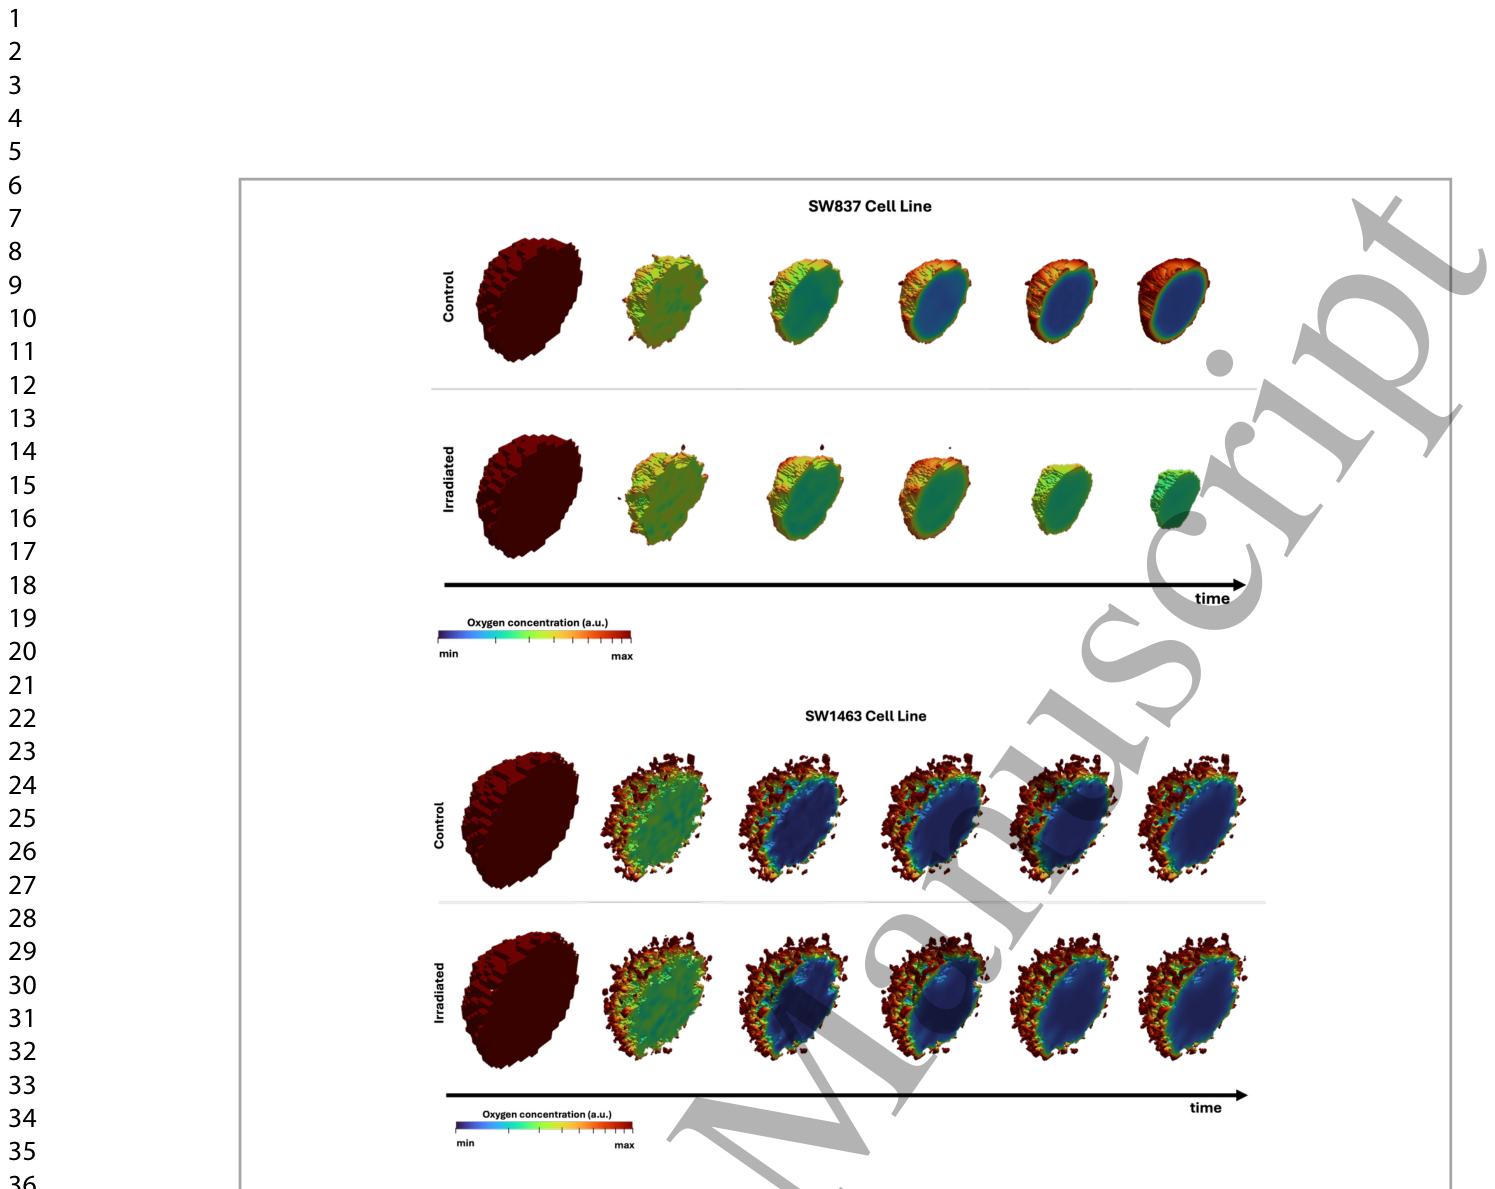
Figure 10. Figure 10. Temporal evolution of simulated spheroids with 5000 cells for the SW837 (top) and SW1463 (bottom) cell lines under control and irradiated conditions. The color scale represents oxygen concentration, ranging from minimum (blue) to maximum (red). Each panel shows six time points from 24 hours post-seeding to the final experimental time point (left to right). At the initial time point (leftmost panel), the spheroid is fully oxygenated; as it grows, a hypoxic core progressively develops in the interior, visible as the expanding blue region.解説: SW837(上)とSW1463(下)細胞株の5000細胞スフェロイドについて、コントロール条件と照射条件におけるシミュレーションされたスフェロイドの時間的進化を示しています。カラースケールは酸素濃度を表し、最小(青)から最大(赤)までです。各パネルは、播種後24時間から最終実験時点まで(左から右へ)の6つの時間点を示しています。初期時点(最も左のパネル)では、スフェロイドは完全に酸素化されていますが、成長するにつれて、低酸素コアが内部に徐々に発達し、青色の領域として見えています。
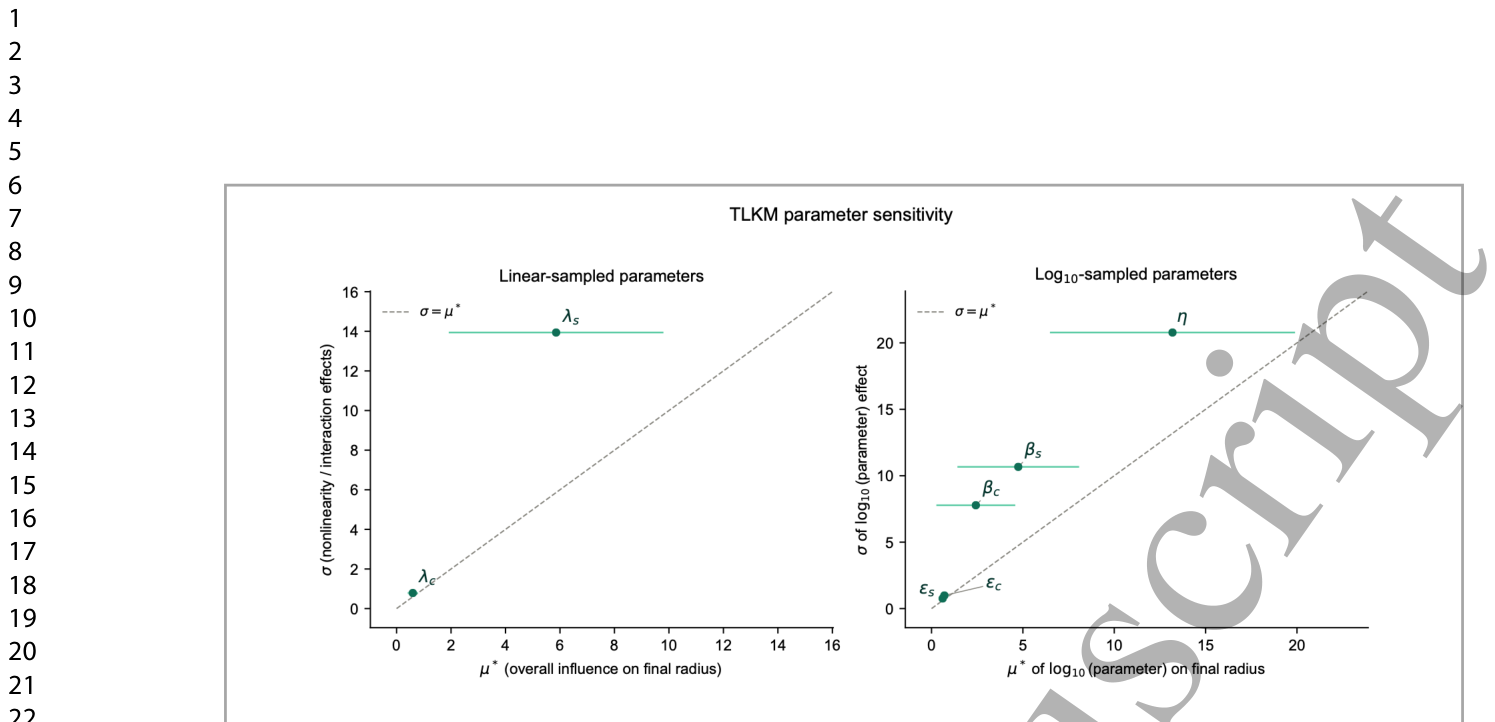
Figure 11. Figure 11. Morris sensitivity analysis of the TLKM irradiation-stage parameters with respect to the final irradiated spheroid radius. Panels separate parameters sampled on a linear scale on the left, from those sampled on a log₁₀ scale on the right. Each point shows a parameter's mean absolute elementary effect (μ*) against σ, the standard deviation of the elementary effects; horizontal error bars denote the confidence interval on μ*, and the dashed diagonal (σ = μ*) marks the boundary between an approximately linear, additive influence (below the line) and a strongly nonlinear or interacting one (at or above it).

コメントを残す