どうも、Beyond the Pixelです。卵巣にできる腫瘍は多岐にわたりますが、その中でも「卵巣線維腫(FT)」という良性の腫瘍は、時に悪性腫瘍と間違われることがあります。線維腫と莢膜細胞腫は、卵巣の性索間質腫瘍(性腺の間質に由来する腫瘍)で最も一般的なものです。これらの腫瘍は豊富な線維成分を持つため、多くの場合はMRI(磁気共鳴画像診断)のT1強調画像やT2強調画像で低信号を示すのが特徴です。しかし、腫瘍が大きくなったり、浮腫や変性変化が起こるとT2強調画像で高信号を示すことがあり、また、腫瘍を構成する莢膜細胞の数によってもT2強調画像の信号強度が上昇することがあります。
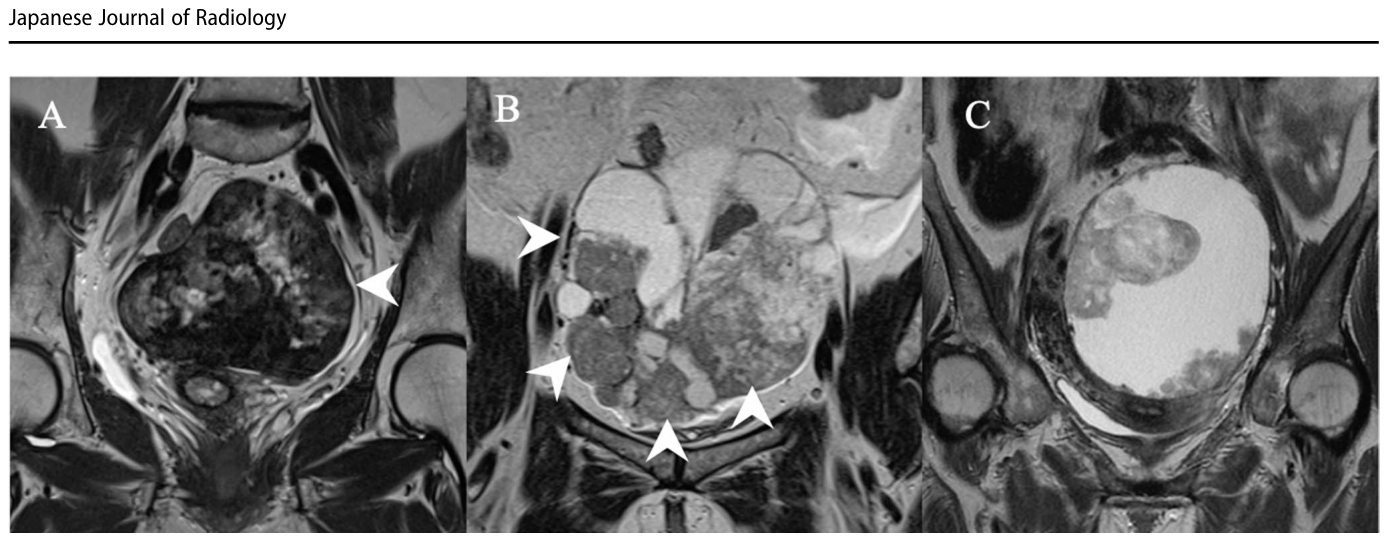
Figure 2. Fig. 2 Definition of ovarian solid tumor. A A 76-year-old patient with an ovarian fibroma. The mass (arrowhead) is 100% solid, and most of the lesion shows low signal intensity on T2-weighted imaging (T2WI), comparable to that of muscle. It was classified as Class 1. B A 54-year- old patient with clear cell carcinoma. The mass consists of both cystic and solid components (arrowhead). The solid component was judged解説: 卵巣固形腫瘍の定義を示す画像。Aは卵巣線維腫で、腫瘤が100%固形であり、T2強調画像で筋肉と同程度の低信号強度を示す例。Bは明細胞癌で、嚢胞成分と固形成分が混在するが、固形成分が腫瘍体積の50%以上を占めるため分析に含まれた例。Cは固形成分が病変の50%未満と判断され、分析から除外された明細胞癌の例。
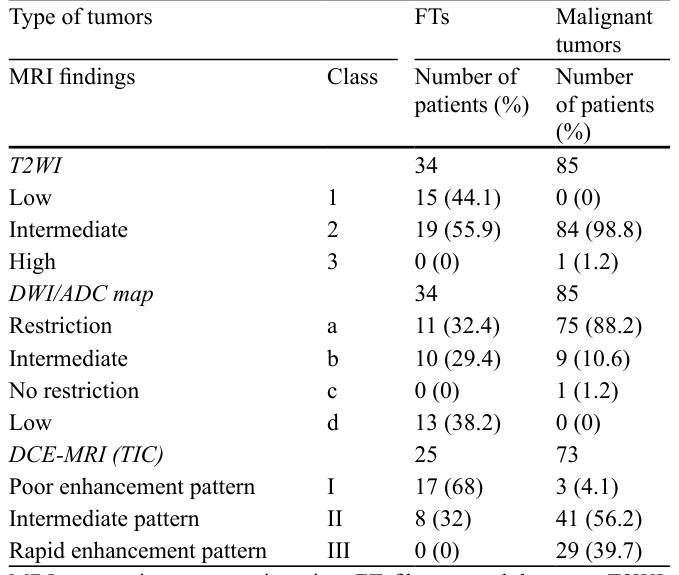
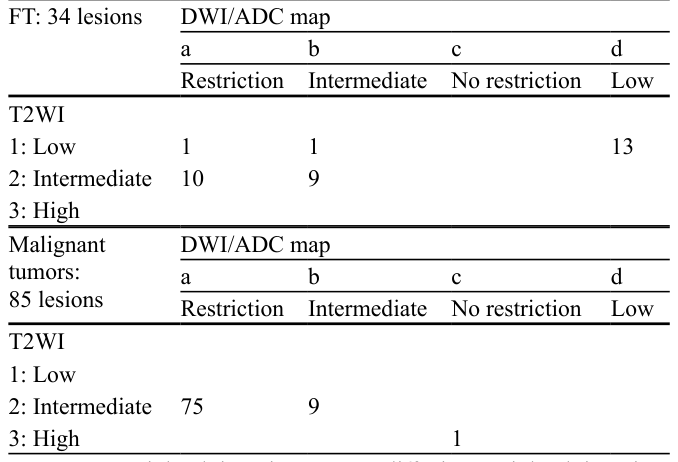
Table 2. Table 2 MRI findings of all tumors Type of tumors FTs Malignant tumors MRI findings Class Number of patients (%)解説: 卵巣線維腫(FT)と悪性腫瘍におけるMRI所見の数と割合を示す表。T2強調画像では、FTの55.9%が中間信号強度を示し、悪性腫瘍の98.8%が中間信号強度を示した。拡散強調画像(DWI/ADCマップ)では、FTの32.4%が拡散制限を示し、悪性腫瘍の88.2%が拡散制限を示した。DCE-MRI(TIC)では、FTの68%がPoor enhancement patternを示し、悪性腫瘍の56.2%がIntermediate patternを示した。
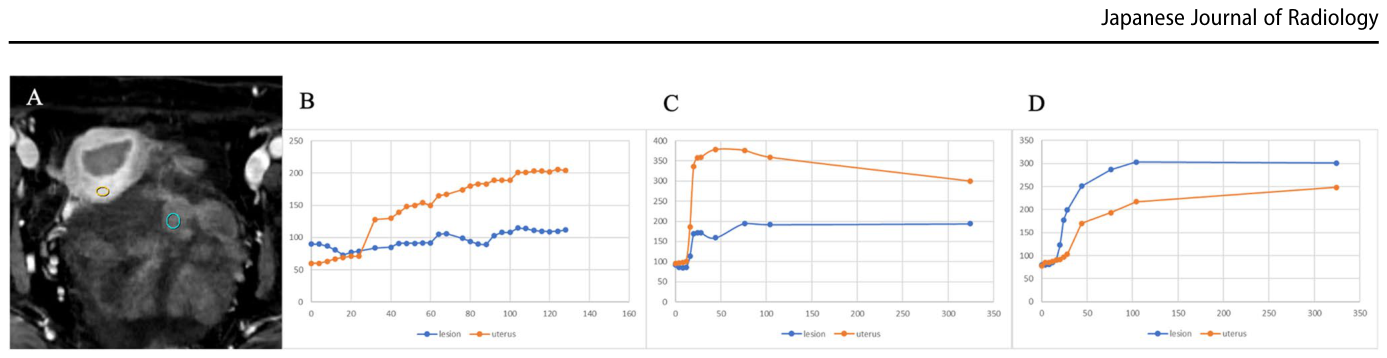
Figure 4. Fig. 4 Classification based on the time–intensity curve obtained from dynamic contrast enhanced magnetic resonance imaging. A As shown in the figure, regions of interest (ROI) were placed in the myometrium and the tumor to generate time–intensity curves. The ROIs were set at the area showing the greatest enhancement within 30 s after con trast administration. B The blue curve representing the lesion shows an almost flat pattern and is located below the orange curve repre senting the myometrial enhancement. Therefore, it was classified as解説: 動的造影MRIから得られた時間-信号強度曲線に基づく分類を示す図。Aは時間-信号強度曲線を生成するために筋肉と腫瘍に設定された関心領域(ROI)。Bは病変の曲線がほぼ平坦で子宮筋の曲線より下にあるClass I(poor enhancement pattern)。Cは病変の曲線が早期に上昇するが子宮筋の曲線より低いClass II(intermediate pattern)。Dは病変の曲線が早期に上昇し子宮筋の曲線より高いClass III(rapid enhancement pattern)。
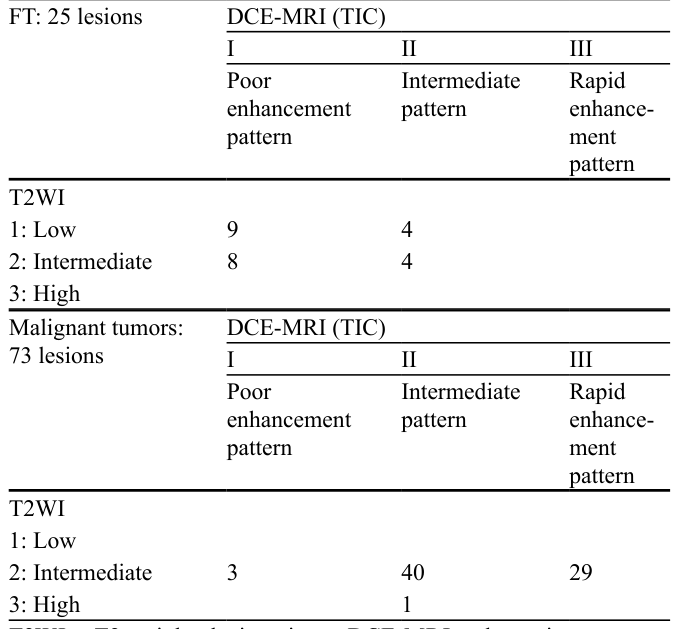
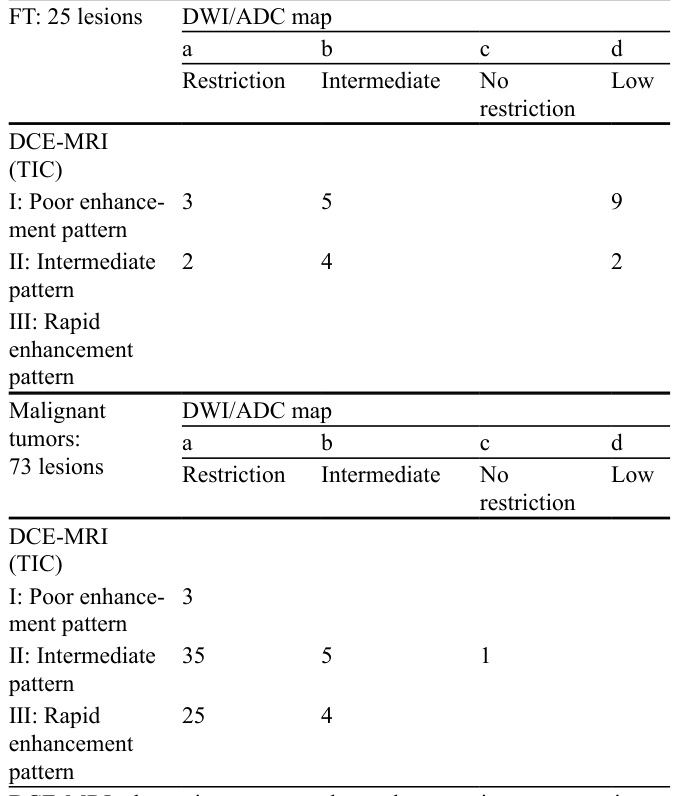
Table 5. Table 5 Imaging classification of DCE-MRI and DWI/ADC map FT: 25 lesions DWI/ADC map a b c d Restriction Intermediate No restriction解説: DCE-MRI(TIC)とDWI/ADCマップの組み合わせによる画像分類を示す表。卵巣線維腫(FT)では、DCE-MRIがPoor enhancement patternでDWI/ADCマップがLow信号の病変が9例。悪性腫瘍では、DCE-MRIがIntermediate patternでDWI/ADCマップが制限を示す病変が35例と多数を占める。
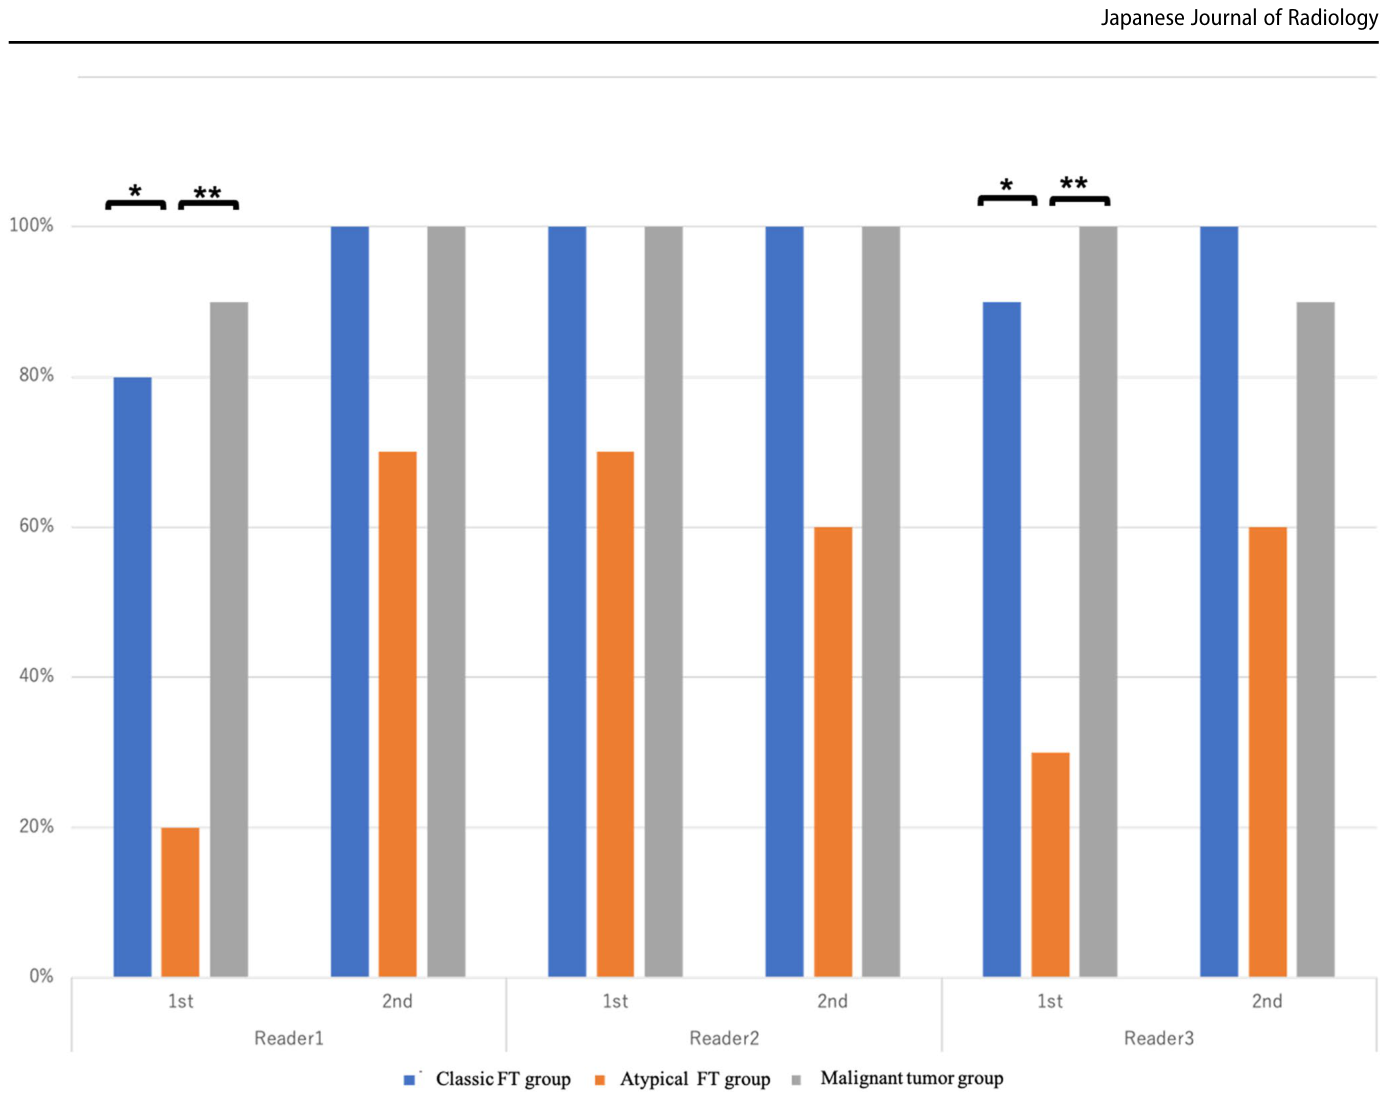
Figure 5. Fig. 5 Graph showing the results of the reader study performed by three readers. All three readers demonstrated a lower diagnostic accu racy in the atypical FT group. In the first reading experience, Reader 1 showed statistically significant differences in diagnostic accuracy between the typical FT and atypical FT groups, as well as between the atypical FT and malignant tumor groups (p = 0.023 and p = 0.0055, respectively). However, in the second reading experience, overall per formance improved, and no statistically significant differences were observed between the groups. Similarly, in the first reading experience,解説: 3名の専門家による読影実験の結果を示すグラフ。すべての読影者が非典型的な卵巣線維腫群で診断精度が低いことを示している。1回目の読影では、Reader 1とReader 3が古典的な卵巣線維腫群と非典型的な卵巣線維腫群の間、および非典型的な卵巣線維腫群と悪性腫瘍群の間で統計的に有意な診断精度の差を示した。2回目の読影では、全体的な性能が改善し、非典型的な卵巣線維腫群の診断精度が向上した。
コメントを残す