どうも、Beyond the Pixelです。がん治療において、陽子線治療はその高い精度で注目されています。しかし、その恩恵を最大限に引き出すためには、治療中の対象者の体の動きや位置の変化をリアルタイムで把握し、計画に反映させる「画像誘導」が不可欠です。これまではX線ベースの画像診断が主流でしたが、軟部組織のコントラストが低いことや、追加のX線被ばくがあるという課題がありました。そこで登場したのが、優れた軟部組織コントラストと非電離放射線という利点を持つ「磁気共鳴イメージング(MRI)」を陽子線治療装置に統合する「MR統合陽子線治療(MRiPT)」という画期的なコンセプトです。
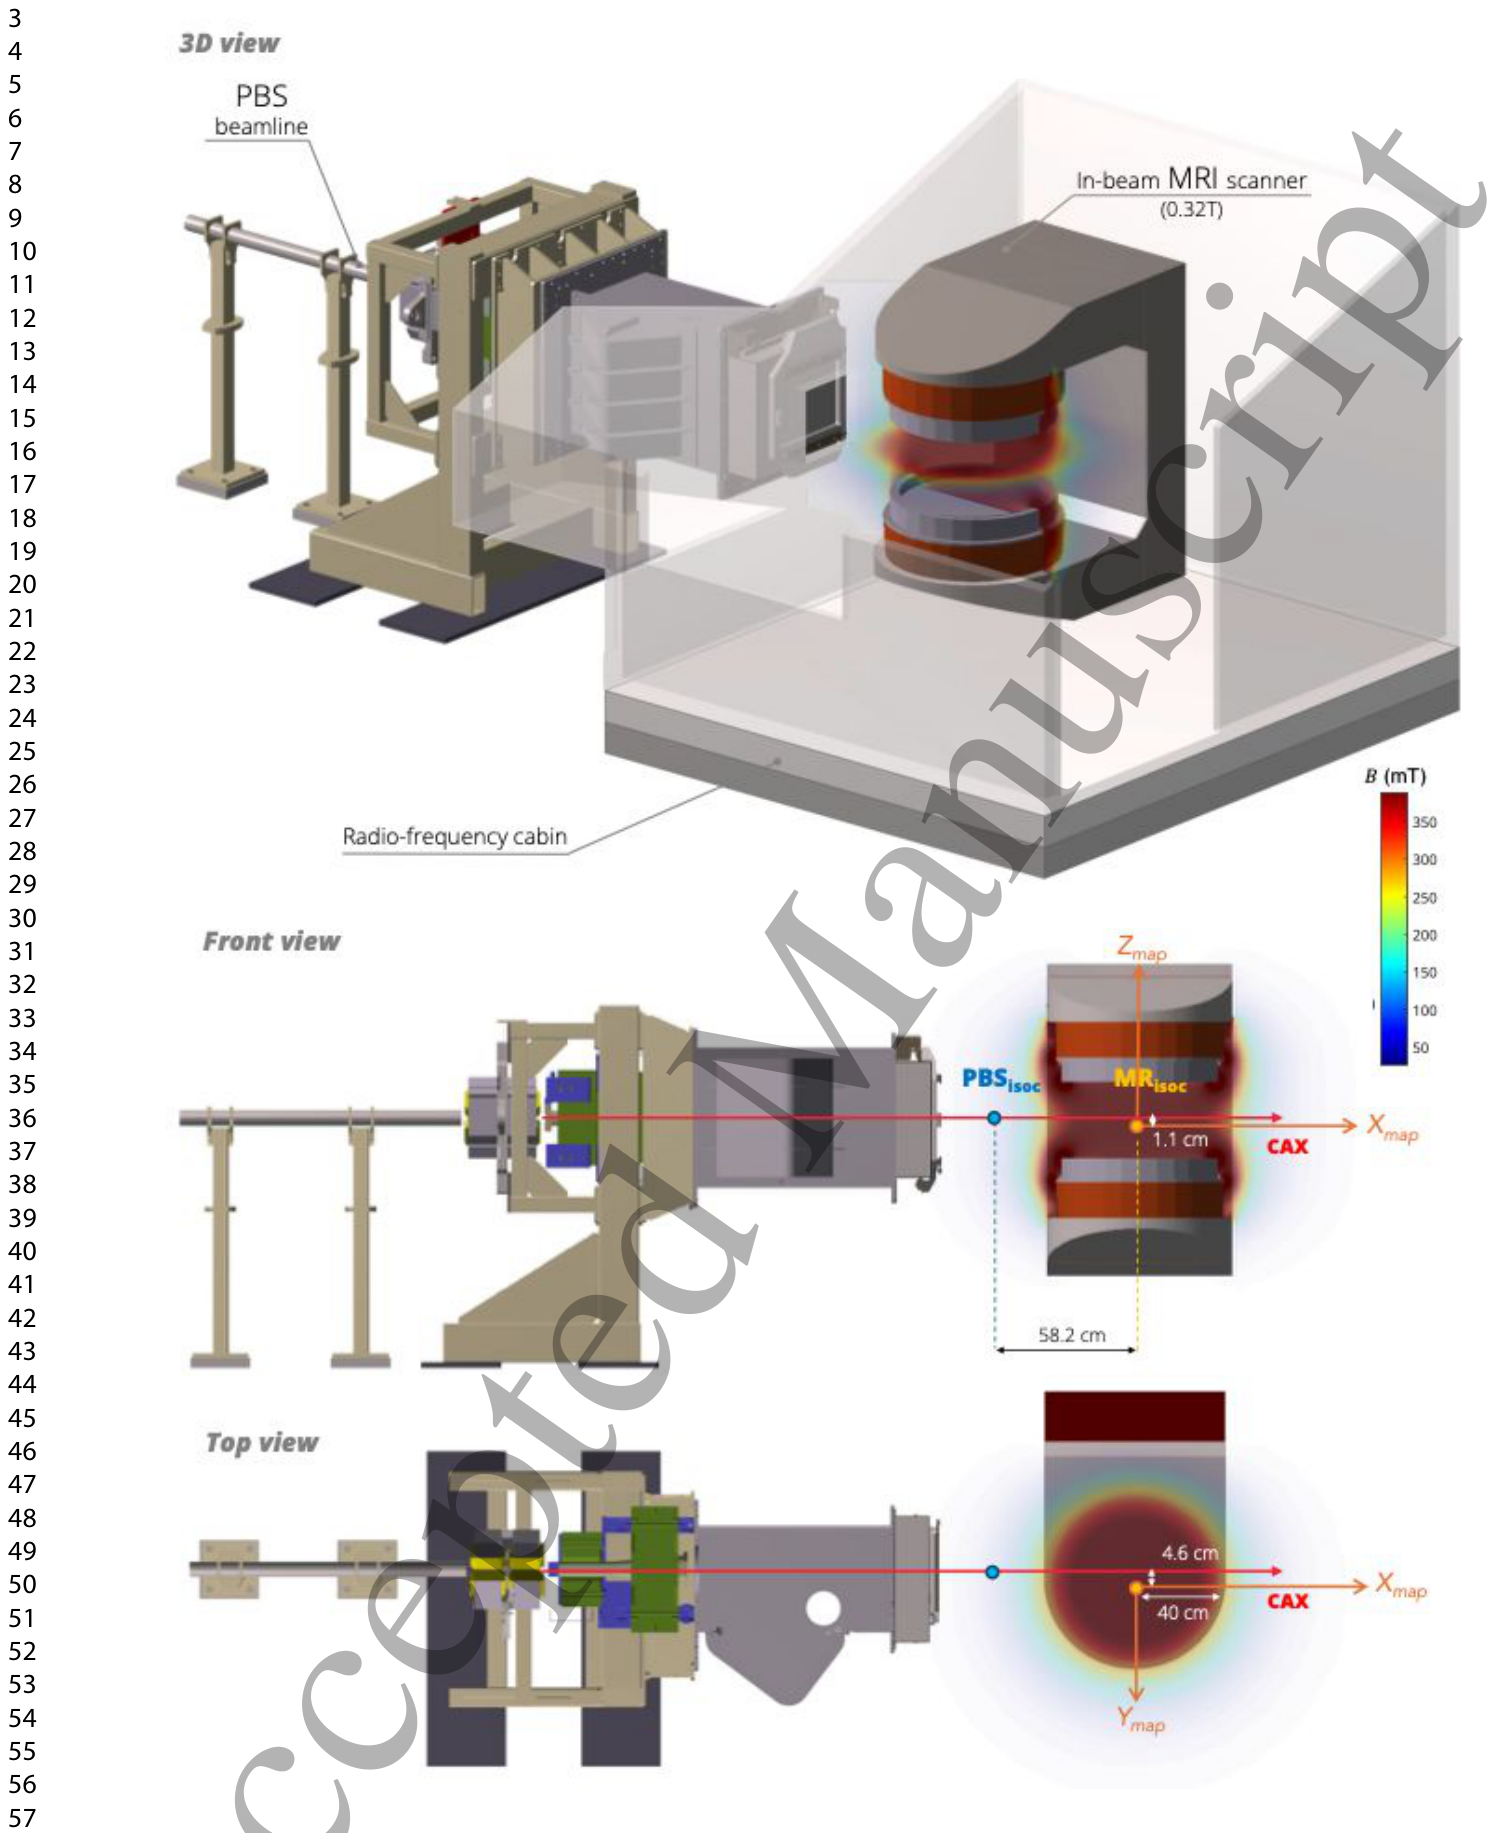
Figure 1. Figure 1. Schematic of the beamline and the MRiPT prototype system. 3D view (top) and orthogonal解説: MRiPTプロトタイプシステムの全体像と陽子線ビームライン、MRアイソセンター(MRisoc)およびビームアイソセンター(PBSisoc)の位置関係を示しています。3Dビュー(上)、前面図(中)、上面図(下)で構成され、静磁場(B0)の向きも示されています。
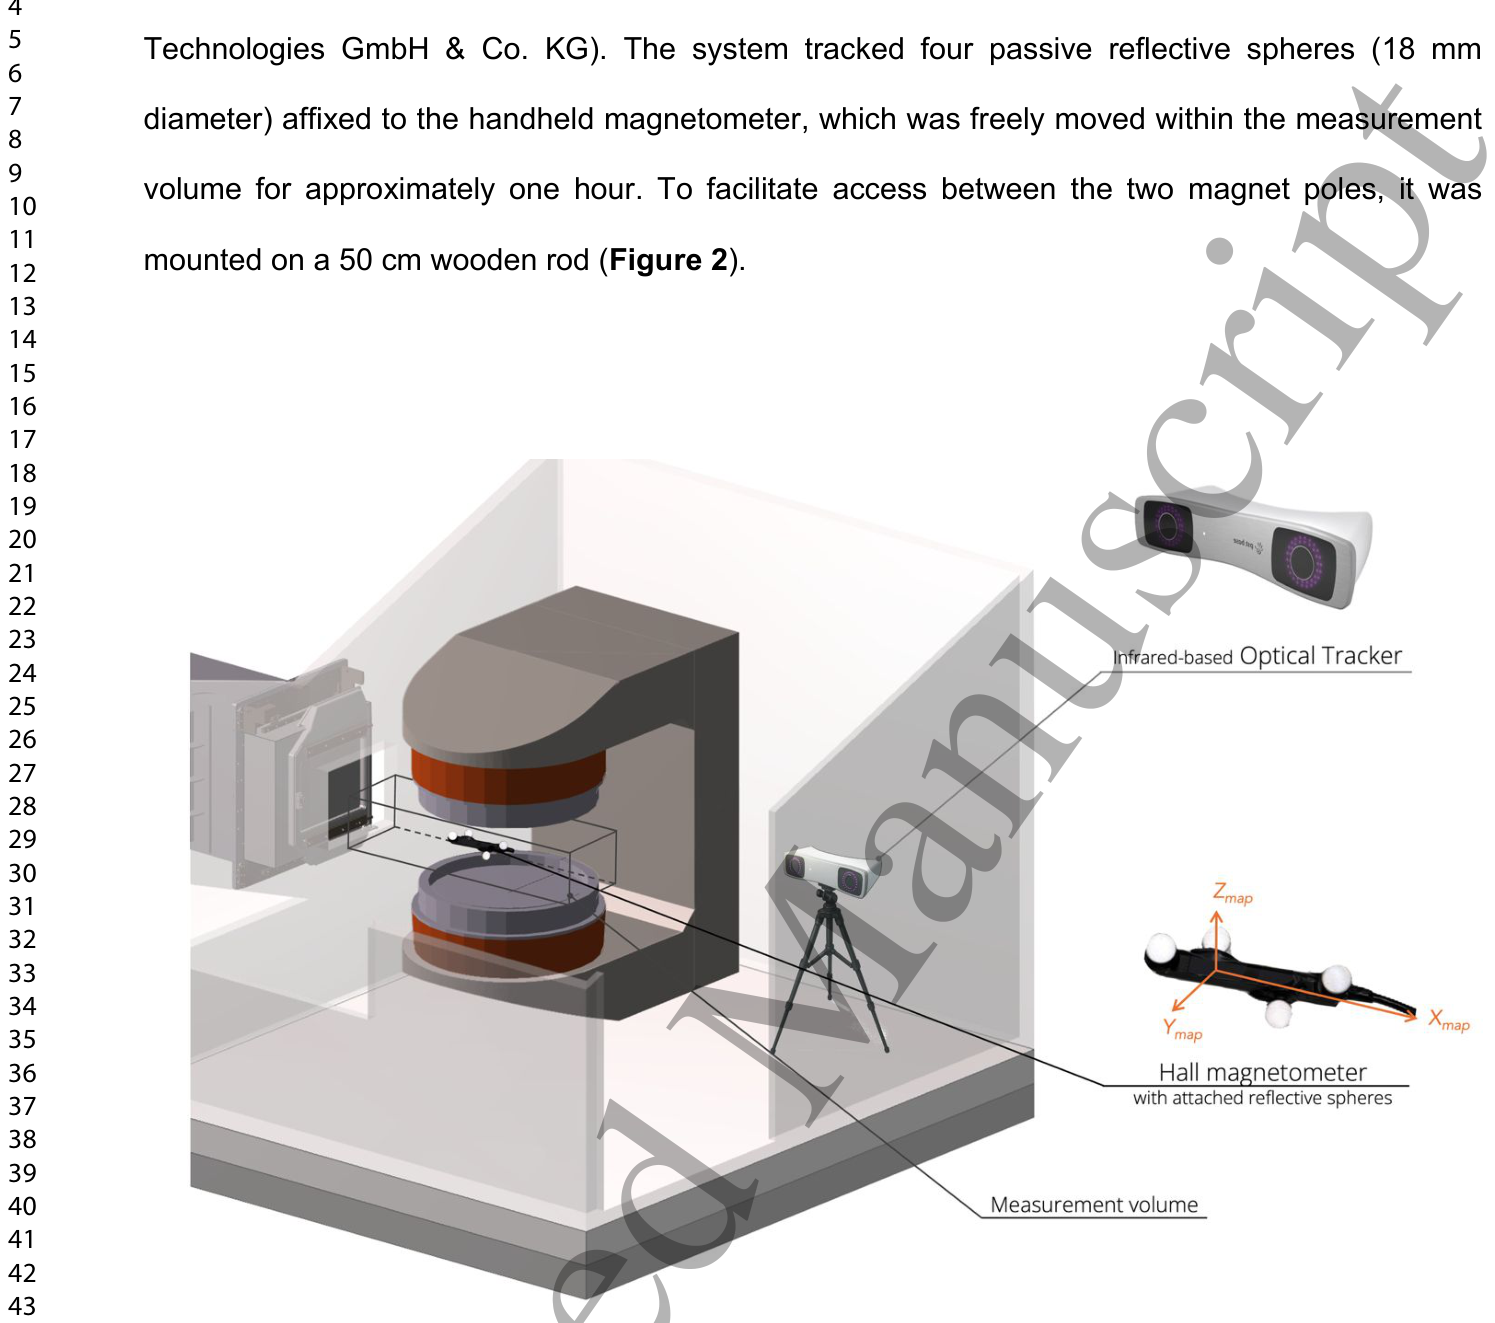
Figure 2. Figure 2. Schematic of the 3D MF mapping setup within the in-beam MRiPT system. An optical解説: インビームMRiPTシステム内での3D磁場マッピング設定の模式図です。光学トラッキングシステムとホール磁力計が使用され、測定ボリュームが示されています。これは、陽子線PBSノズルのビーム出口窓からMRスキャナーの遠位端まで広がる範囲です。
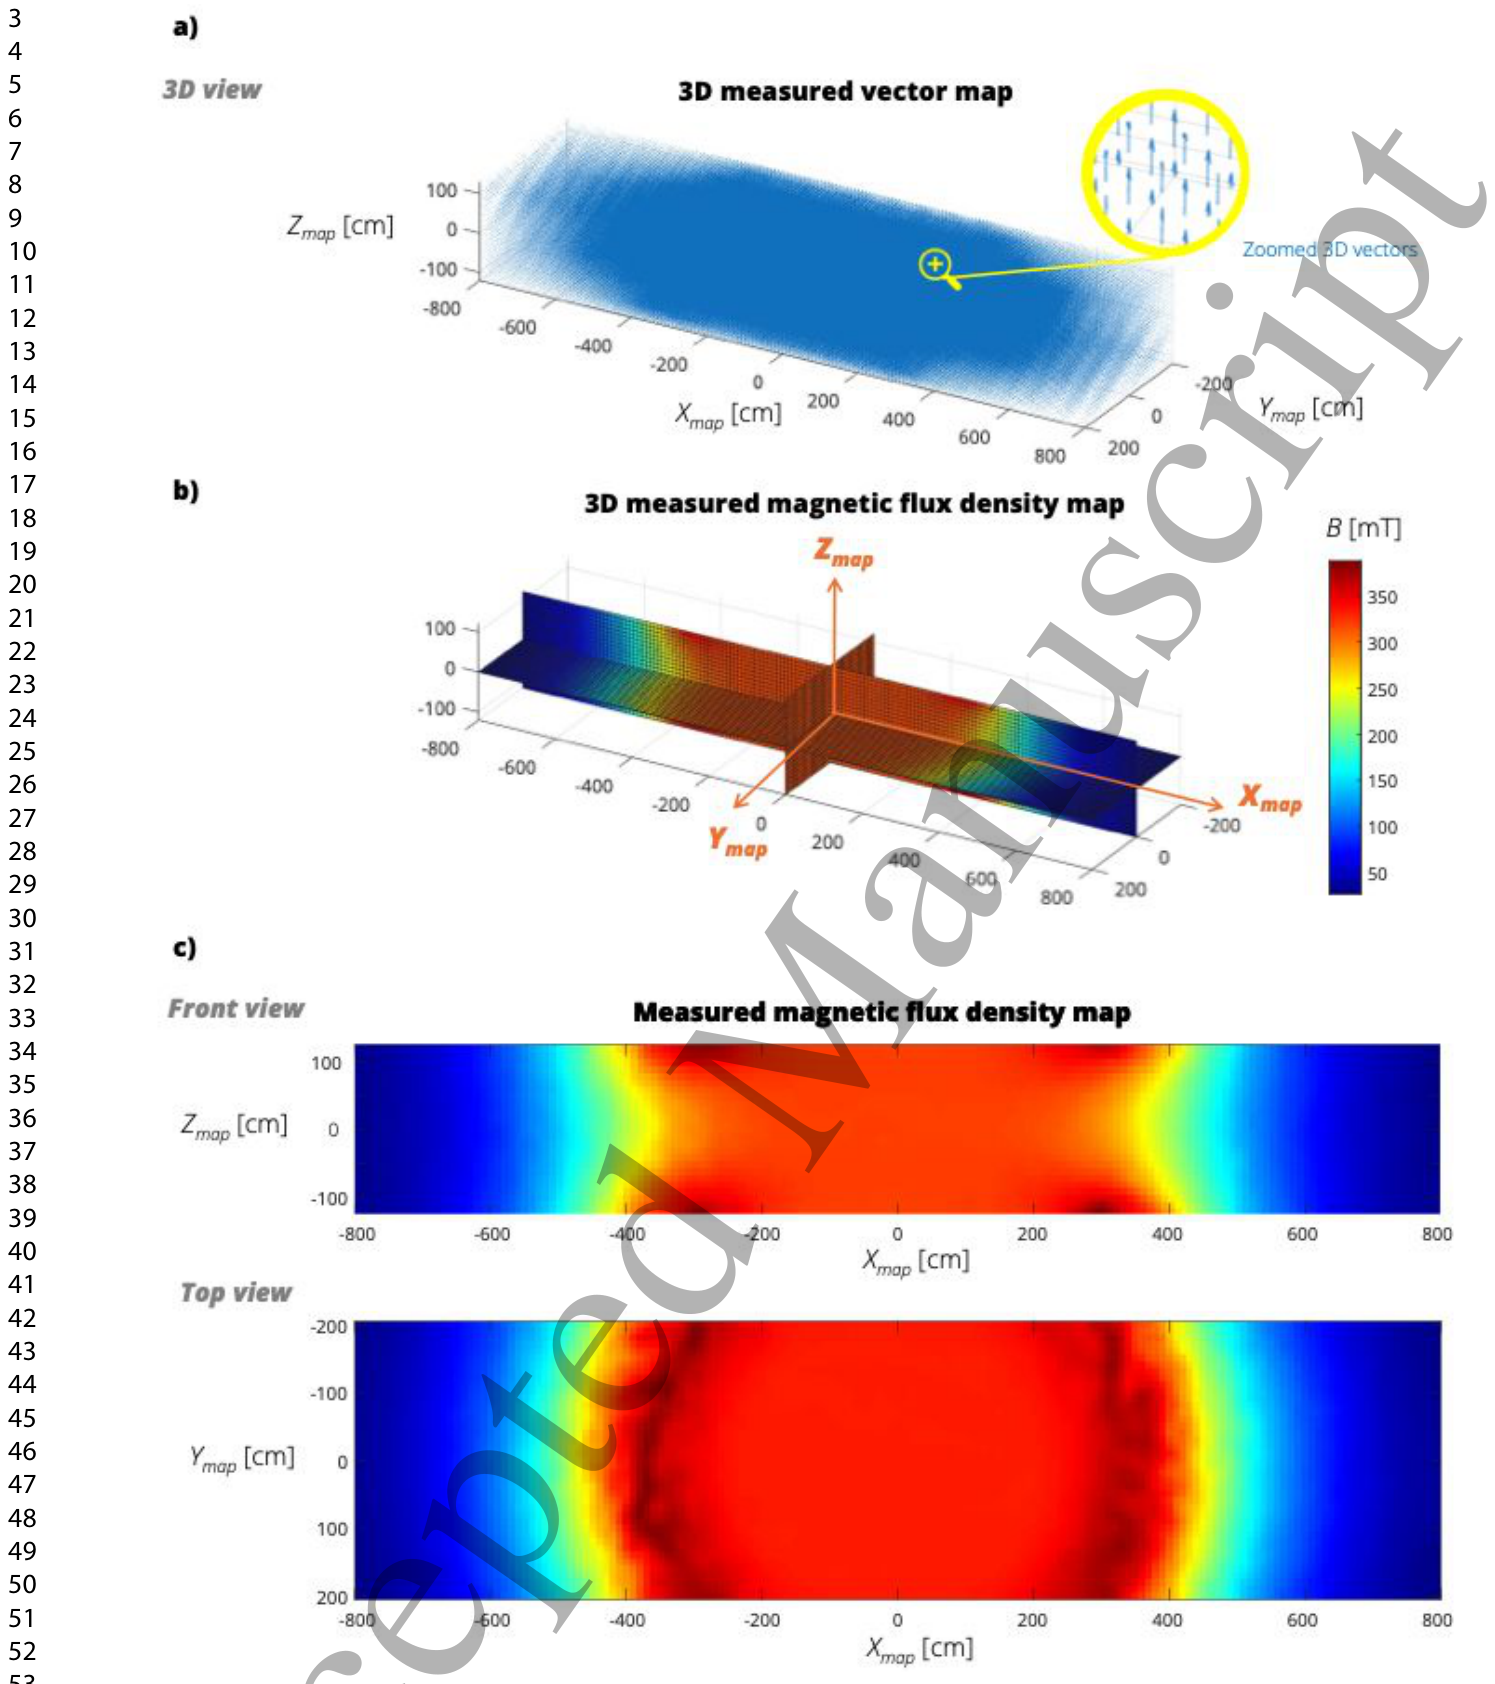
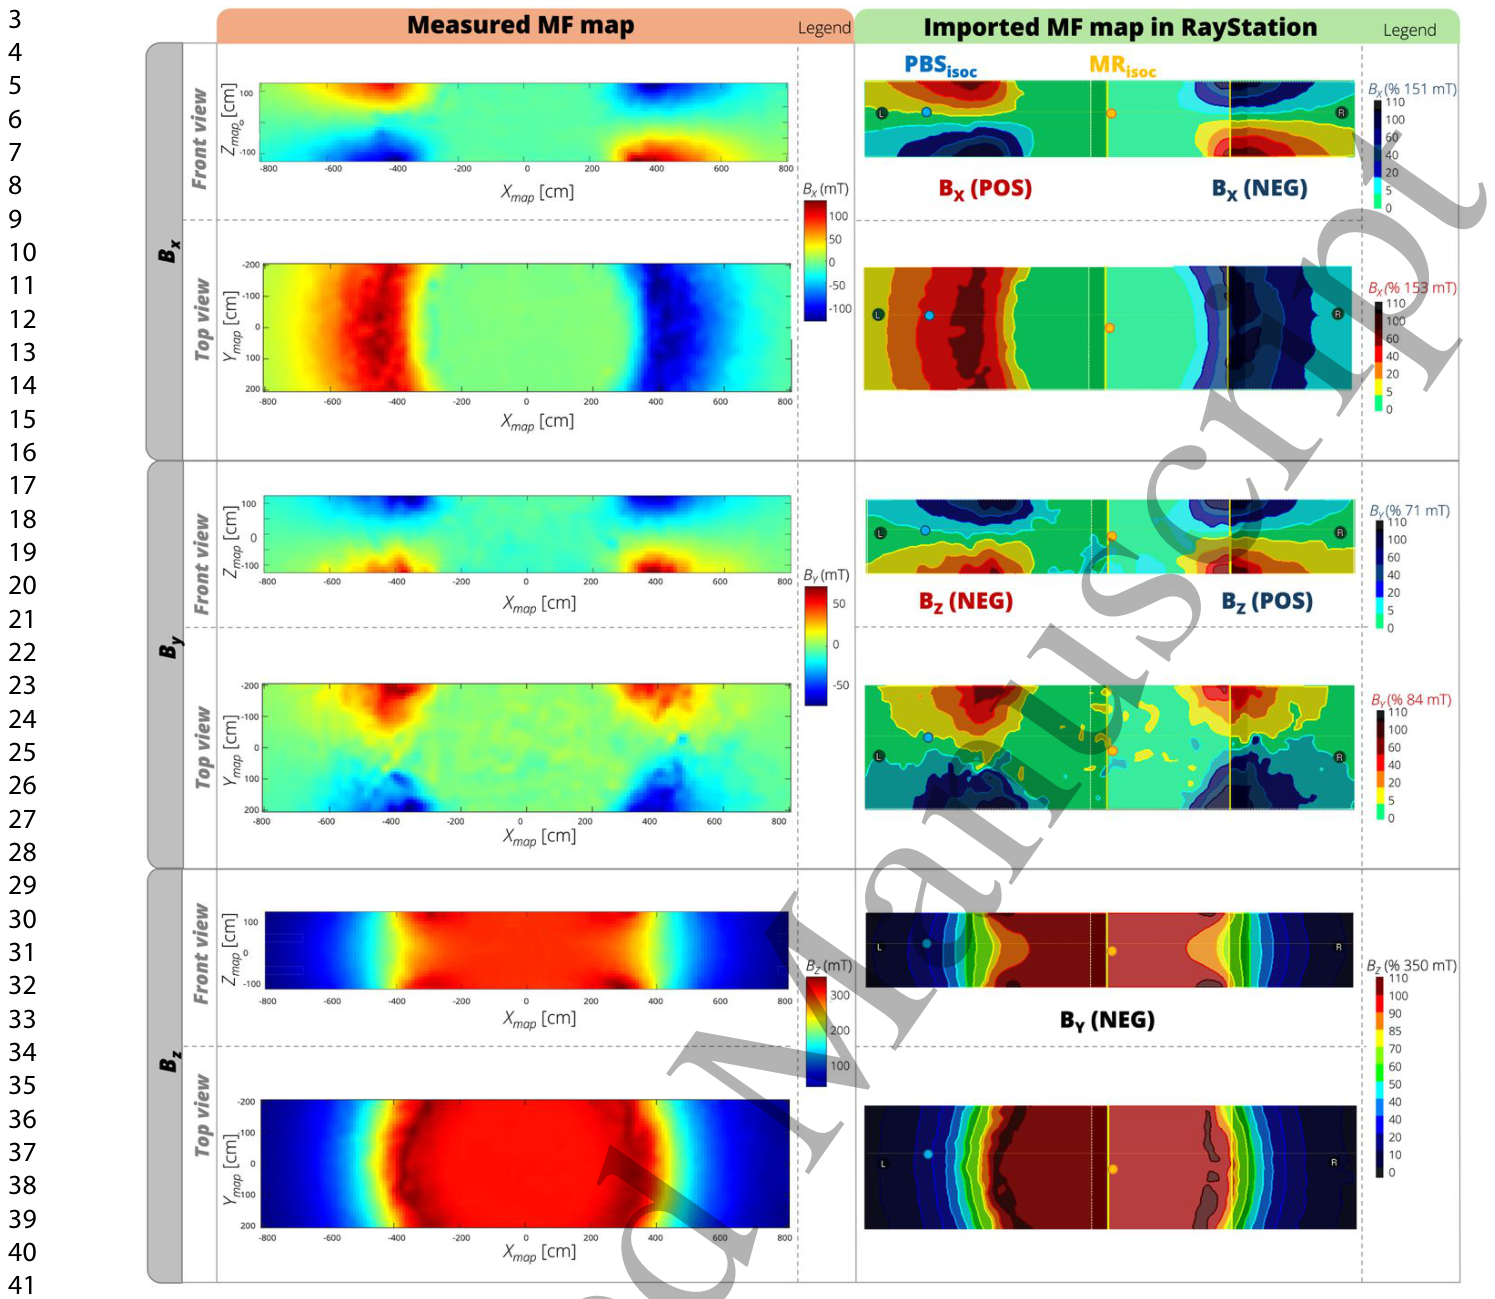
Figure 4. Figure 4. High-resolution 3D magnetic flux density map of the in-beam MR scanner. (a) Measured 3D magnetic vector field distribution with zoomed detail showing vector orientation. (b) 3D representation of the magnitude of the measured magnetic flux density map (|B0|) with coordinate axes indicated. (c) Representative central front and top view slices of the magnetic flux density magnitude, demonstrating homogeneous field distribution in the imaging volume and strong gradients toward the fringe fields. The colour scale is identical to that shown in (b).解説: インビームMRスキャナーの高解像度3D磁束密度マップを示しています。(a) 測定された3D磁気ベクトル場分布で、ベクトルの向きを拡大表示しています。(b) 測定された磁束密度マップの大きさを3Dで表現し、座標軸を示しています。(c) 磁束密度の大きさの代表的な中央前面および上面スライスで、画像化ボリューム内の均一な磁場分布と、フリンジフィールドに向かう強い勾配を示しています。Figure 5. Figure 5. Comparison between measured and implemented 3D MF map components in RayStation. Front and top views of the three components (BX, BY, BZ) are shown. The implemented maps are named according to the DICOM convention of RayStation and reproduce the correct orientation relative to the treatment plan geometry.解説: RayStationに実装された3D磁場マップの各コンポーネントと測定された磁場マップとの比較を示しています。BX、BY、BZの3つのコンポーネントについて、前面図と上面図が示されており、実装されたマップがRayStationのDICOM規約に従って正しい向きと大きさで再現されていることが確認できます。
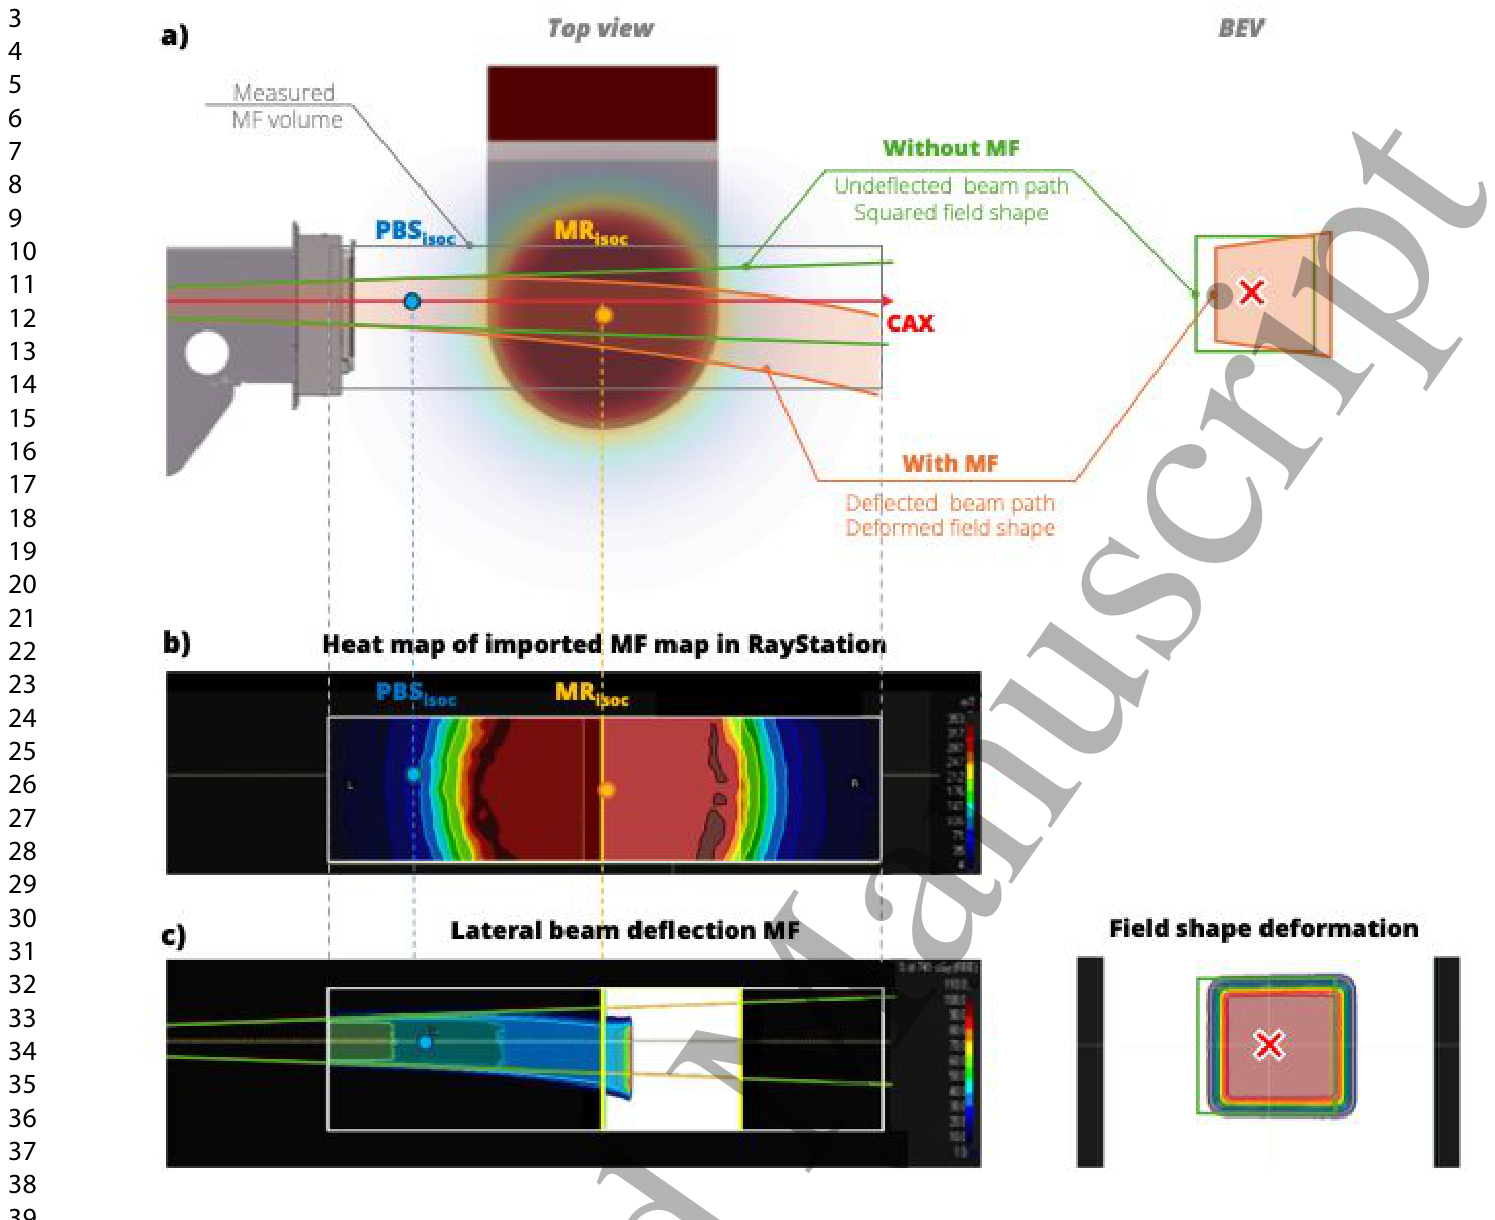
Figure 6. Figure 6. Illustration of the effect of the MF map of the in-beam MR scanner on proton dose distribution. (a) Schematic top view of the MRiPT system with the mapped MF volume indicated. Green lines represent the expected beam divergence in the absence of the MF, while orange lines illustrate the deflected beam path in the presence of the MF (left). The trapezoidal deformation of the radiation field at the maximum dose depth is shown in beam’s eye view (BEV) (right). (b) 2D top- view heat map of the MF, visualised in RayStation and expressed in mT. The offset between PBSisoc and MRisoc is verified by visualising the central point of the implemented map. (c) Top view of calculated beam trajectory in RayStation for a 100 MeV square radiation field (shown in green for the case without MF), deflected by the transverse MF (left). Corresponding 2D dose distribution in BEV at the Bragg peak depth in a water phantom (right), demonstrating the trapezoidal deformation induced by the MF.解説: インビームMRスキャナーの磁場マップが陽子線線量分布に与える影響を示しています。(a) MRiPTシステムの上面模式図で、磁場がない場合の予想されるビーム発散(緑線)と、磁場が存在する場合の偏向したビーム経路(オレンジ線)を示しています。(b) RayStationで可視化された磁場マップの2D上面ヒートマップです。(c) 100MeVの正方形放射線野に対するRayStationでの計算されたビーム軌道(磁場がない場合は緑色で表示)と、ブラッグピーク深さでの2D線量分布が示され、磁場による台形変形が確認できます。
Table 1. Table 1. Measured lateral displacement of the central proton dose spots from experiments in-air at four positions (A–D) relative to the PBS isocentre (PBSisoc), for beam energies of 100, 150, and 220 MeV.解説: 空気中での実験で測定された、PBSisocからの4つの位置(A-D)における中心陽子線スポットの横方向変位を、100、150、220 MeVのビームエネルギー別に示しています。
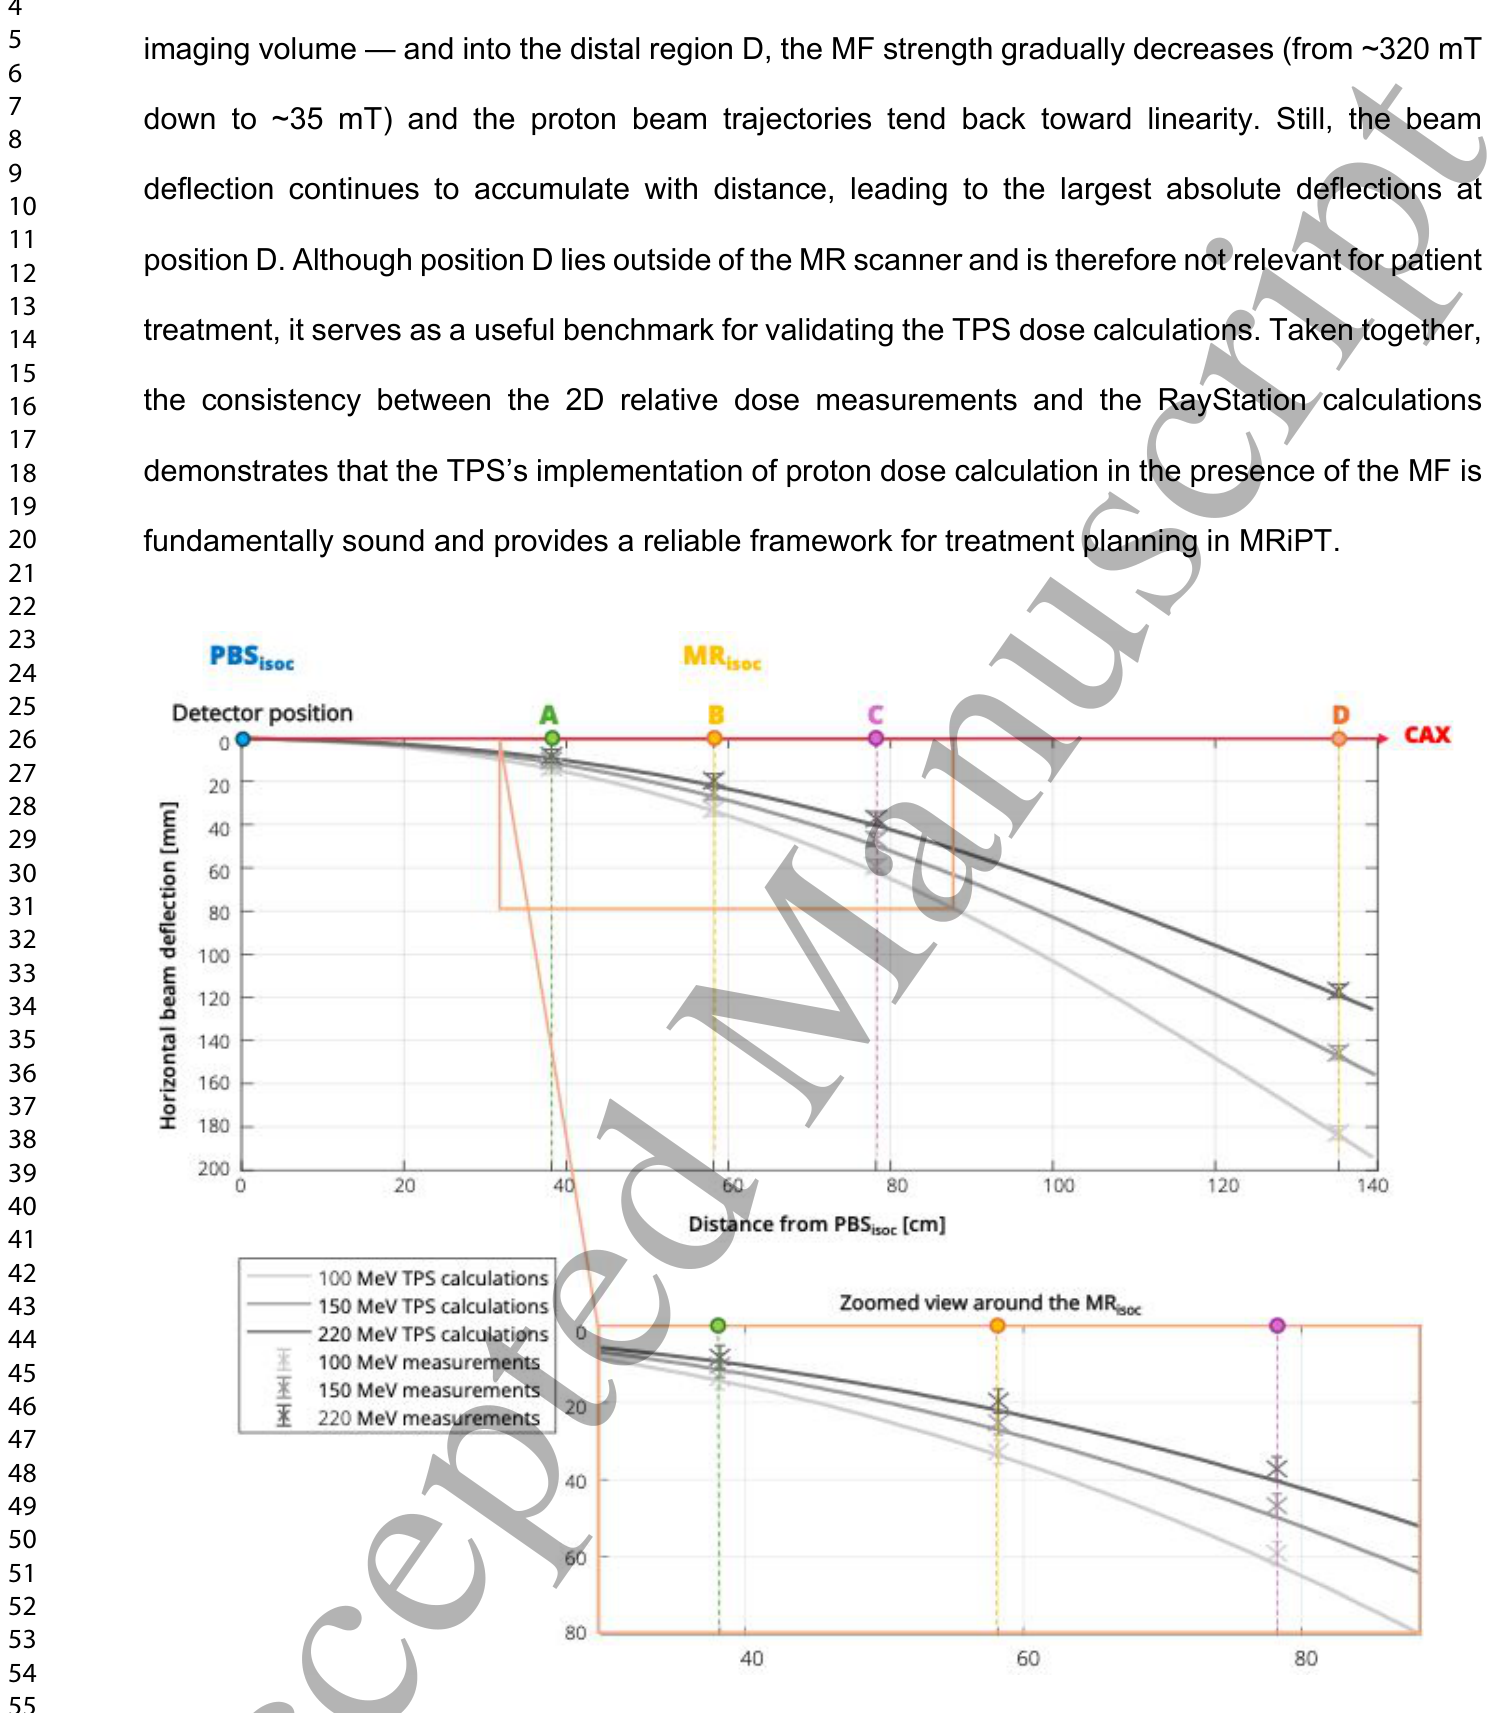
Figure 7. Figure 7. Comparison of in-air measured and calculated horizontal beam deflections. Data points with error bars (±3 mm) represent OCTAVIUS 1500XDR measurements and positioning uncertainties, while solid lines show beam trajectories calculated by RayStation for proton energies of 100, 150, and 220 MeV. The upper panel depicts the full measurement range (positions A–D). The lower panel provides a magnified view around the MR isocentre (position B) to assess measurement-to- calculations agreement at this critical site, where the patient would be located in an MRiPT treatment解説: 空気中での測定された水平方向のビーム偏向と計算されたビーム偏向の比較を示しています。データ点とエラーバー(±3mm)はOCTAVIUS 1500XDRの測定値と位置決め不確かさを表し、実線は100、150、220MeVの陽子線エネルギーに対するRayStationによる計算ビーム軌道を示しています。
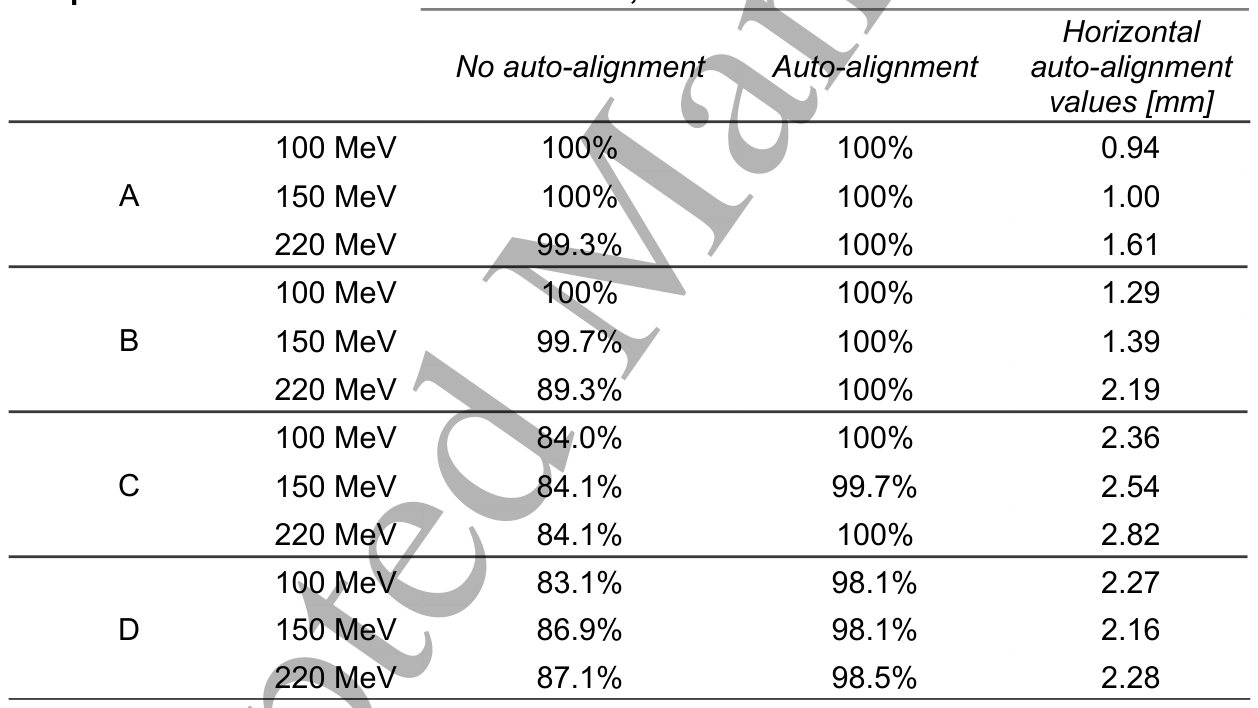
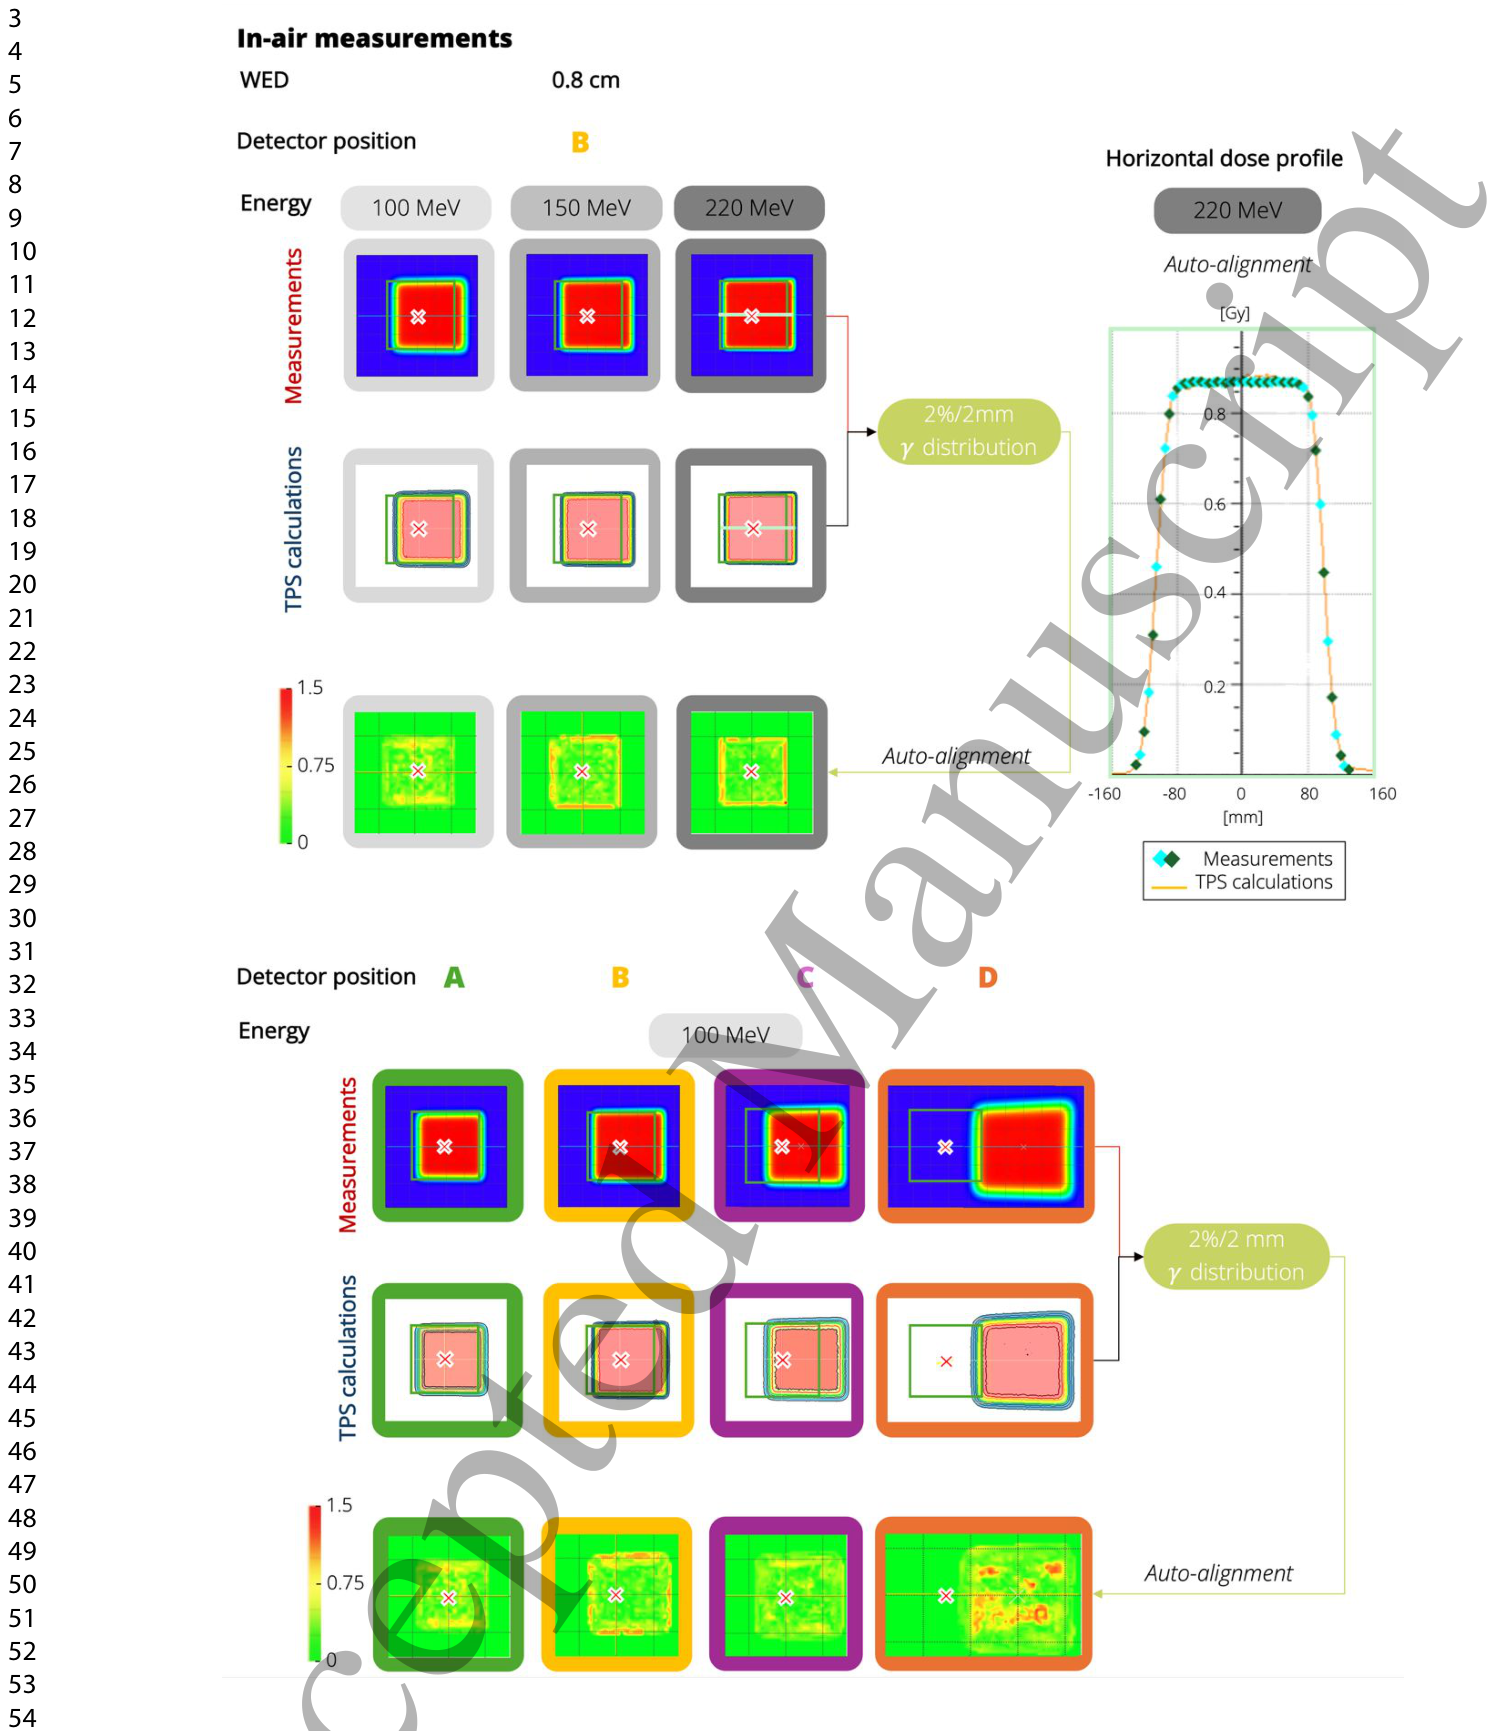
Table 2. Table 2. 𝛾-pass rates (2%/2 mm, 5% dose threshold) for measured and calculated 2D dose distributions at all the detector positions (A–D) and proton beam energies of 100, 150, and 220 MeV, reported with and without auto-alignment. Auto-alignment values (in mm) are listed to indicate the magnitude of corrections applied to centre the measured and calculated dose distributions.解説: 検出器の全位置(A-D)と100、150、220 MeVの陽子線ビームエネルギーにおける、測定および計算された2D線量分布のガンマパス率(2%/2mm、5%線量閾値)を示しています。オートアライメントの有無で報告されており、オートアライメントの値(mm)も記載されています。Figure 8. Figure 8. Top: 2 %/2 mm 𝛾-distributions illustrating the agreement between in-air measured and calculated 2D dose distributions in the presence of the MF at position B for proton energies of 100, 150, and 220 MeV, shown both with auto-alignment (left). Central horizontal dose profile for 220 MeV, allowing direct comparison of measurements and calculations with auto-alignment (right). Coloured rhomboid markers indicate the measured dose values at individual detector channels, with red and blue denoting the left and right penumbra points, respectively, light blue marking central‐region detector readings, and green representing intermediate off-axis points along the field解説: 空気中での測定と計算された2D線量分布の2%/2mmガンマ分布を示しています。上段は位置Bでの100、150、220MeVの陽子線エネルギーに対する結果で、オートアライメントあり(左)と220MeVの中央水平線量プロファイル(右)が含まれます。下段は100MeVの最低エネルギーでの位置A~Dすべての測定位置に対するガンマ分布を示しています。
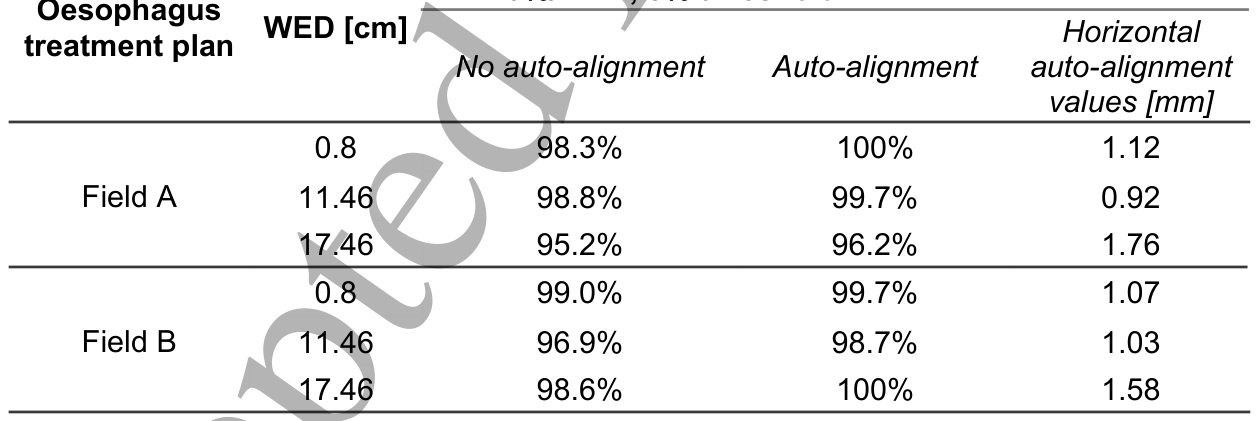
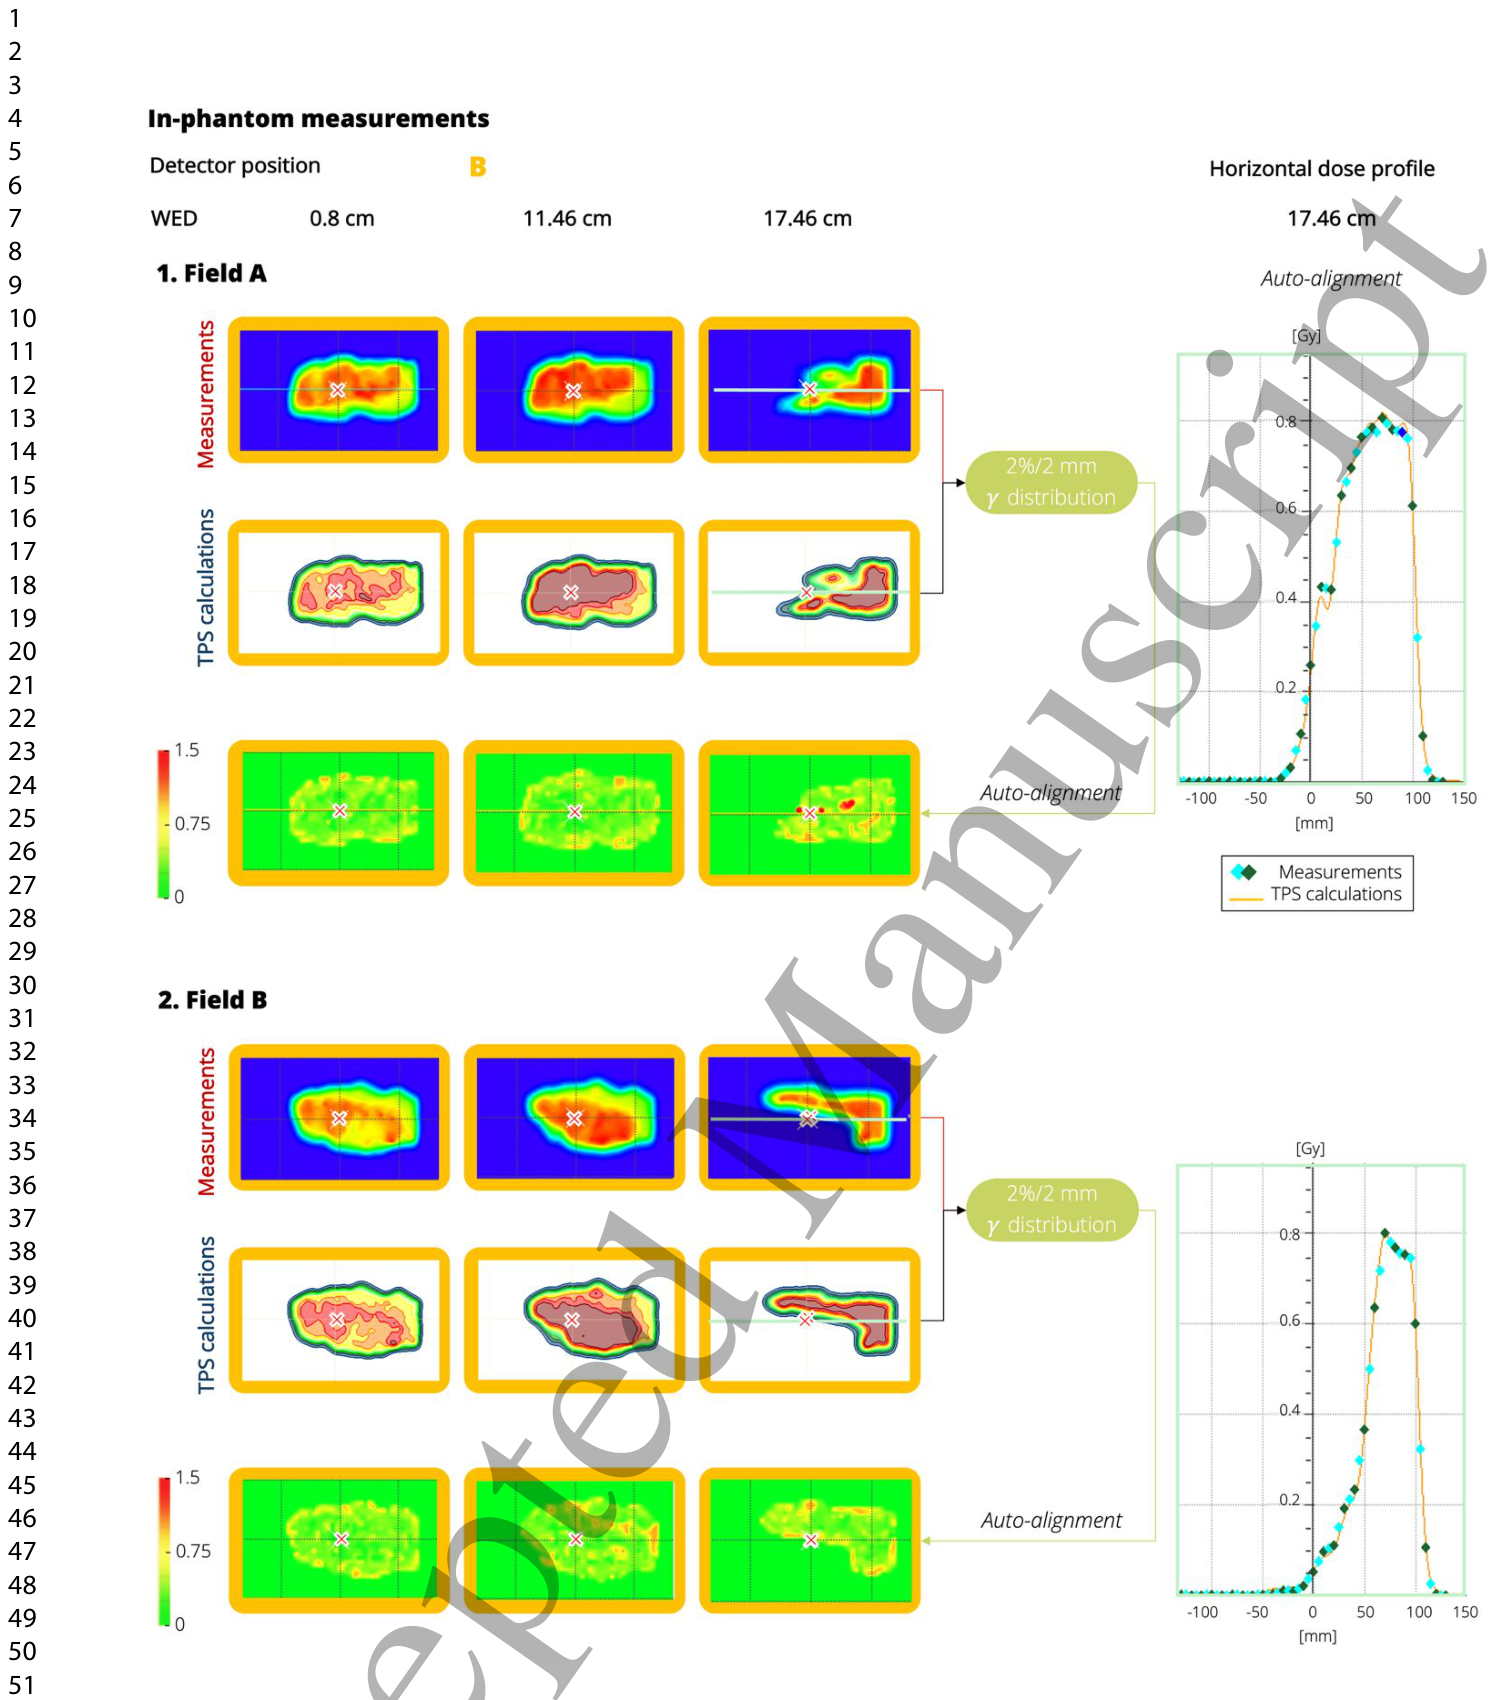
Table 3. Table 3. 𝛾-pass rates (2%/2 mm, 5% dose threshold) for measured and calculated 2D dose distributions at all water equivalent depths (WED) for both fields of the oesophagus treatment plan, reported with and without auto-alignment. Auto-alignment values (in mm) are listed to indicate the magnitude of corrections applied to centre the measured and calculated dose distributions.解説: 食道治療計画の両フィールドにおける、すべての水等価深度(WED)での測定および計算された2D線量分布のガンマパス率(2%/2mm、5%線量閾値)を示しています。オートアライメントの有無で報告されており、オートアライメントの値(mm)も記載されています。Figure 9. Figure 9. Right: 2 %/2 mm 𝛾-distributions illustrating the agreement between in-phantom measured and calculated 2D dose distributions in the presence of the MF of both the oesophagus radiation treatment fields (Top: Field A, Bottom: Field B) Left: Central horizontal dose profile for the 17.46 water-equivalent depth (WED), allowing direct comparison of measurements and calculations with auto-alignment.解説: ファントム内測定における、食道放射線治療分野(上:Field A、下:Field B)の磁場存在下での測定および計算された2D線量分布の一致を示す2%/2mmガンマ分布と、17.46cm水等価深度(WED)での中央水平線量プロファイルを示しています。


コメントを残す