どうも、Beyond the Pixelです。冠動脈分岐部病変は、インターベンションを専門とする専門家にとって最も困難な病変の一つとして知られています。2004年に設立された欧州分岐部クラブ(EBC)は、これらの病変に対する適切な管理戦略を評価し、推奨することを目標とする学術団体です。EBCは2009年にアンギオグラフィー小委員会に対し、分岐部病変の評価における定量冠動脈アンギオグラフィー(QCA)の適切な使用に関するコンセンサスを作成する任務を与えました。
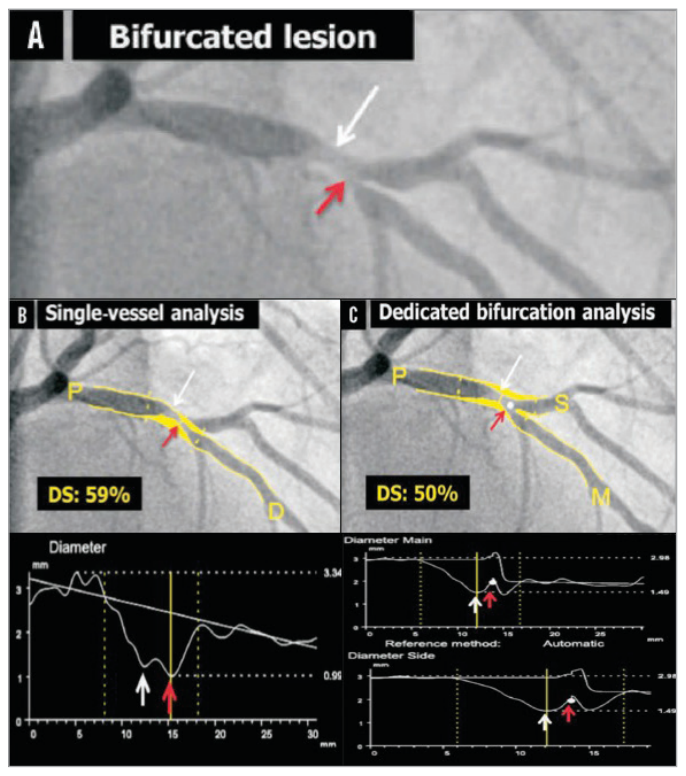
Figure 1. Figure 1. Quantitative coronary angiography of a bifurcation lesion using single-vessel or bifurcation dedicated software. A) A bifurcation lesion involving the left anterior descending artery and the first diagonal branch. B) Quantitative coronary angiography (QCA) analysis of the bifurcation lesion using single-vessel software creating a “pseudo-stenosis” depicted with a red arrow. C) QCA analysis of the same bifurcation lesion using dedicated bifurcation software. In all panels, the white arrow indicates the true location of the MLD of the proximal main branch, the red arrow the pseudo- stenosis found with single-vessel QCA at the actual location of the point of bifurcation (white dot in C). MLD: minimum lumen diameter Reprinted from Grundeken et al20.解説: 分岐部病変の定量的冠動脈アンギオグラフィー(QCA)を、単一血管ソフトウェアと専用分岐部ソフトウェアで比較しています。単一血管ソフトウェアでは、誤った最小管腔直径(MLD)の位置に「擬似狭窄」が作成される可能性がありますが、専用分岐部ソフトウェアではより正確な分析が可能です。
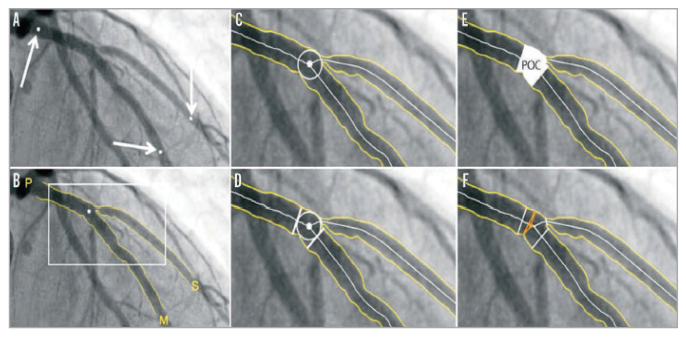
現在利用可能な2D専用分岐部QCAソフトウェアには、CAAS分岐部ソフトウェア(Pie Medical Imaging社製)とQAngio XA分岐部ソフトウェア(Medis medical imaging systems社製)、そしてCardiOp-B System(Paieon Medical Ltd.社製)があります。CAAS分岐部ソフトウェアでは、分析セグメントは近位の1点と遠位の2点の区切り点によって示され、輪郭が自動で検出された後、3つの輪郭すべてに接する最大の円の中央点が「分岐点」(POB)として定義されます。合流多角形(POC)の内側と外側では、異なる数学的アルゴリズム(「最小自由度」アプローチなど)を用いて直径値が取得されます(
Figure 2. Figure 2. CAAS 2D bifurcation software (Pie Medical Imaging). In the CAAS QCA bifurcation software, the segment of analysis is indicated by one proximal and two distal delimiter points (white arrows, A). After automatic detection of the contours (B), the “point of bifurcation” (POB) is defined as the mid-point of the largest possible circle touching all three contours (C). The intersections of the circle with the centrelines (D) indicate the boundaries of the POC (E). The diameter values are obtained differently inside the POC from those in straight segments outside the POC (F). Outside the POC, diameters are determined by the shortest distance between the vessel’s outer borders, as in the conventional straight-vessel QCA algorithm. Within the POC, however, another mathematical algorithm, the so-called “minimum freedom” approach, is used. Reprinted from Grundeken et al20.解説: CAAS 2D分岐部ソフトウェアの解析方法を示しています。このソフトウェアでは、分析セグメントの定義、血管輪郭の自動検出、分岐点(POB)と合流多角形(POC)の特定が行われ、POC内外で異なる数学的アルゴリズムを用いて直径が決定されます。
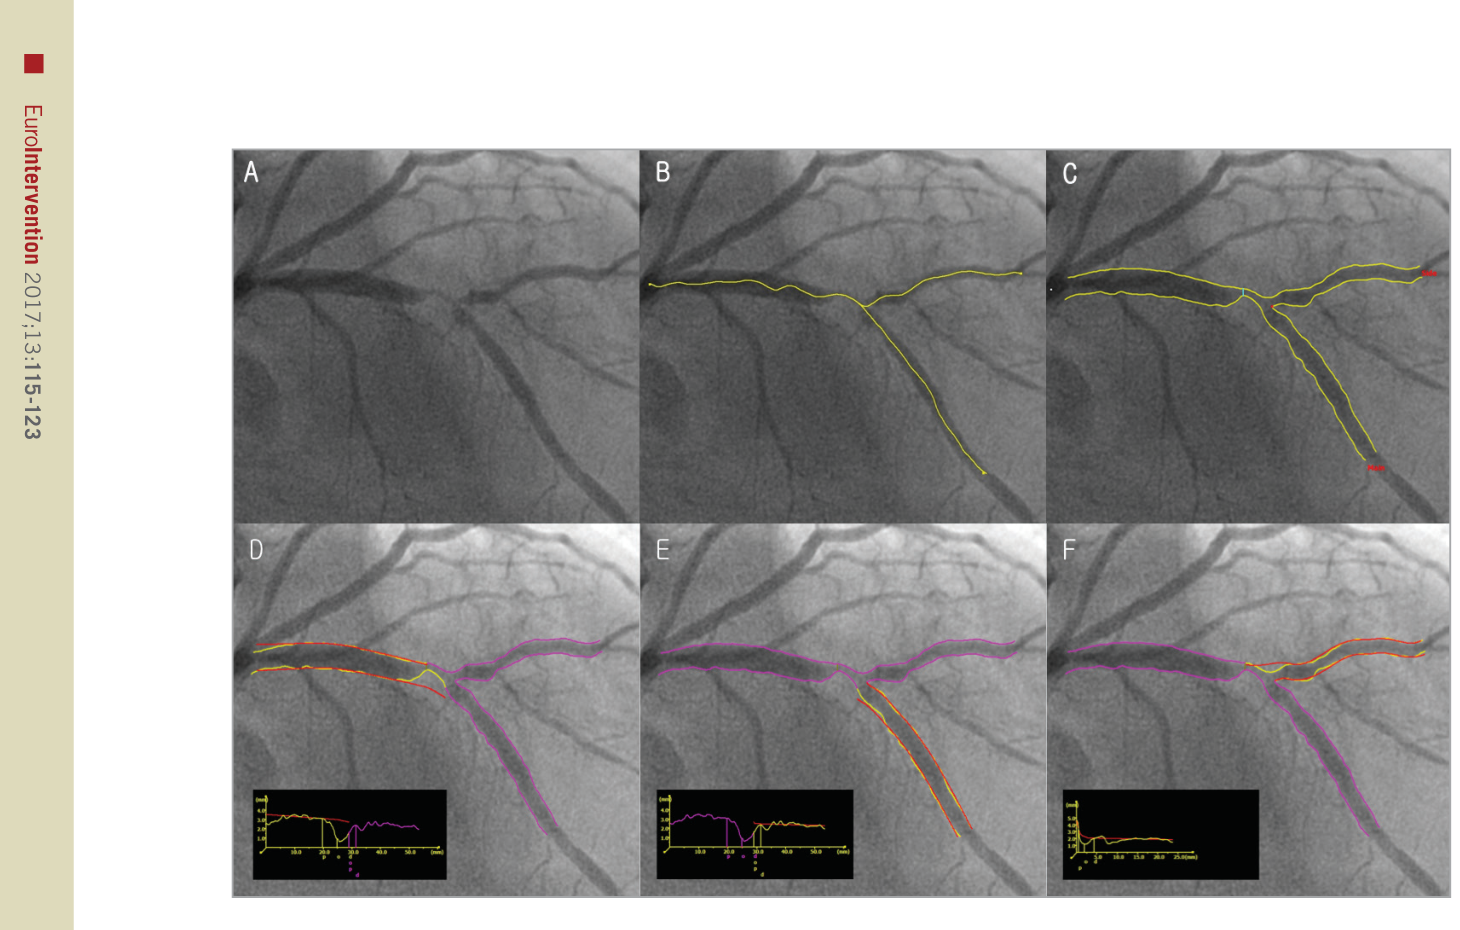
Figure 3. Figure 3. QAngio XA bifurcation software (Medis). A) A left anterior descending artery-diagonal branch bifurcation lesion. B) First, the analyst defines the segment of analysis by indicating one start point in the proximal vessel and one endpoint in each of the two distal branches, after which two wavepath pathlines from proximal to distal are detected (note that the proximal parts overlap). C) Subsequently, the vessel contours are automatically detected using the minimal cost algorithm (MCA). In addition to the vessel contours, the initial position of the carinal point and the proximal delimiter (independent of the presence of lesions) are automatically detected (red dot and light blue line, respectively), in order to define the vessel bifurcation with a model of four building blocks and its measurements, D and E). The T-shape’s arterial and reference diameter functions are determined using the Medis straight vessel diameter function for the proximal and distal main branch sections, subsequently combined in the middle by an interpolated diameter function for the bifurcation core transition. F) An adjusted Medis ostial diameter function is used for the side branch, reconstructing a proximal flare to correspond to the “mouth” of the ostium. Reprinted from Grundeken et al20.解説: QAngio XA分岐部ソフトウェアの動作を示しています。分析のセグメントを定義し、近位から遠位へのパスラインと血管輪郭が自動で検出されます。その後、このソフトウェアは4つの構成ブロックモデルで血管分岐を定義し、参照直径関数を決定します。
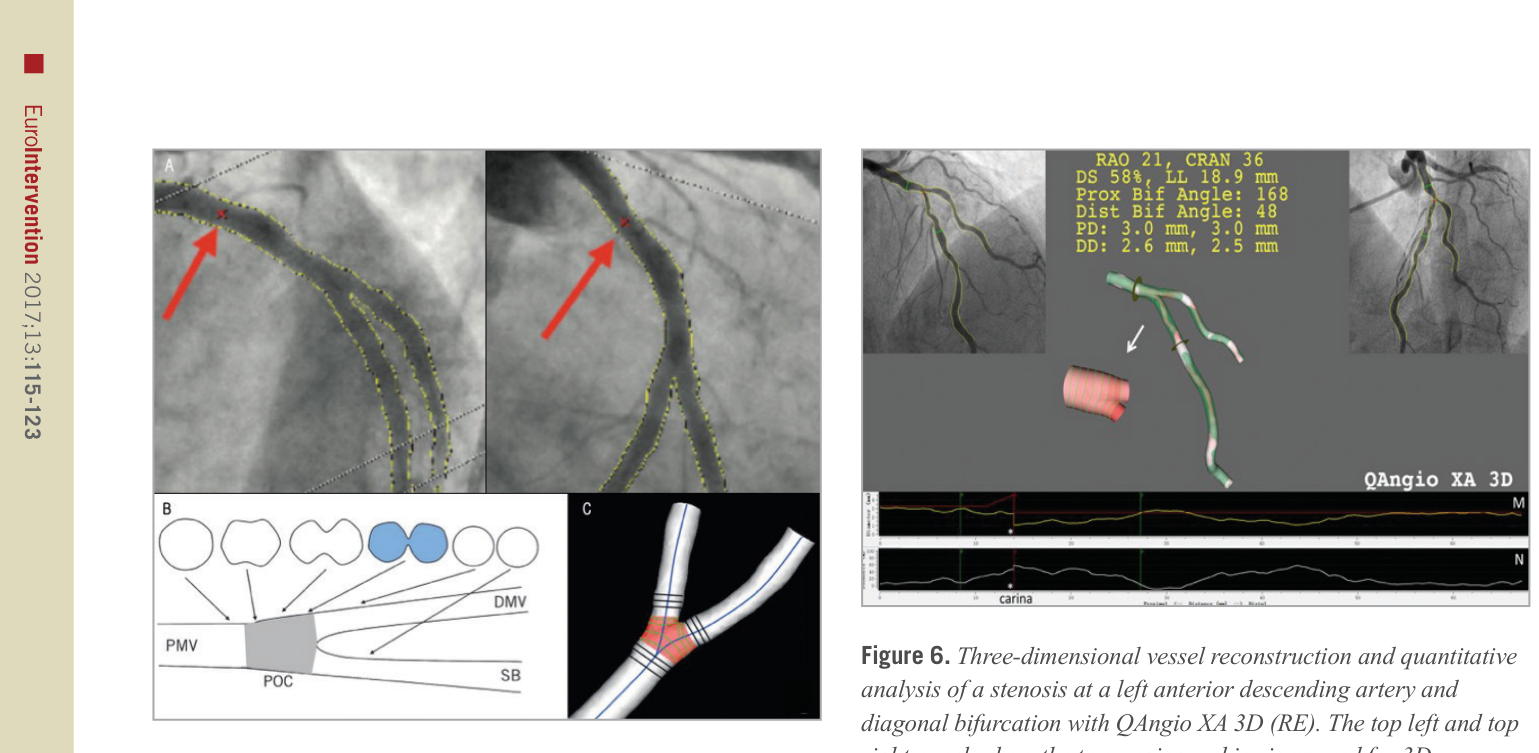
Figure 5. Figure 5. CAAS QCA 3D bifurcation methodology. Automatic selection of common imaging points (CIP, red crosses indicated with red arrows) in two different projections (A). The analysis can optimise the position of CIP manually if necessary. Definition of polygon of confluence (POC). B) Within POC (grey) the vessel is slowly widening, but at the same time the top and bottom are slowly collapsing towards a single point (figure-of-eight shape in blue, panel B) after which we have two “normal”-shaped vessels. C) The start of the POC (in red) is defined as the position where plane cross-sections give way to curved ones; exactly the opposite marks the end of the POC. DMV: distal main vessel; PMV: proximal main vessel; POC: polygon of confluence; SB: side branch. Reprinted from Onuma et al24.解説: CAAS QCA 3D分岐部分析の手法を示しており、2つの異なる投影における共通画像点(CIP)の自動選択、3D再構築、そして合流多角形(POC)の定義が含まれます。POCの内部では、単一血管分析とは異なる方法で断面が定義されます。
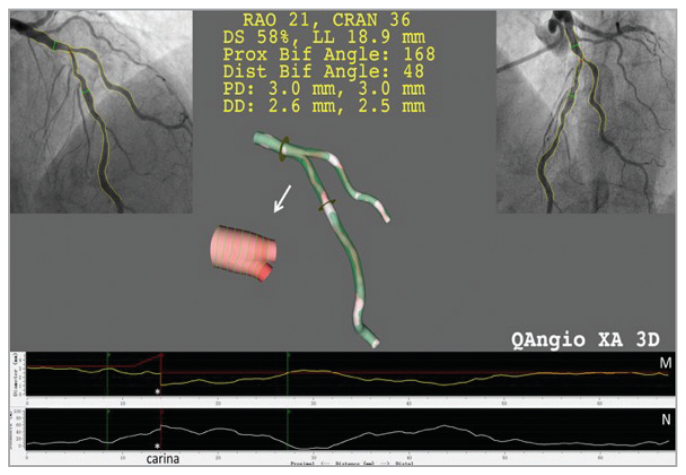
)。一方、QAngio XA 3D (RE)ソフトウェアでは、参照直径関数の計算が各3つのセグメントに基づいて行われ、この3つの参照直径関数を用いて参照コア直径関数が再構築されます。このモデルでは、分岐部のコアにおいて多数の弯曲した卵形平面が作成され、その弯曲度は遠位分岐角に依存します(
Figure 6. Figure 6. Three-dimensional vessel reconstruction and quantitative analysis of a stenosis at a left anterior descending artery and diagonal bifurcation with QAngio XA 3D (RE). The top left and top right panels show the two angiographic views used for 3D reconstruction. The reconstructed lumen and reference surface of the bifurcation are shown in the middle panel. M) The lumen and reference diameter functions for the left anterior descending artery (LAD) including the bifurcation core. N) The stenosis function for the LAD. Note that the stenosis function jumps at the carina (asterisk) due to the relatively higher stenosis in the LAD than in the diagonal ostium.解説: QAngio XA 3D (RE)による左前下行枝と対角枝の分岐部狭窄の3次元血管再構築と定量分析を示しています。2つのアンギオグラフィー画像から再構築された管腔と参照表面、そして管腔および参照直径関数が表示されています。
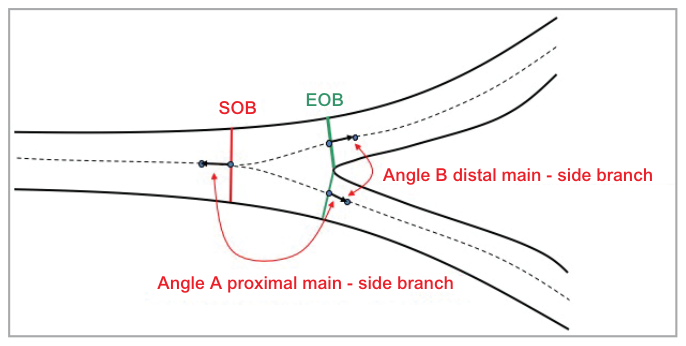
Figure 7. Figure 7. Calculation of bifurcation angles. Two bifurcation angles are computed between the proximal main vessel (PMV) and the SB (proximal angle or angle A), and between the distal main vessel (DMV) and the SB (distal angle or angle B); they are derived from a 3D vector of the centreline in the PMV at the start of the bifurcation core (directed from distal to proximal) and 3D vectors of the centrelines in the DMV and SB at the distal end of the bifurcation core.解説: 分岐角の計算方法を示しています。近位主血管(PMV)と側枝(SB)の間の近位角(A)、および遠位主血管(DMV)と側枝(SB)の間の遠位角(B)が、中心線の3Dベクトルから計算されます。
)。これにより、2D QCAよりも正確な角度測定が可能になります。CAAS 3D分岐部ソフトウェアは、in vitro研究で高い精度と再現性を示し、in vivoでは血管内超音波(IVUS)との高い相関が確認されています。QAngio XA 3D (RE)ソフトウェアも、ファントム研究で高い角度評価精度を示し、in vivoではIVUSおよび光干渉断層計(OCT)との良好な相関が確認されています。
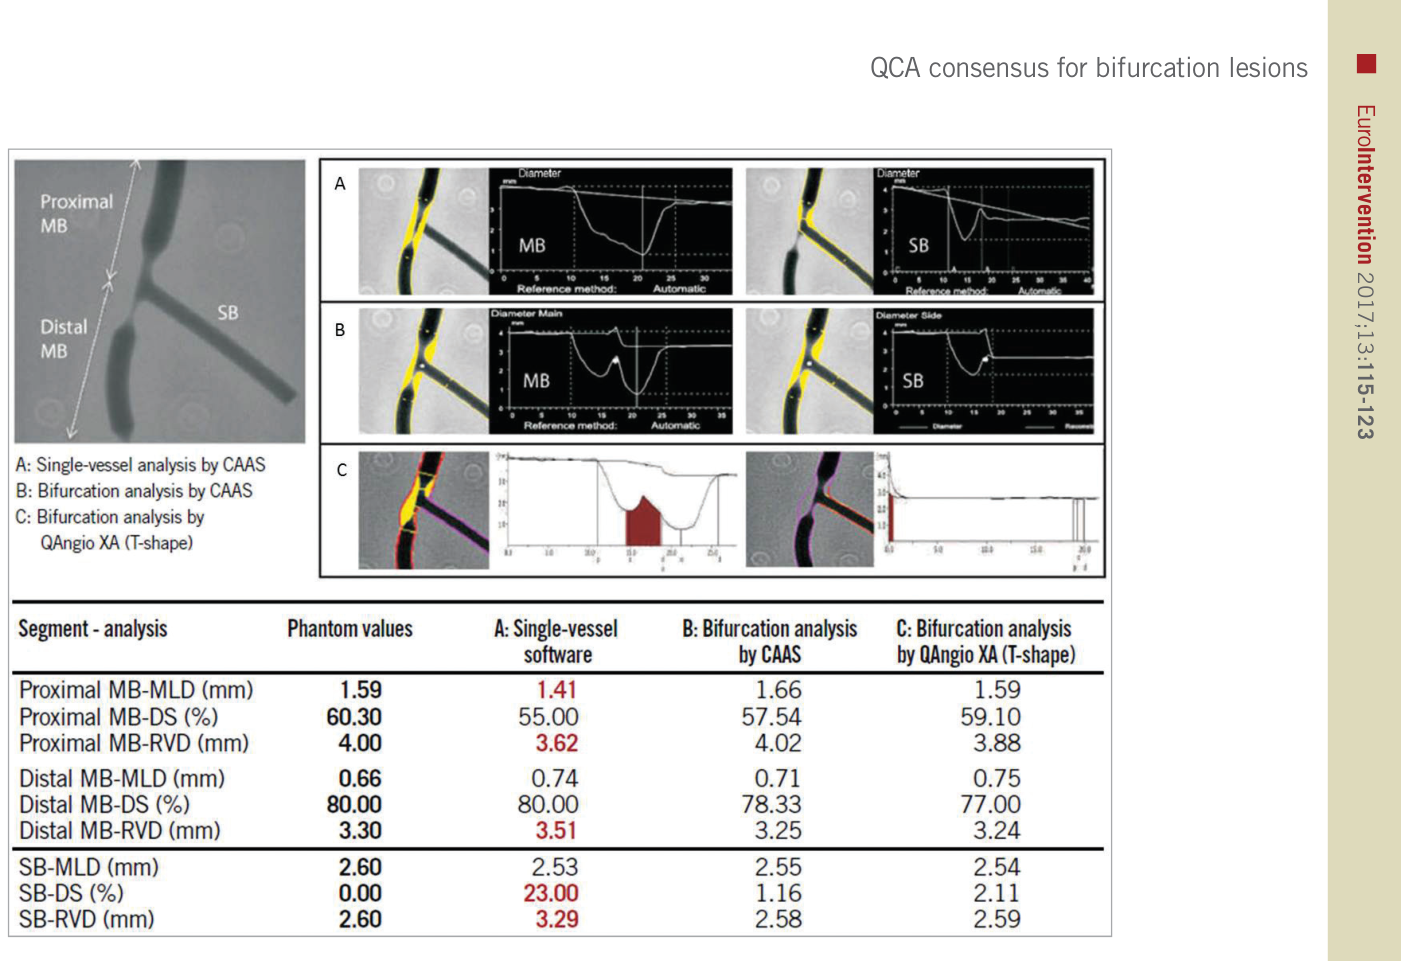
Figure 4. Figure 4. Quantitative coronary angiography measurement by CAAS and QAngio XA software for a bifurcated lesion in the calibrated phantom. Angiographic parameters including reference diameter (RVD), minimal lumen diameter (MLD), % diameter stenosis (%DS) are given in the PMV, DMV, and side branch (SB). A cine-angiogram demonstrated moderate to severe stenosis both in the proximal main vessel (PMV) and in the distal main vessel (DMV) with a Medina class 1,1,0. The conventional single-vessel method measured a significantly smaller RVD in the PMV and a larger RVD in the DMV and SB. A) QCA using the conventional single-vessel algorithm by CAAS. B) QCA using the bifurcation algorithm by CAAS. C) QCA using the T-shape bifurcation algorithm by QAngio XA. QCA: quantitative coronary angiography. Reprinted from Grundeken et al20.解説: キャリブレーションされたファントムにおける分岐部病変のQCA測定結果を、従来の単一血管アルゴリズムと、CAASおよびQAngio XAの分岐部アルゴリズムで比較しています。単一血管分析では、近位主血管(PMV)の参照血管直径(RVD)と直径狭窄率(%DS)が過小評価され、遠位主血管(DMV)と側枝(SB)では過大評価されることが示されています。
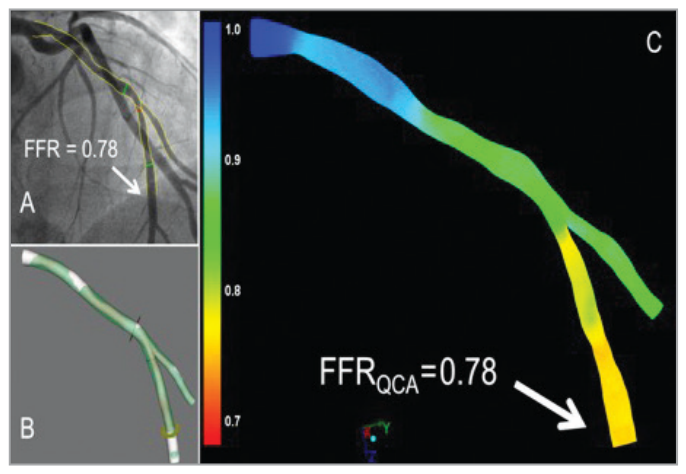
Figure 8. Figure 8. Examples of the FFR derived from angiography using the QAngio XA 3D (RE) (Medis) bifurcation model. The angiogram with the invasive FFR measurement (FFR=0.78) is shown in panel A. Panels B and C show the 3D reconstruction and the angiography- derived FFR (QFR). In this case the FFR and QFR match precisely, both being 0.78 at the distal location of the main branch, as indicated by the arrows. FFR: fractional flow reserve解説: QAngio XA 3D (RE)分岐部モデルを用いたアンギオグラフィー由来のFFR(QFR)の例を示しています。侵襲的FFR測定値0.78に対し、アンギオグラフィー由来FFR(QFR)も遠位主枝で0.78と一致しており、3D再構築も表示されています。
,
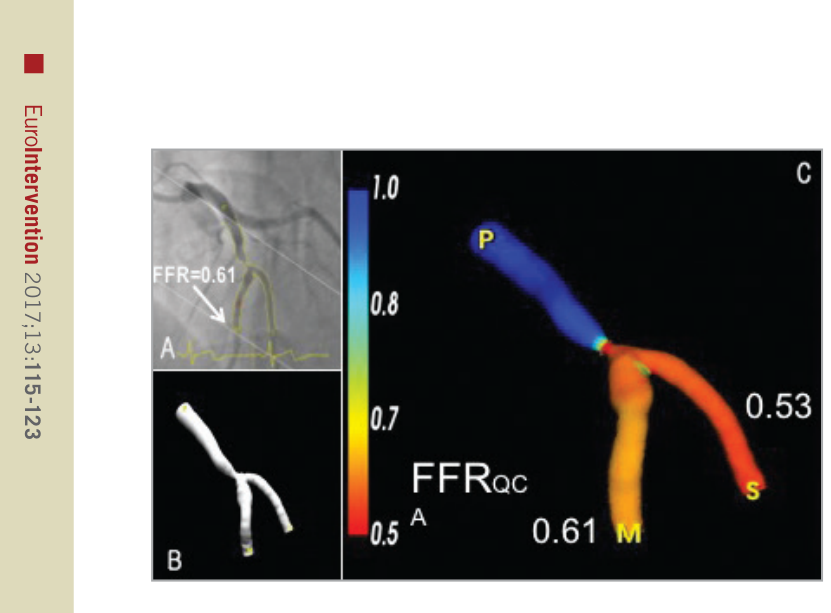
Figure 9. Figure 9. Illustrative examples of the FFR derived from angiography using the CAAS QCA 3D (Pie Medical Imaging). A) One of the two angiographic projections used to generate the 3D reconstruction of the bifurcation LAD and 2nd diagonal as shown in panel B. C) The 3D reconstruction including the angiography-derived FFR. In this example, the angiography-derived FFR at the distal location of the main branch was 0.61 and 0.53 for the side branch. Invasive FFR measurement within the main branch was 0.62. FFR: fractional flow reserve解説: CAAS QCA 3Dを用いたアンギオグラフィー由来FFRの例を示しています。3D再構築と、主枝(0.61)および側枝(0.53)におけるアンギオグラフィー由来FFRの値を表示しています。主枝での侵襲的FFR測定値は0.62でした。
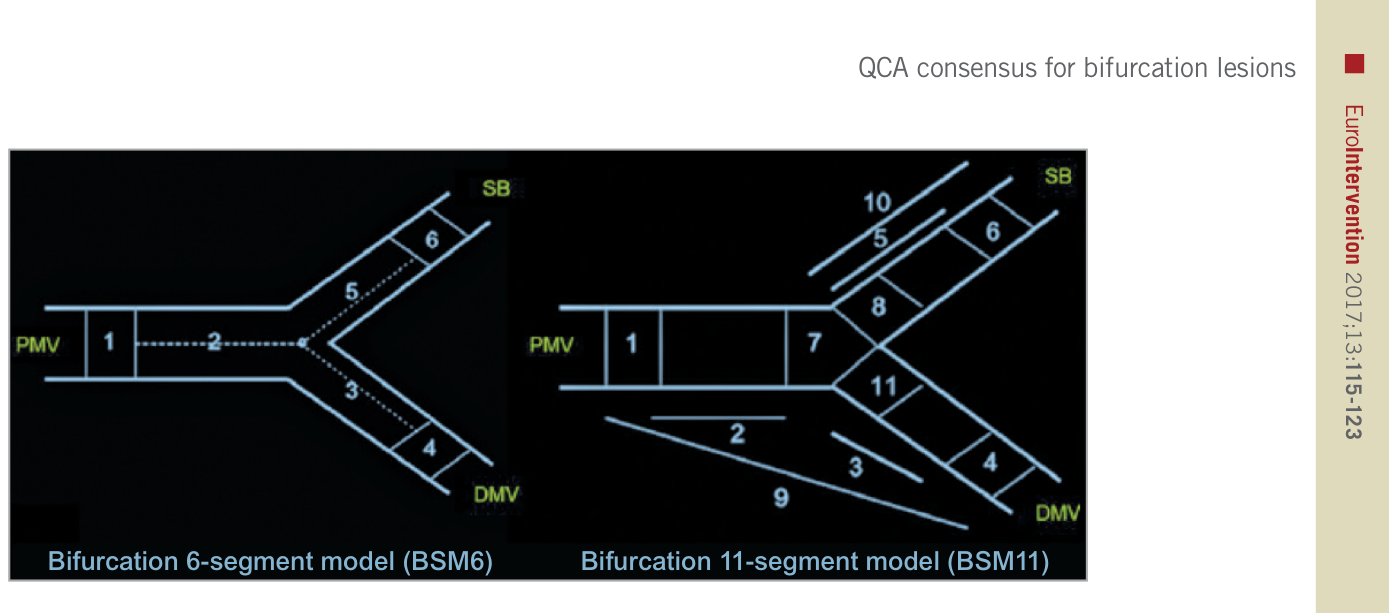
Figure 10. Figure 10. Bifurcation segment models. A composite of segments 2, 3, and 5 in the bifurcation six-segment model (BSM6) corresponds to the “treated segment,” where the stents were implanted or balloons were dilated, including the proximal main vessel (PMV), distal main vessel (DMV) and side branch (SB). The segments 2, 3, and 5 are divided by the point of bifurcation (POB), defined as the point where all the centrelines meet and the mid-point of the largest circle/sphere that can reach all three contours in bifurcation. Segments 1, 4, and 6 correspond to 5 mm segments beyond the treated segment (left panel). Segment 8 in BSM11 reflects 3 mm ostial segments of the SB (right panel). Reprinted from Girasis et al4.解説: 冠動脈分岐部病変の定量的冠動脈アンギオグラフィー(QCA)分析に用いられる分岐部6セグメントモデル(BSM6)と分岐部11セグメントモデル(BSM11)の図です。これらのモデルは、治療されたセグメントとその近位および遠位の5mmセグメントを定義し、病変の位置と重症度を詳細に報告するために使用されます。

コメントを残す