どうも、Beyond the Pixelです。頸椎のアライメント(並び)は、私たちの全体的な健康と運動能力にとって非常に重要です。首や肩の痛み、顎関節の機能障害など、頸椎の異常は様々な症状を引き起こす可能性があります。これらの疾患を正確に特定し、分類することは、適切かつ効果的な医療処置のために不可欠です。しかし、頸椎X線画像の目視での解釈は時間がかかり、専門家によるばらつきが生じやすいという課題がありました。このような背景から、今回ご紹介する研究では、深層学習(ディープラーニング)モデルを活用した自動ウェブベースのプロトタイプが提案されています。
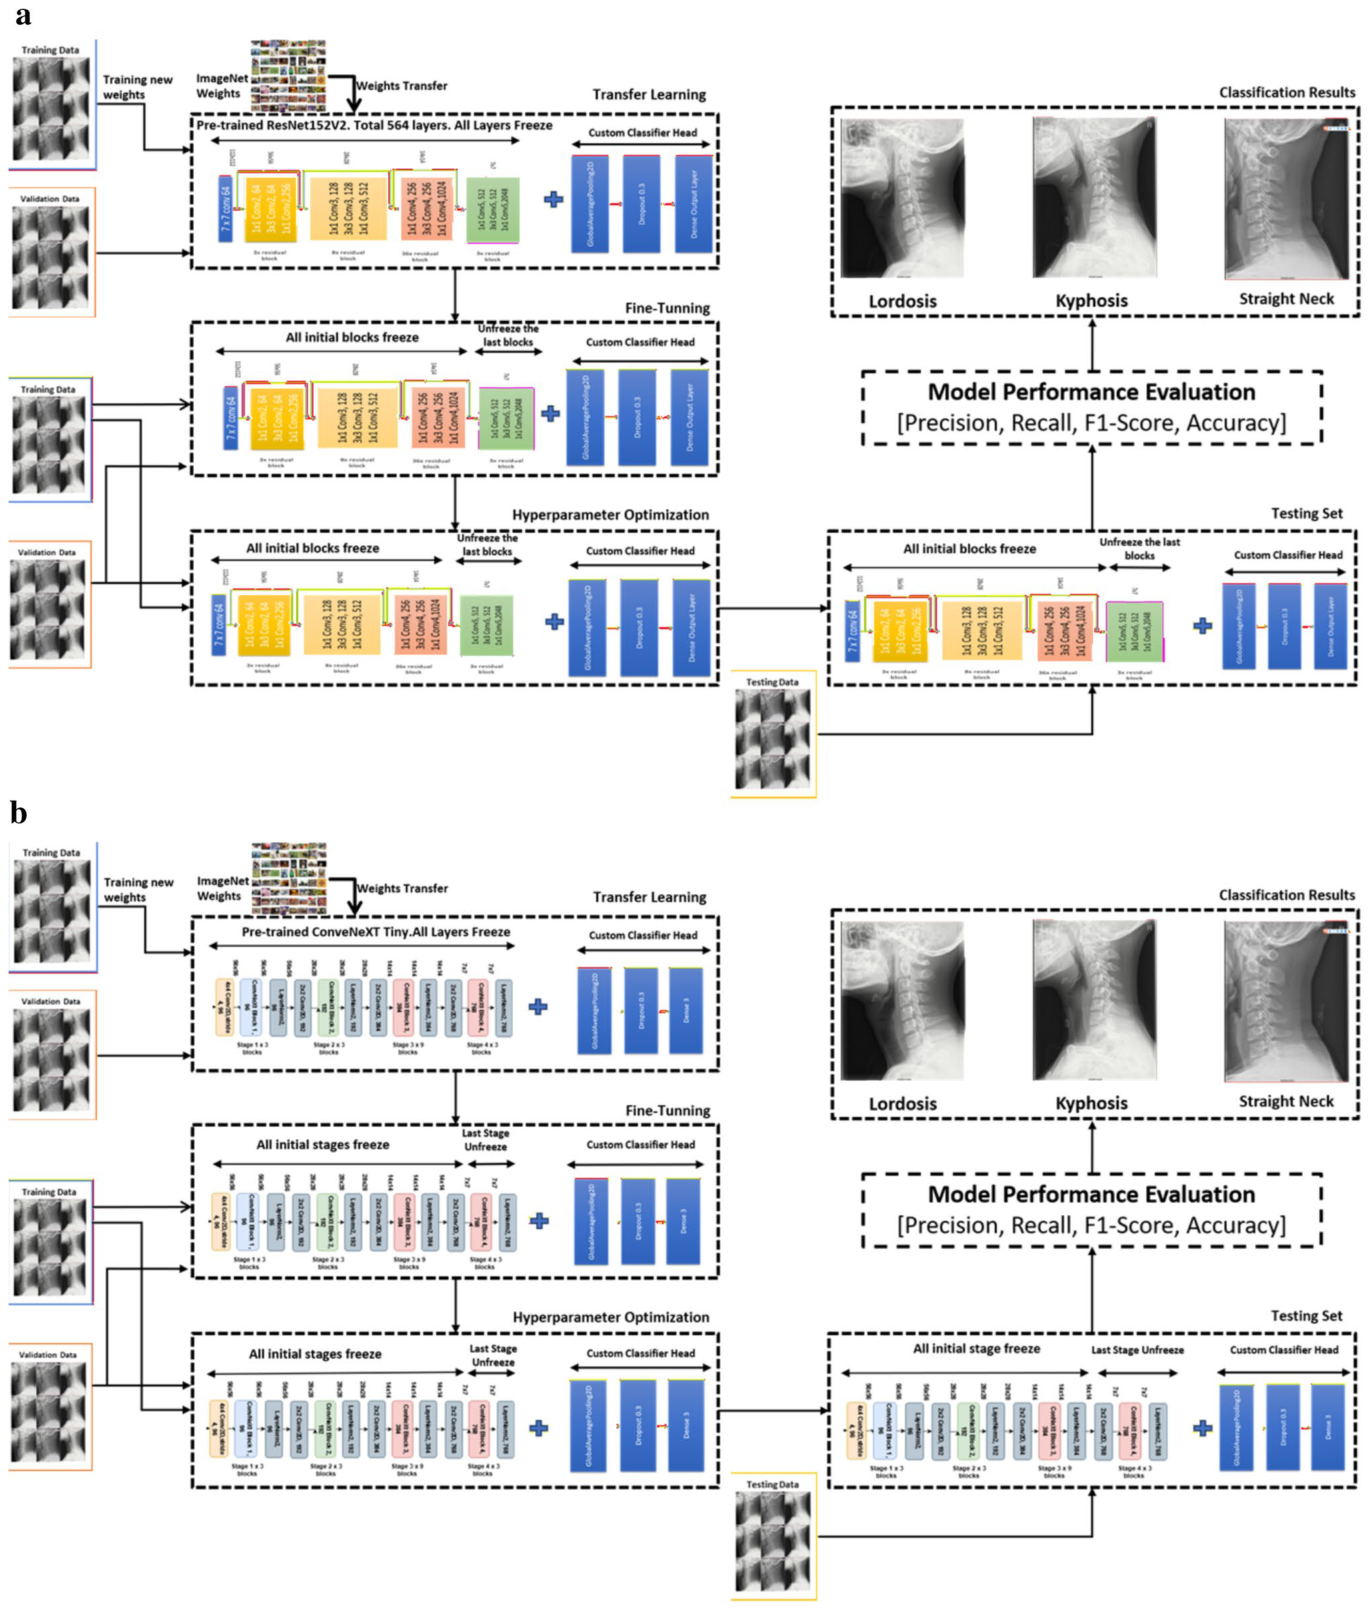
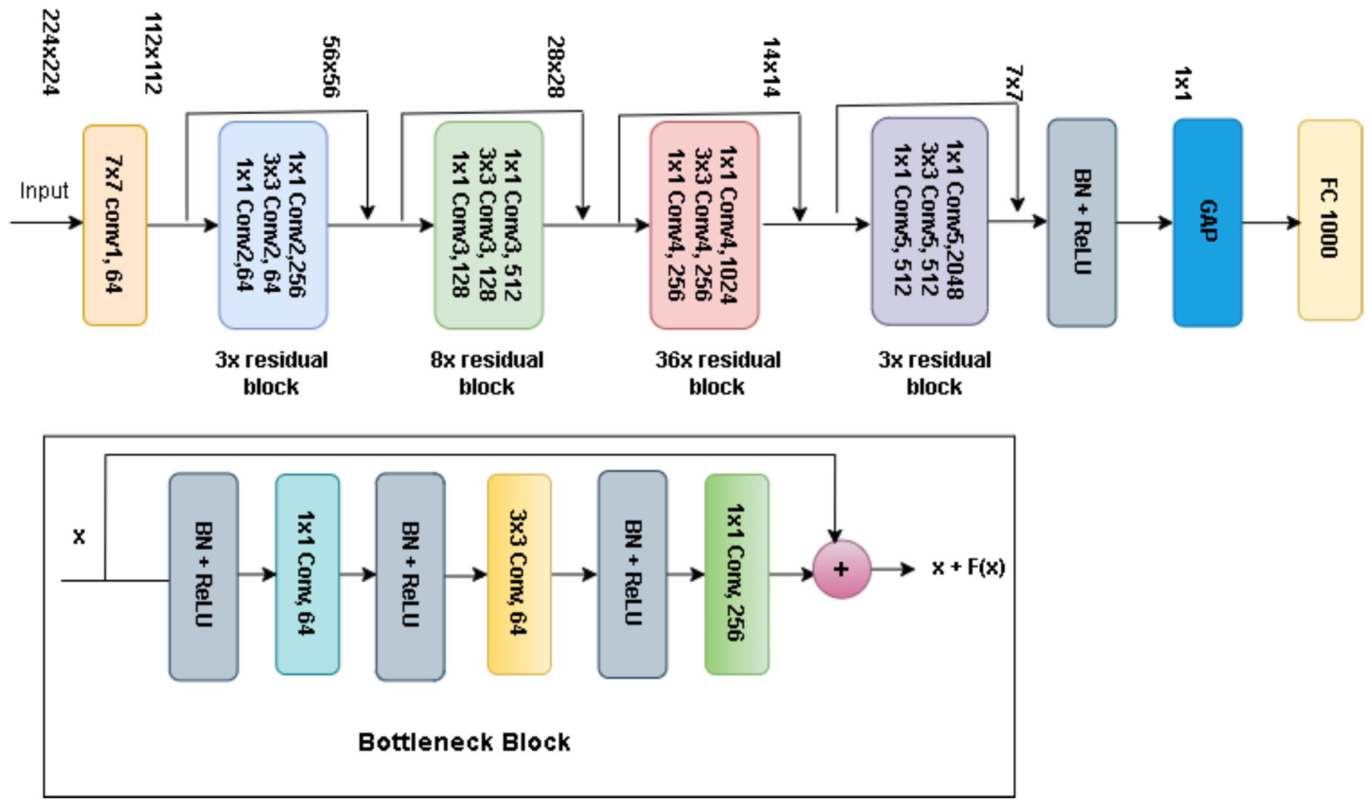
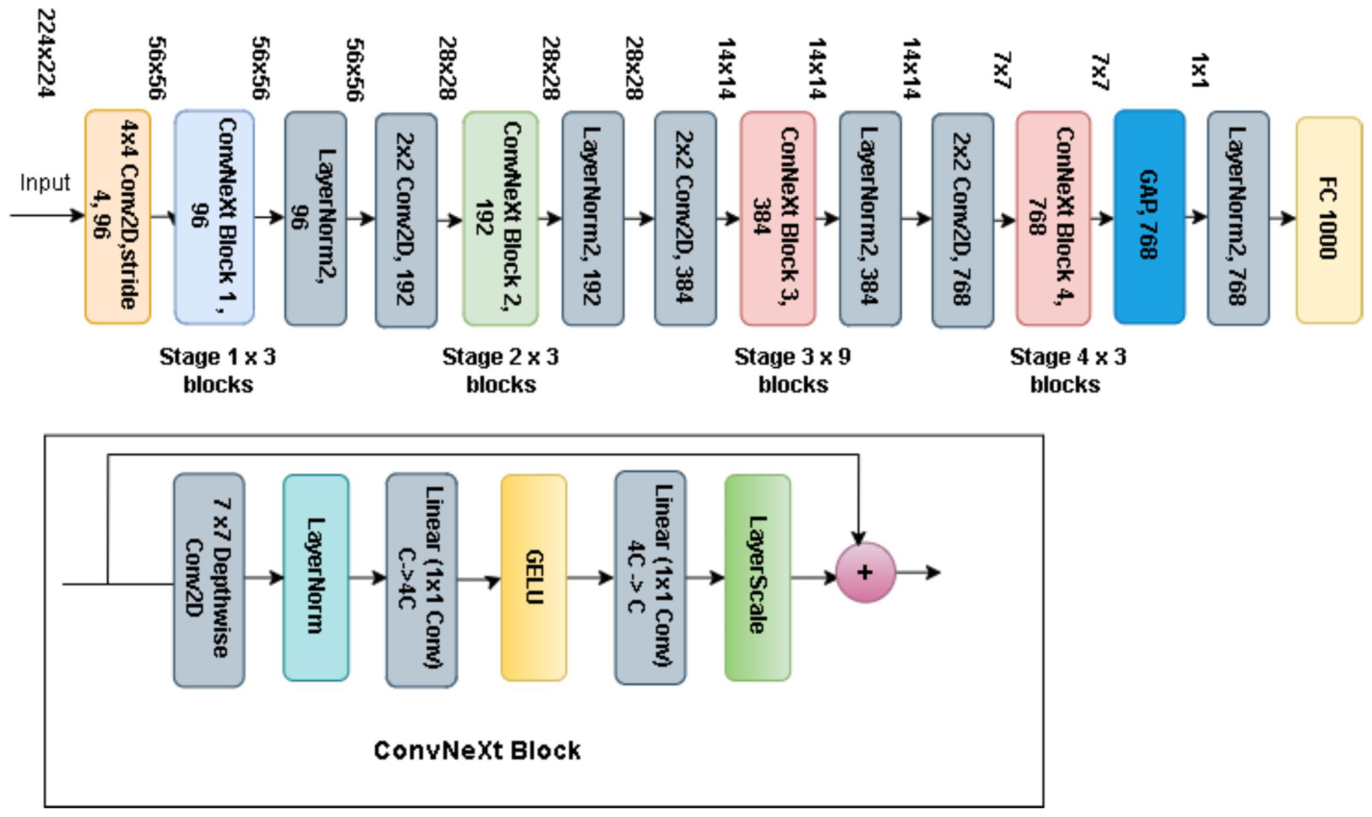
Figure 8. Fig. 8 a Detailed architecture of the proposed ResNet152V2 model. b Detailed architecture of the proposedConvNeXt model解説: 提案されたResNet152V2モデルとConvNeXtモデルの(a)および(b)詳細なアーキテクチャ、および層化5分割交差検定スキーム内で実行される多段階深層学習パイプライン全体を示しています。
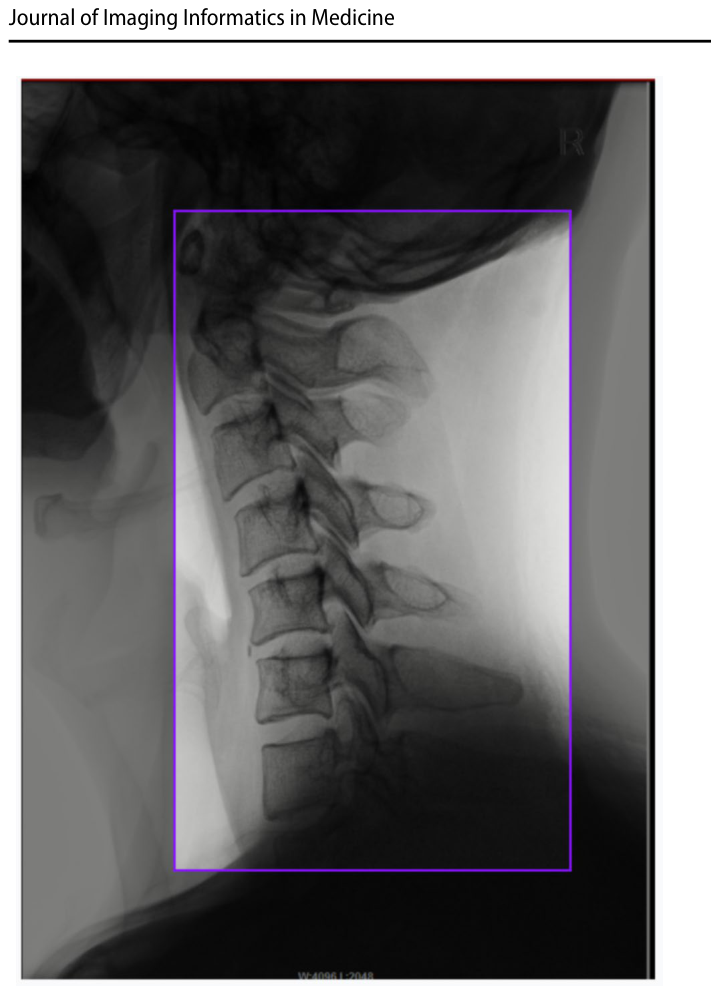
Figure 2. Fig. 2 Region of interest of the lateral cervical spine X-ray (purple colour bounding box)解説: 横方向の頸椎X線画像において、関心領域(ROI)が紫色のバウンディングボックスで示されています。これは、モデルが解析の焦点を当てる頸椎の範囲を明確に定義したものです。
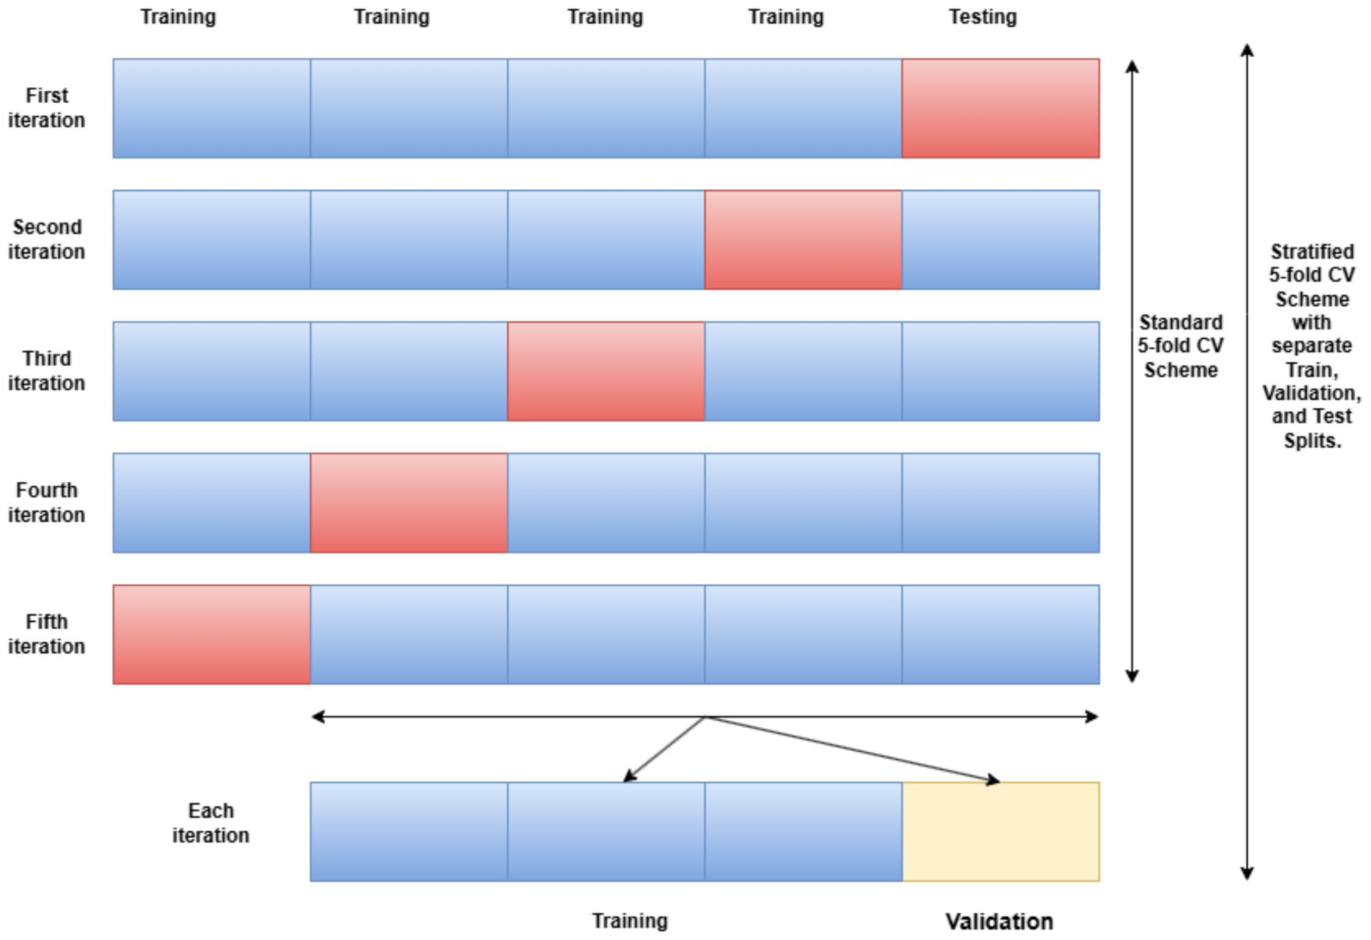
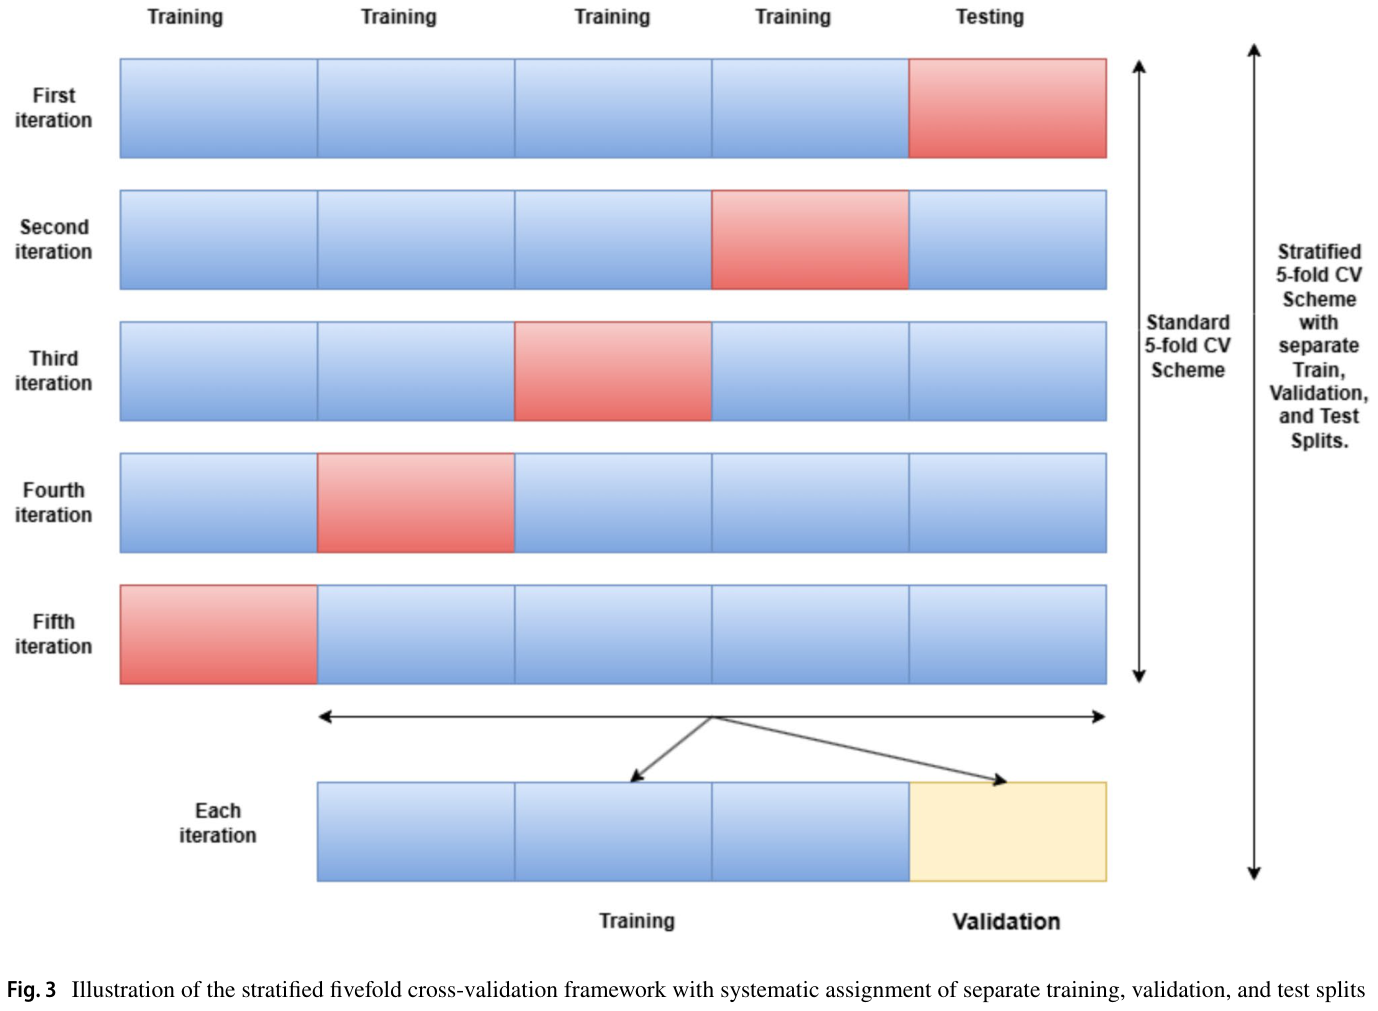
Figure 3. Fig. 3 Illustration of the stratified fivefold cross-validation framework with systematic assignment of separate training, validation, and test splits解説: 層化5分割交差検定フレームワークの図です。各イテレーション(繰り返し)において、学習、検証、テストの各データセットが系統的に割り当てられ、モデルの信頼性評価に用いられます。
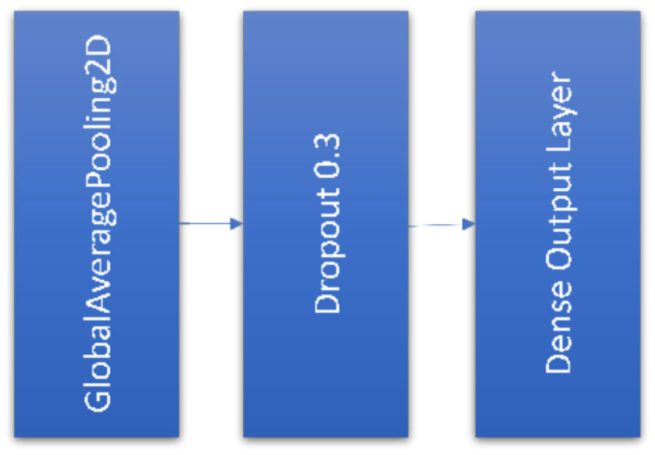
Figure 7. Fig. 7 Custom head for both models解説: ResNet152V2とConvNeXt Tinyの両モデルに追加されたカスタム分類ヘッドの構造を示しています。GlobalAveragePooling2D層、ドロップアウト層、およびDense出力層で構成されています。
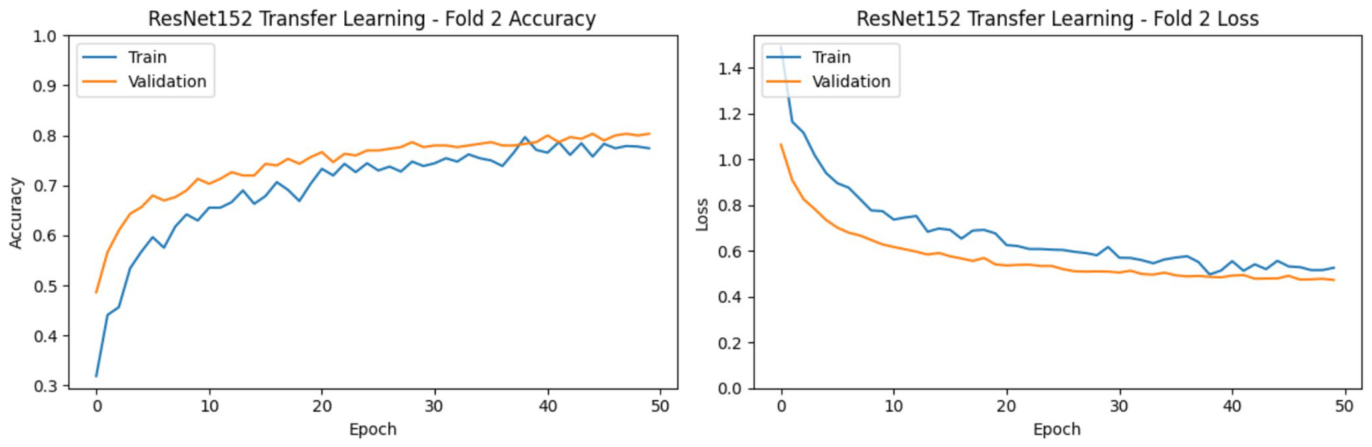
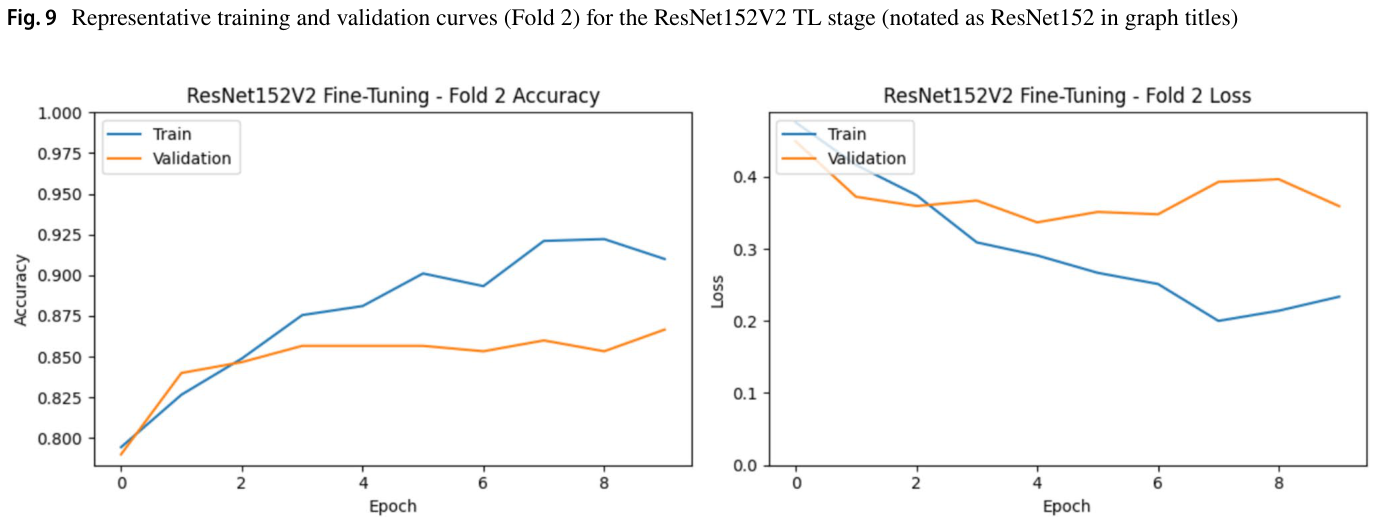
Figure 9. Fig. 9 Representative training and validation curves (Fold 2) for the ResNet152V2 TL stage (notated as ResNet152 in graph titles)解説: ResNet152V2モデルの転移学習(TL)段階における、Fold 2の学習曲線と検証曲線を示しています。左のグラフは精度、右のグラフは損失の推移を表しています。
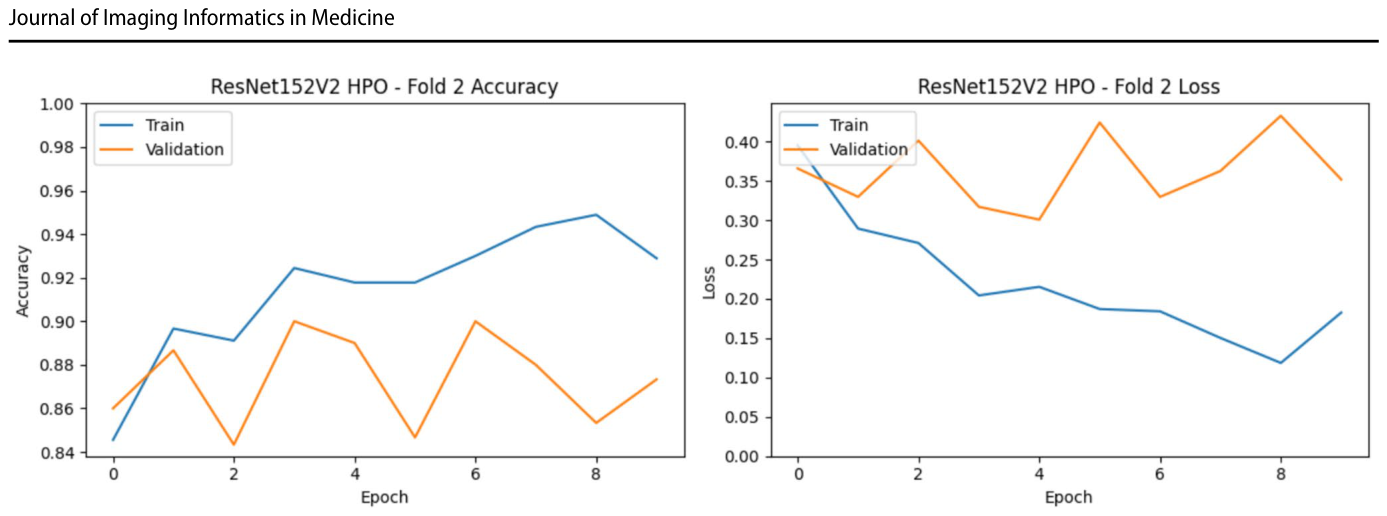
Figure 10. Fig. 10 Selected training and validation curves from Fold 2 for the ResNet152V2 FT stage解説: ResNet152V2モデルのファインチューニング(FT)段階における、Fold 2の学習曲線と検証曲線を示しています。左のグラフは精度、右のグラフは損失の推移を表しています。
Figure 11. Fig. 11 Representative training and validation curves (Fold 5) for the ResNet152V2 TL stage解説: ResNet152V2モデルのTL段階における、Fold 5の代表的な学習曲線と検証曲線を示しています。左のグラフは精度、右のグラフは損失の推移を表しています。⚠ 自動抽出画像の検証で一致を確認できませんでした。正確な内容は元論文のFigure 11をご参照ください。
は、ResNet152V2モデルのTL段階における代表的な学習曲線と検証曲線を示しています。
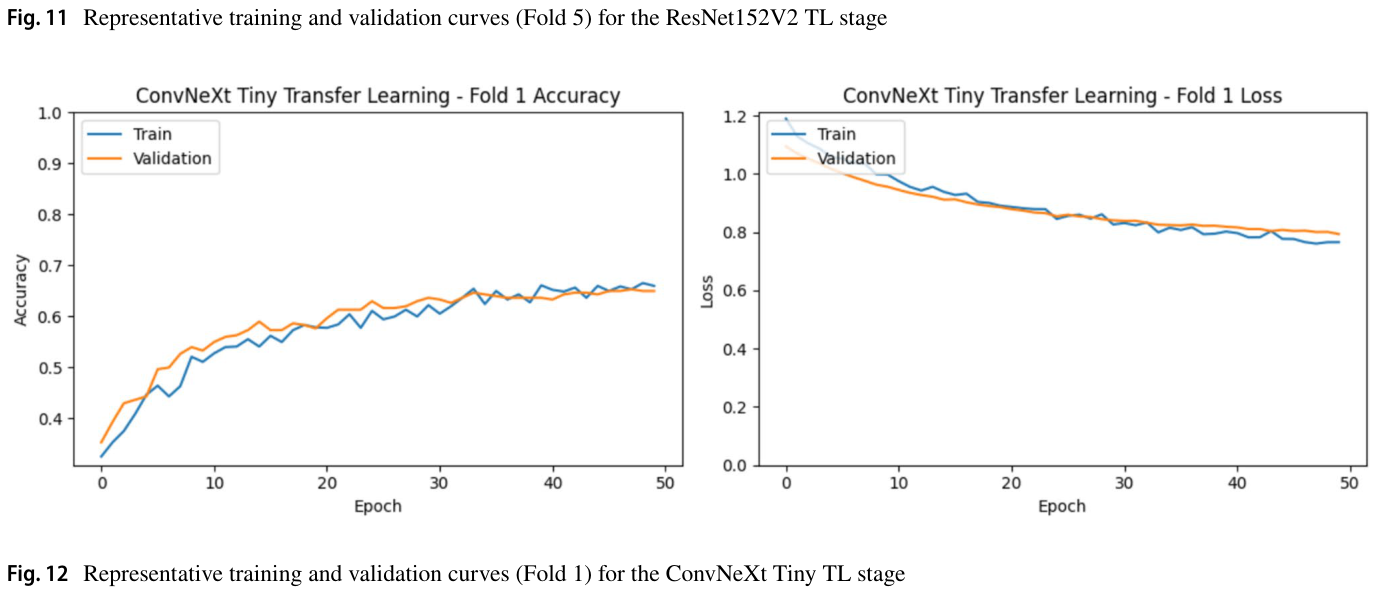
Figure 12. Figure 12 shows representative TL training and validation graphs for the ConvNeXt Tiny model, selected from Fold 1. The training accuracy starts at 0.33 and steadily increases to 0.66 over 50 epochs. The validation accuracy exceeds the training accuracy until epoch 32 and closely tracks it through- out training, ranging from 0.35 to 0.65. Concurrently, the training loss steadily decreases from 1.19 to 0.77. On the other hand, the validation loss also closely follows the training loss, dropping from 1.09 to 0.79 and ending slightly higher than the training loss. Both training and validation curves tightly track each other, indicating strong model generalisation and absence of overfitting during the TL stage.解説: ConvNeXt Tinyモデルの転移学習(TL)段階における、Fold 1の代表的な学習曲線と検証曲線を示しています。左のグラフは精度、右のグラフは損失の推移を表しています。
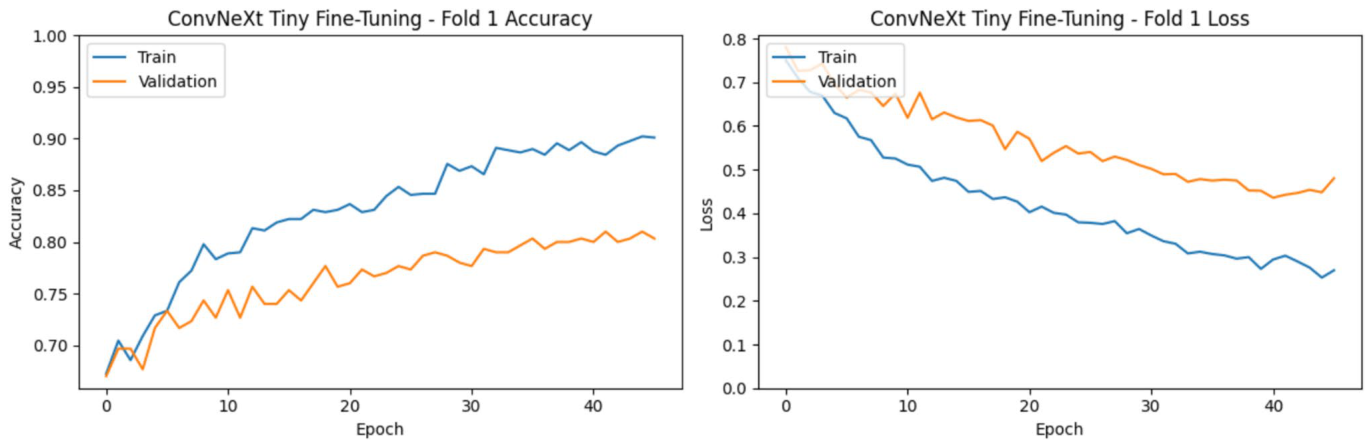
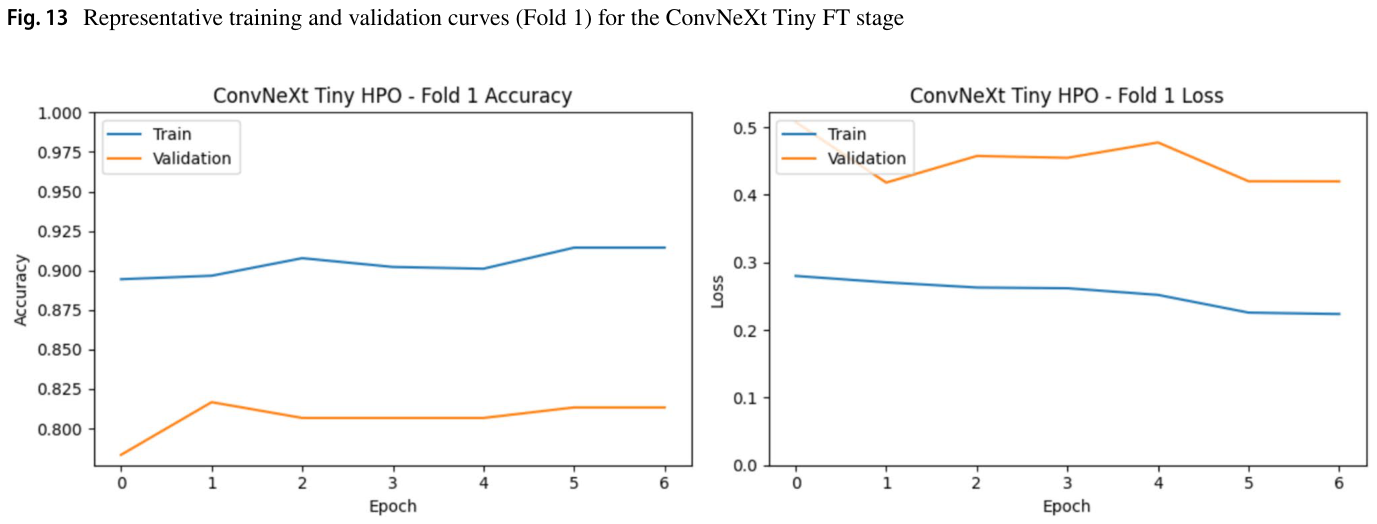
Figure 13. Fig. 13 Representative training and validation curves (Fold 1) for the ConvNeXt Tiny FT stage解説: ConvNeXt Tinyモデルのファインチューニング(FT)段階における、Fold 1の代表的な学習曲線と検証曲線を示しています。左のグラフは精度、右のグラフは損失の推移を表しています。
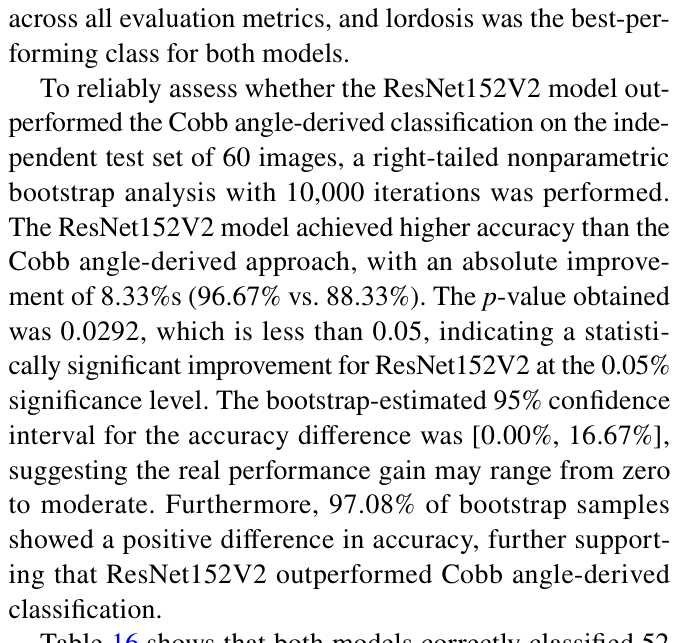
さらに、CNNベースの分類はコブ角ベースの分類を大幅に上回ることが示されました(精度96.67% vs 88.33%)。10,000回の再サンプリングを用いた95%ブートストラップCIは、ルールベースの分類に対するCNNベースの分類の有意な改善を示しました。右片側検定では、0.05の有意水準でp値が0.0292となり、ブートストラップサンプルの97.08%が精度に正の差を示していることと一致しました。この結果は、深層学習モデルが頸椎アライメントの自動評価において、伝統的なコブ角測定よりも高い精度で分類できる可能性を示唆しています。
ウェブサイト開発と免責事項
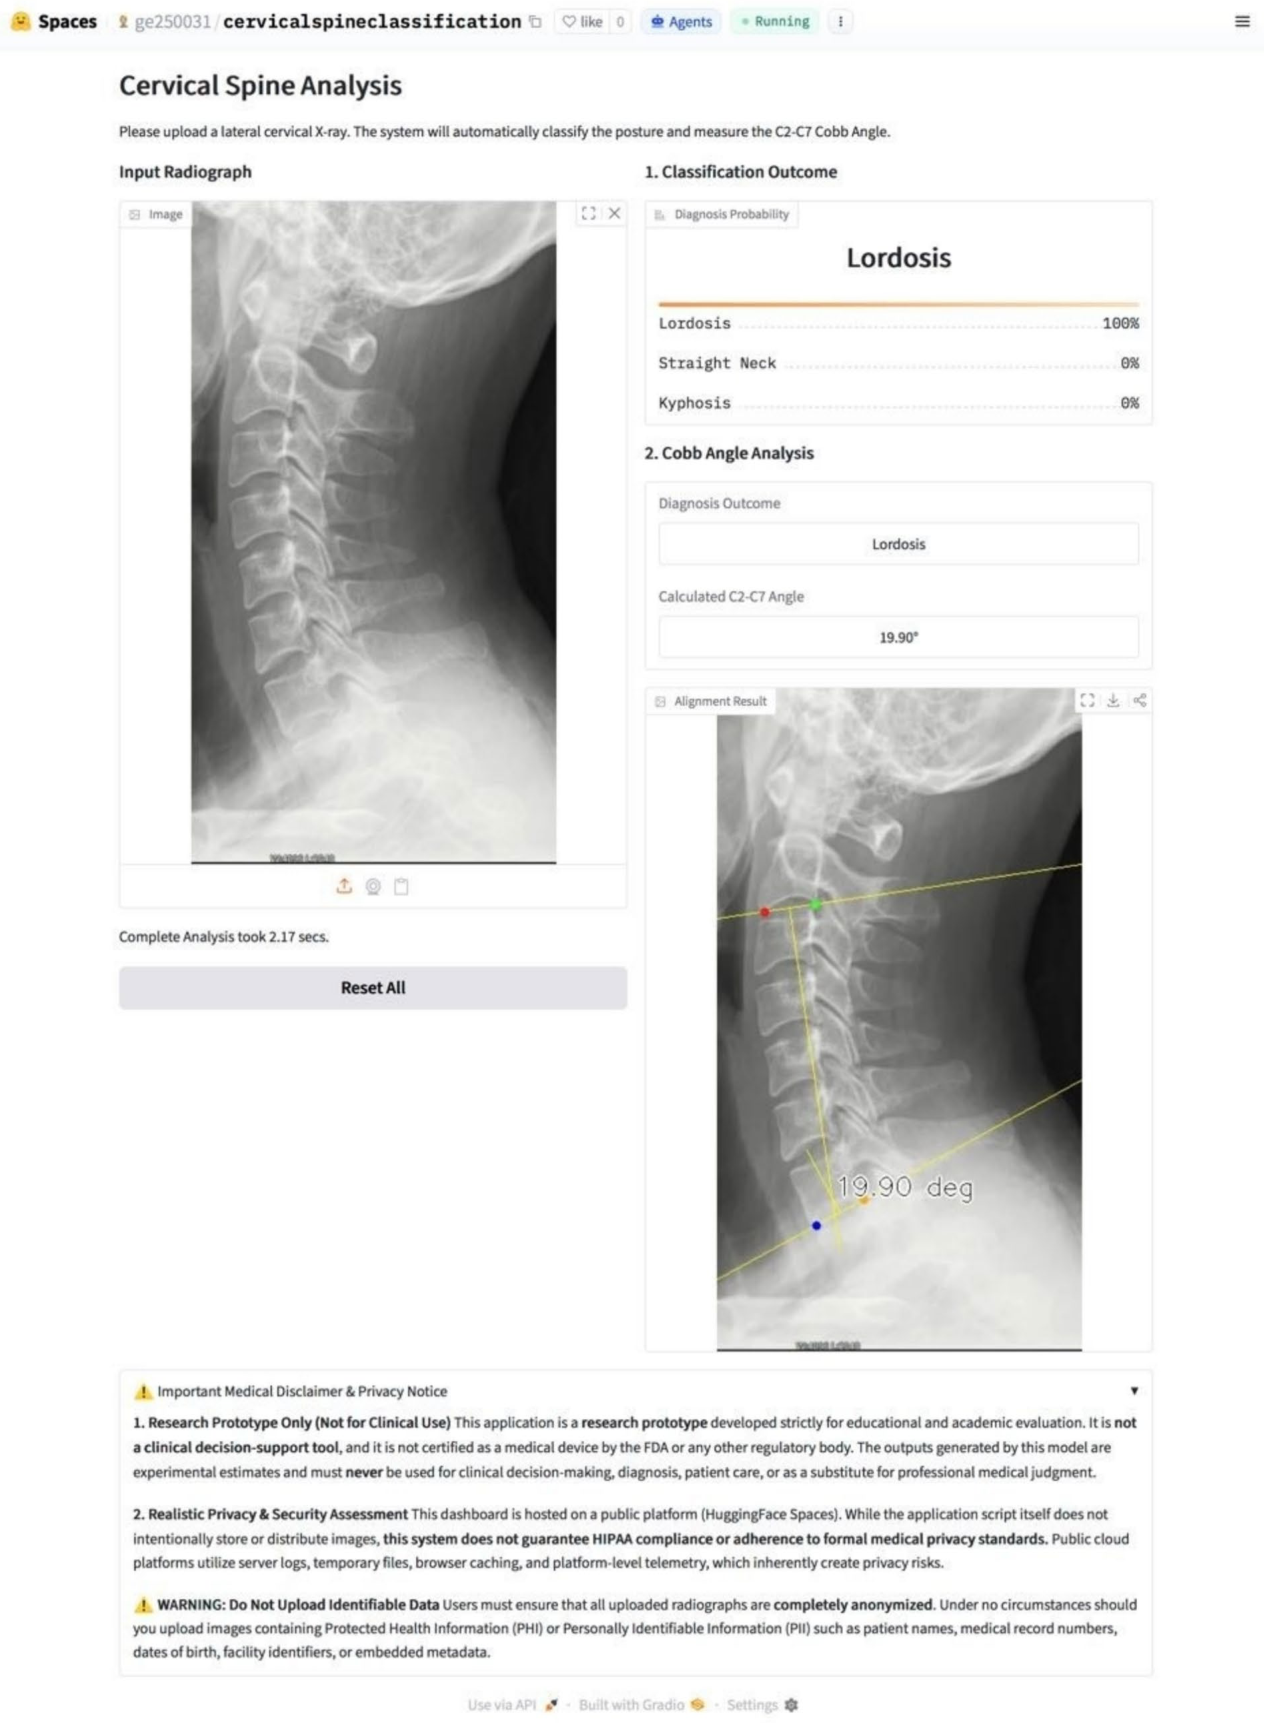
本研究では、Gradioフレームワークを用いて統一されたウェブインターフェースが開発されました。これにより、ResNet152V2モデルによる頸椎アライメント分類と、ENetB4モデルによるC2-C7ランドマーク予測およびコブ角推定の2つの異なるニューラルネットワークアーキテクチャが単一の推論パイプラインに統合されています。ウェブサイトはHugging Face Spacesにデプロイされており、学術的な利用可能性を高めるために基本的なシングルCPUが使用されています。重要な点として、ウェブサイトのフッターには「医療免責事項およびプライバシー通知」ドロップダウンメニューが統合されており、このアプリケーションがFDA規制の医療機器ではなく、実験的なプロトタイプであることが明記されています。また、セキュリティの懸念から、アップロードされた画像をサーバーに保存しない純粋なインメモリ処理がバックエンドで使用され、データライフサイクルを数秒に短縮することで、不正なデータ抽出のリスクを最小限に抑えるよう設計されています。
Figure 14. Fig. 14 Representative training and validation curves (Fold 1) for the ConvNeXt Tiny HPO stage
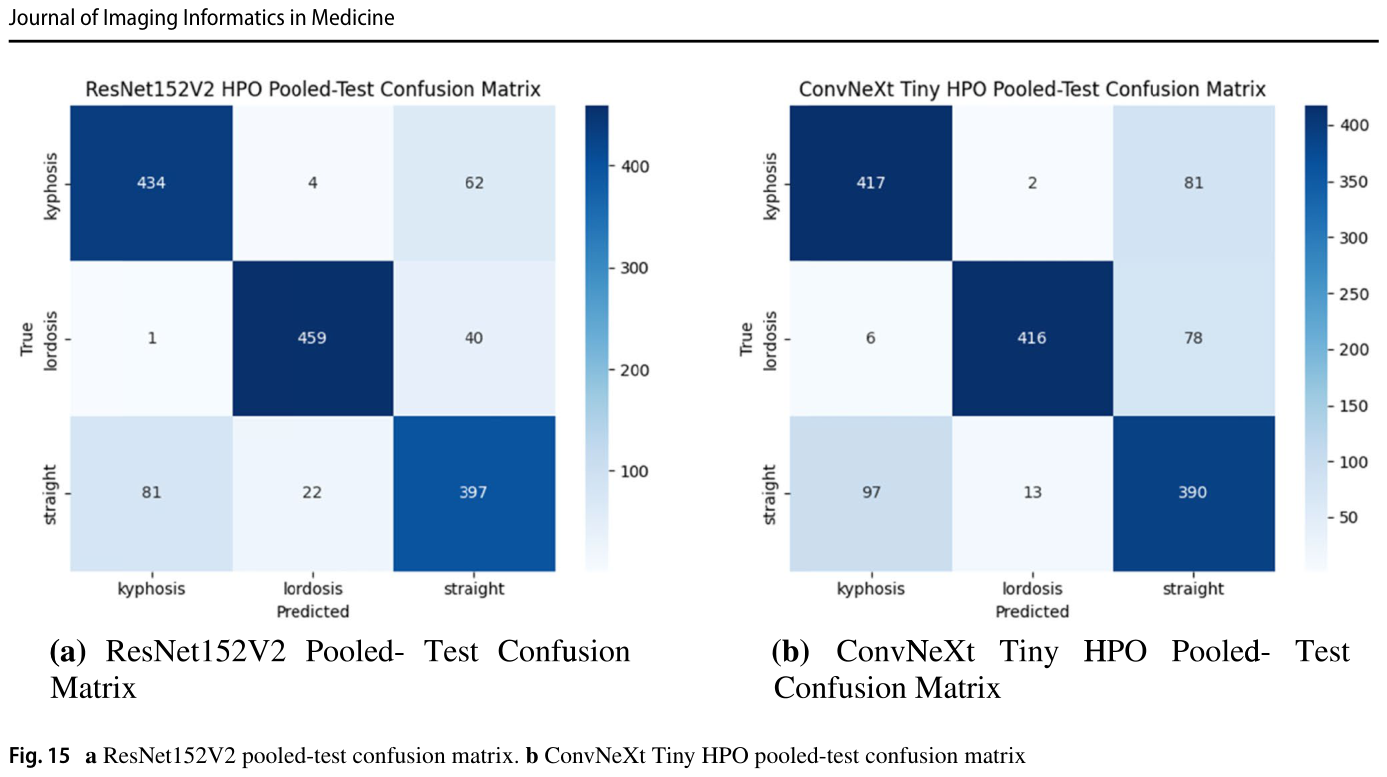
Figure 15
Figure 15. Figure 15b shows the pooled-test set confusion matrix across folds for the ConvNeXt Tiny model. Kyphosis samples were the most frequently correctly classified (417), followed by lordosis (416) and straight neck (390). The highest rate of confusion occurred when true straight neck was misclassified as kyphosis (97), followed by true kyphosis misclassified as straight neck (81), true lordosis misclassified as straight neck (78), and true straight neck misclassified as lordosis (13). Mis- classifications between the two spinal curvatures were the low- est overall, with lordosis misclassified as kyphosis only 6 times and kyphosis misclassified as lordosis only 2 times.
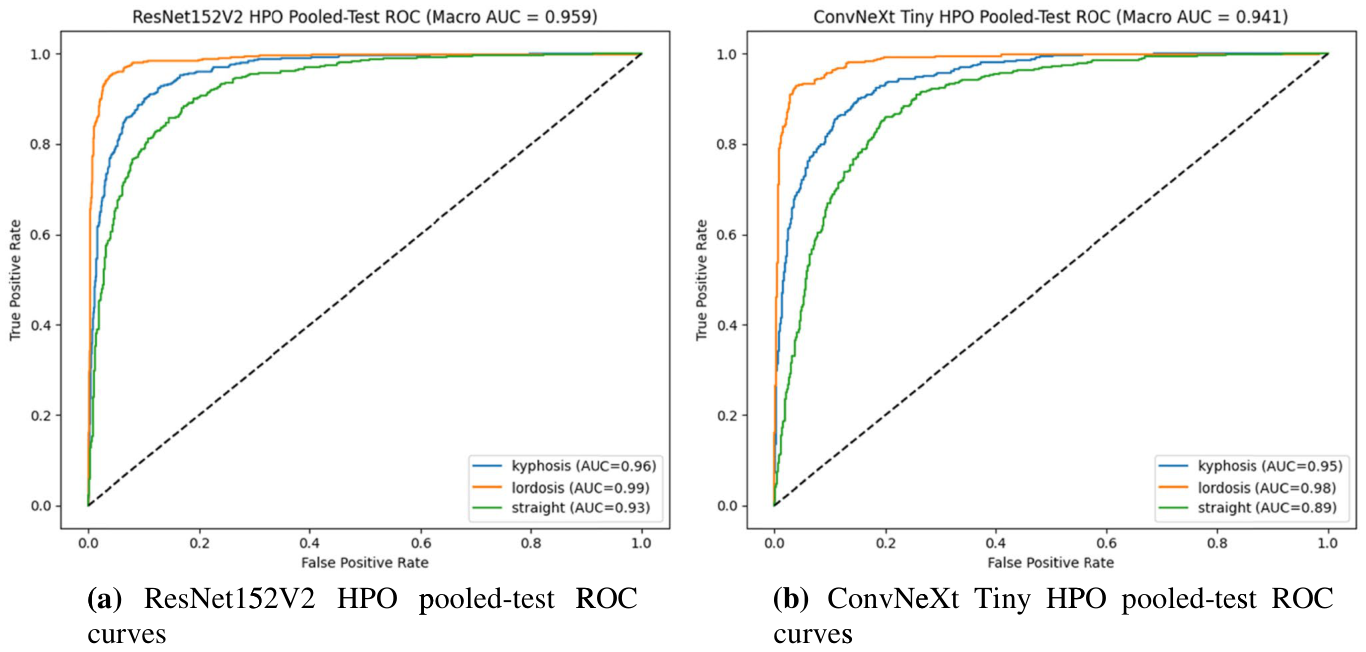
Figure 16
Figure 16. Fig. 16 a ResNet152V2 HPO pooled-test ROC curves. b ConvNeXt Tiny HPO pooled-test ROC curves
Figure 17
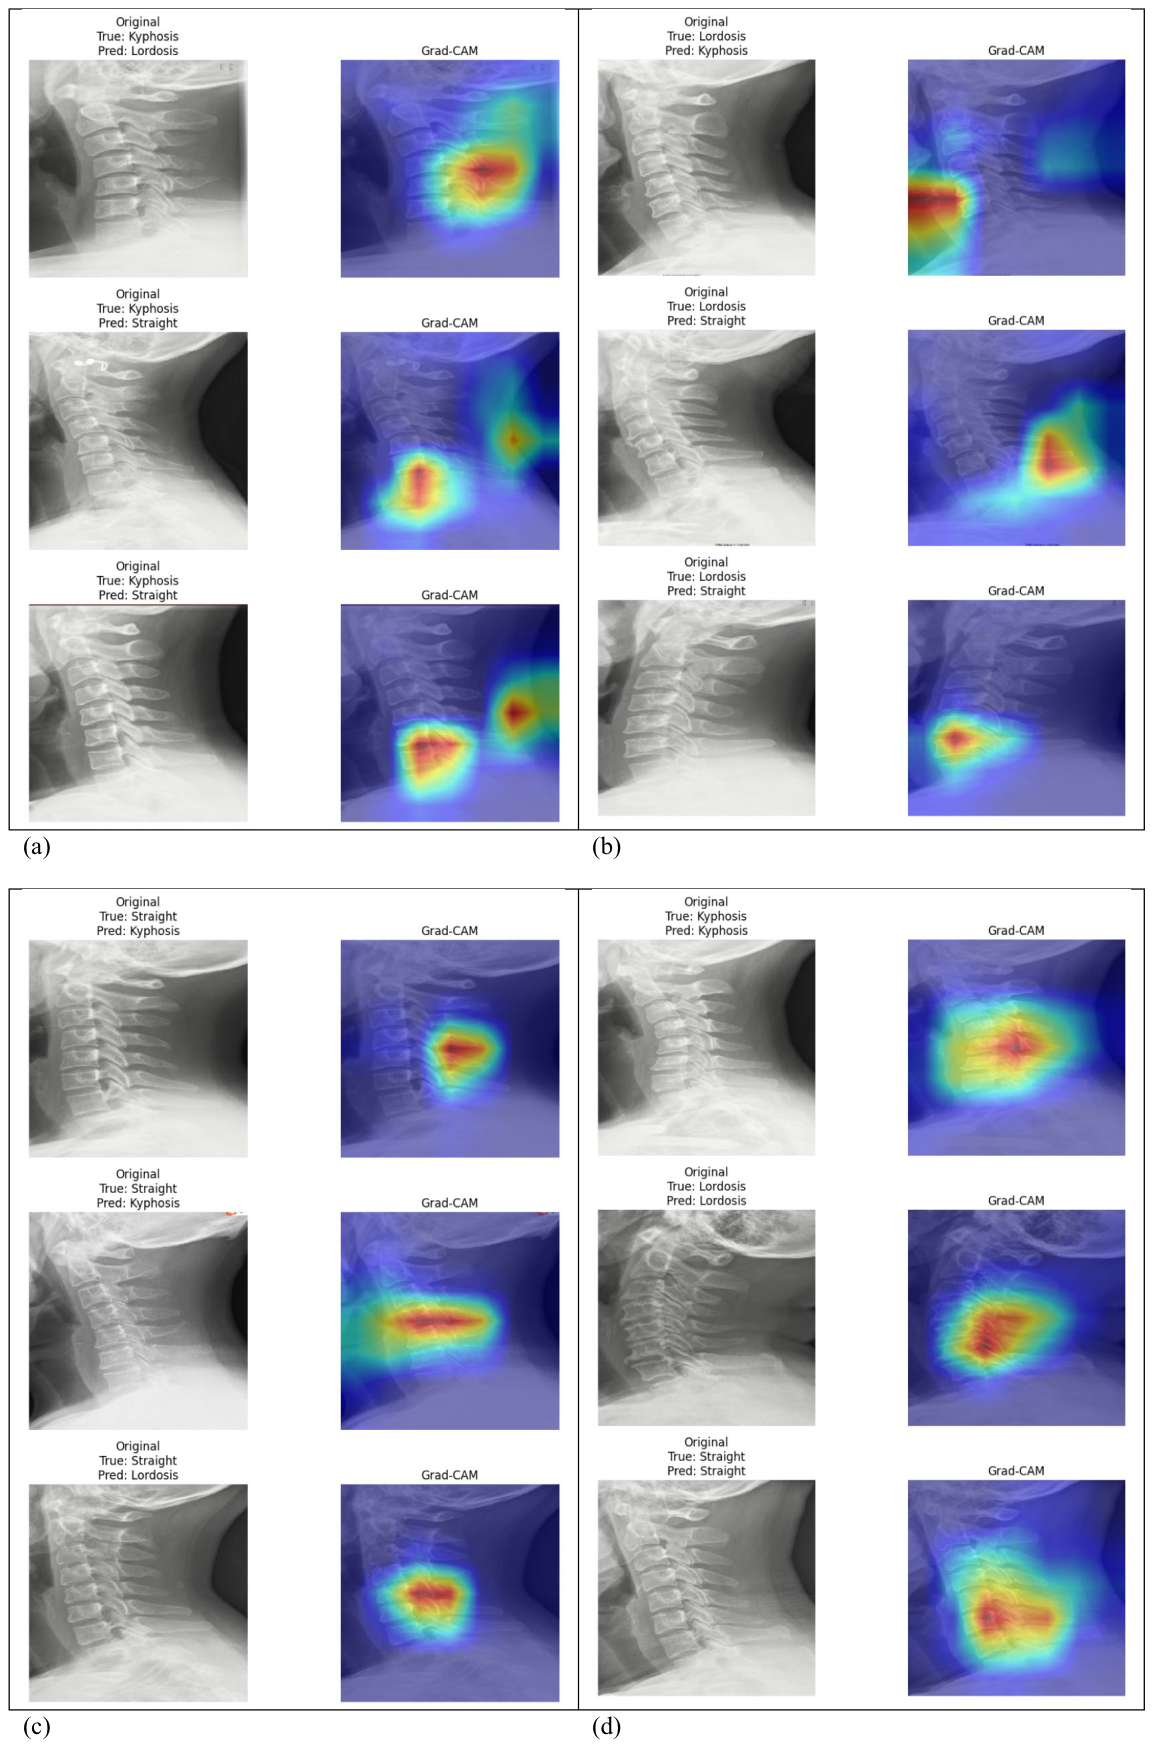
Figure 17. Fig. 17 a Misclassified images where the true label is kyphosis. b Misclassified images where the true label is lordosis. c Misclassified images where the true label is straight. d Correctly classified images
Figure 18
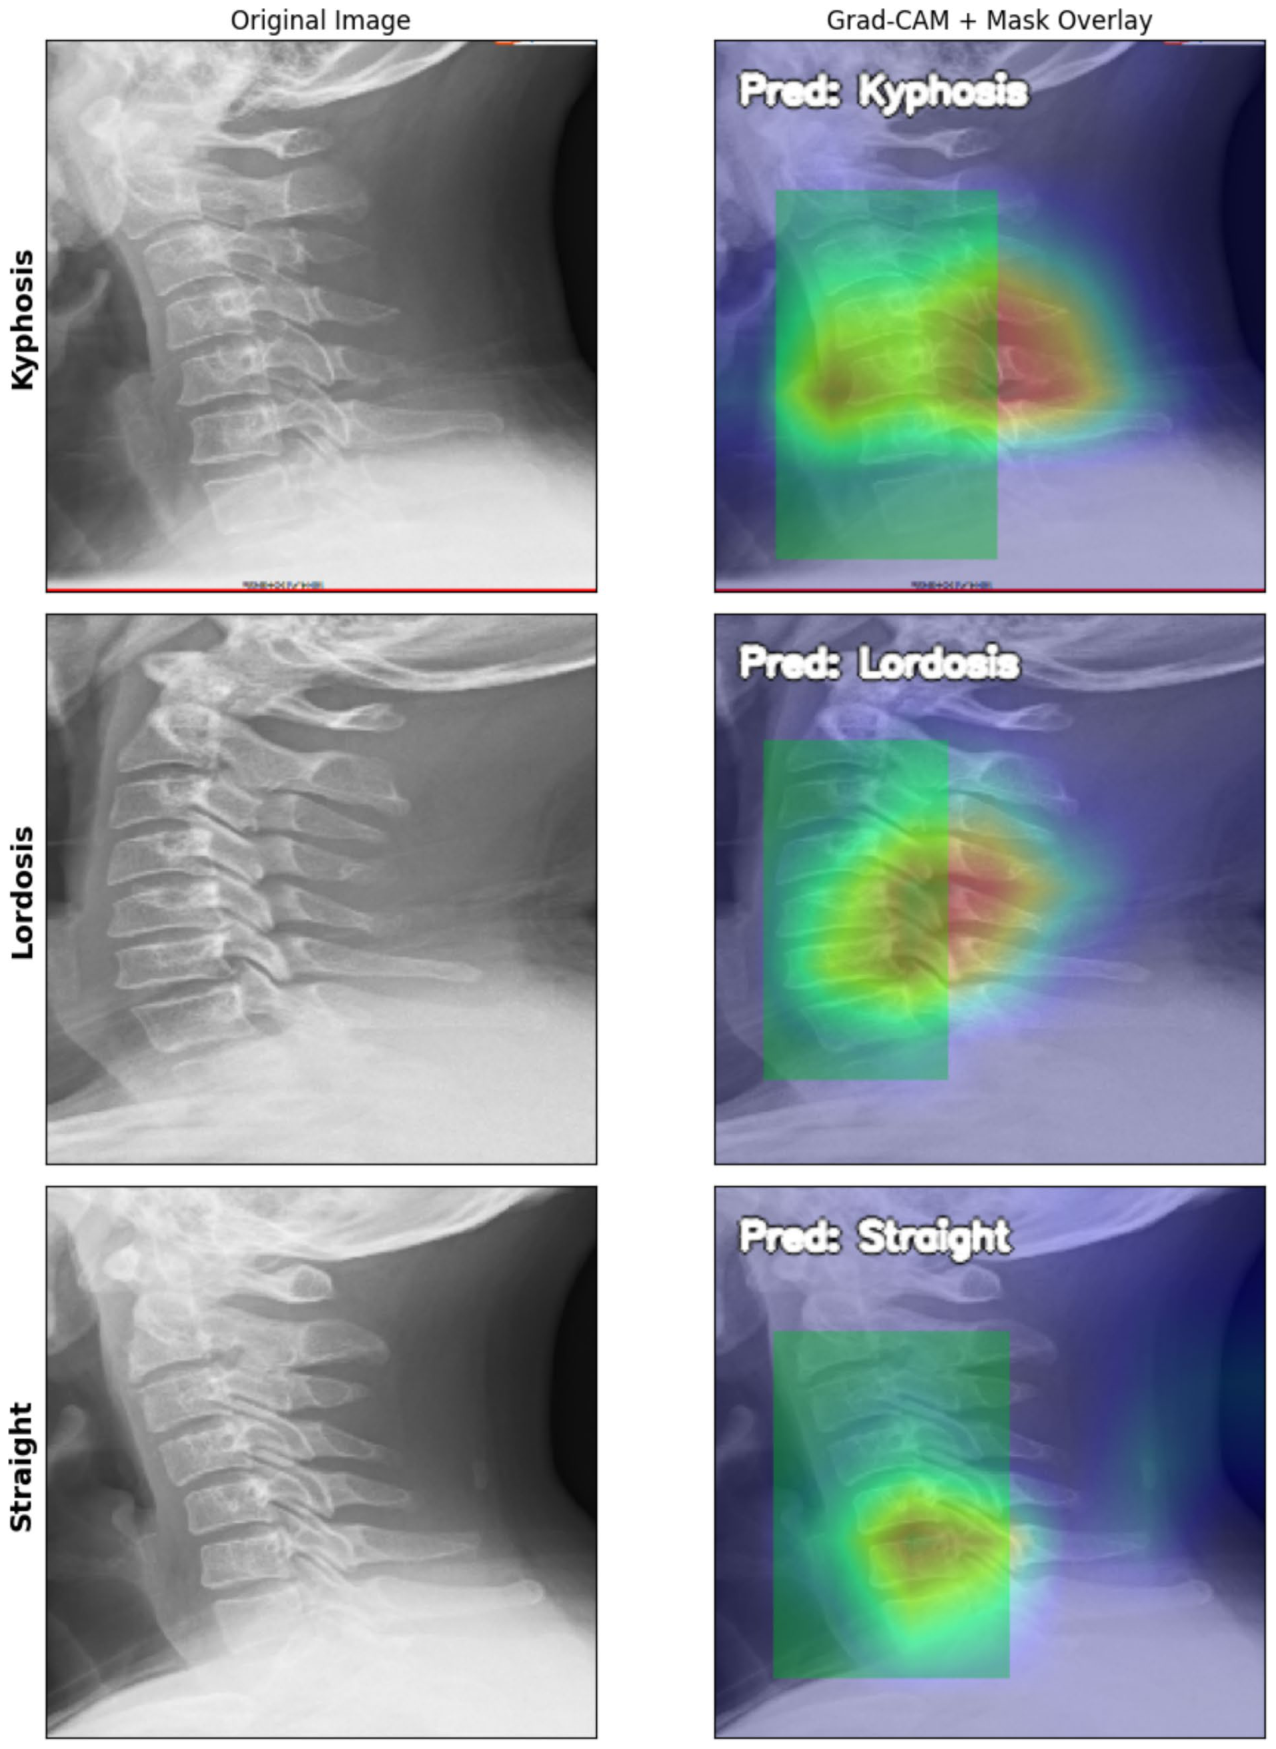
Figure 18. Fig. 18 Samples of spine ROI and Grad-Cam heatmap
Figure 20
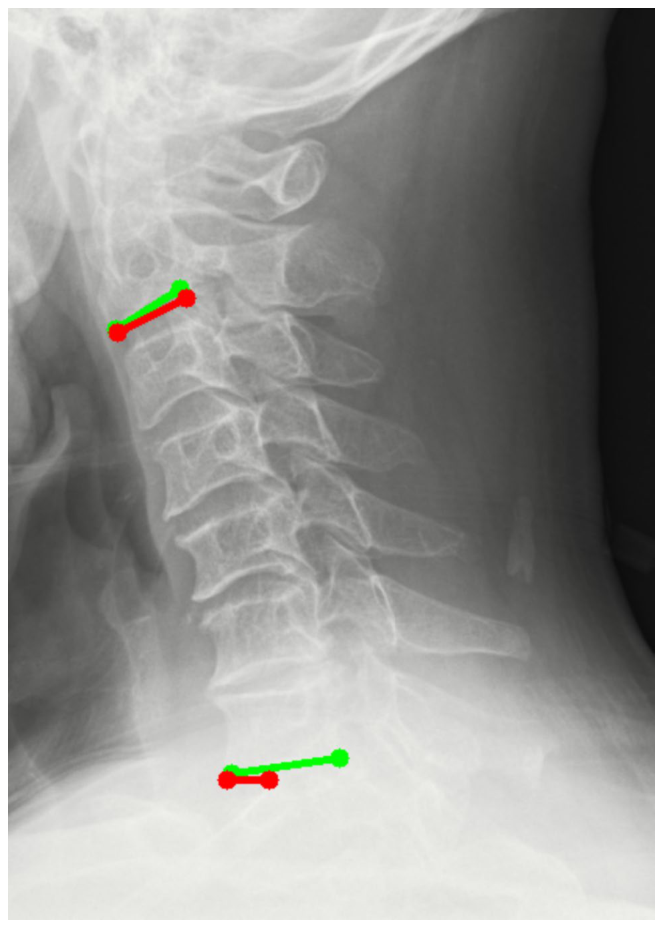
Figure 20. Fig. 20 Keypoint collapse at the C7 vertebrae. Model prediction (red) versus re-annotated reference (green) on the cropped radiograph
Figure 23
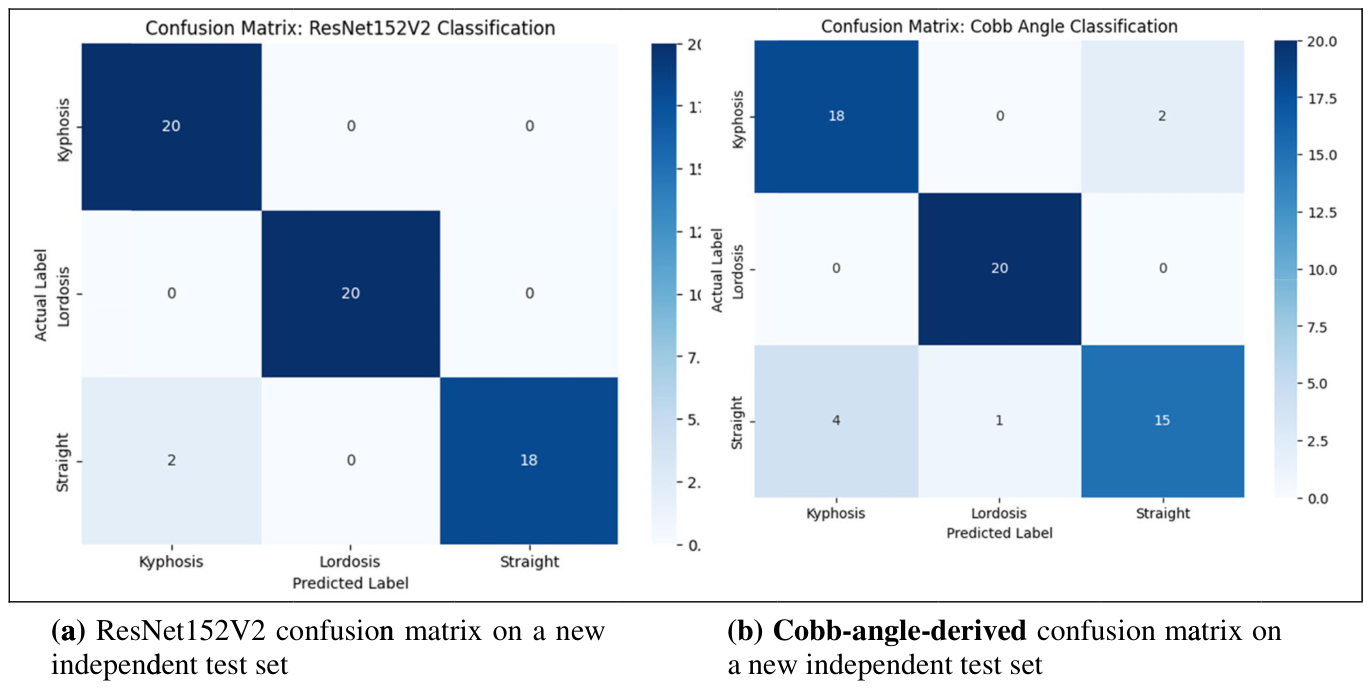
Figure 23. Fig. 23 a ResNet152V2 confusion matrix on a new independent test set. b Cobb-angle-derived confusion matrix on a new independent test set
Figure 24
Figure 24. Fig. 24 The cervical spine alignment condition website interface on PC
Table 1
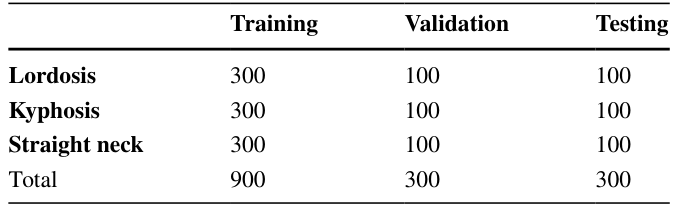
Table 1. Table 1 Stratified distribution and configuration of image partitions per iteration run (60:20:20 ratio)
Table 2
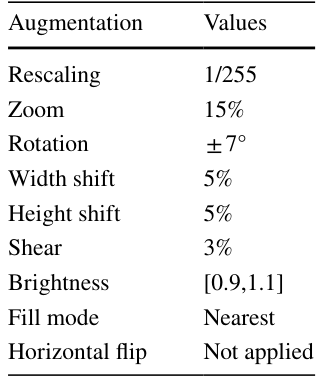
Table 2. Table 2 Image augmentation parameters for cervical spine X-ray training
Table 3
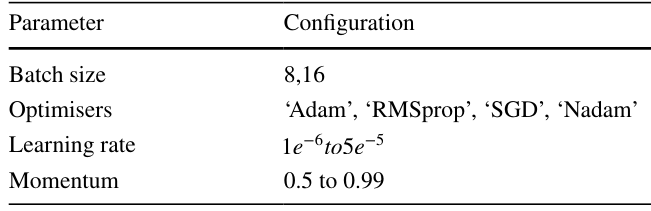
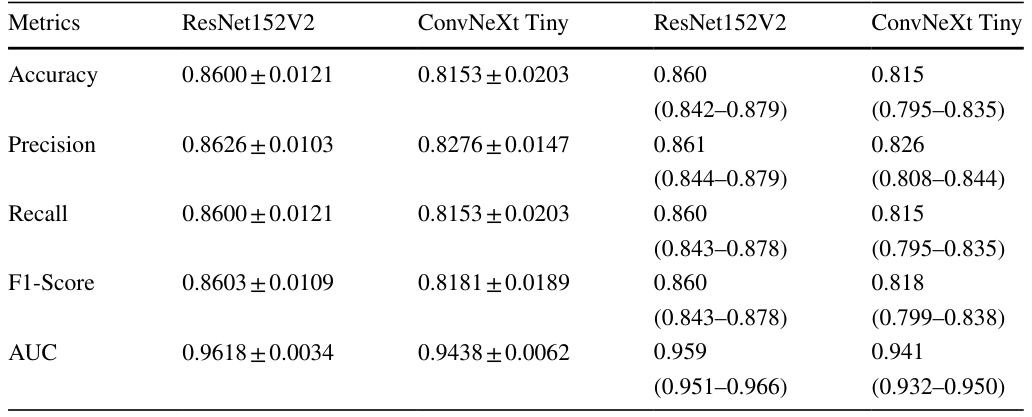
Table 3. Table 3 Training hyperparameter configurations
Table 4
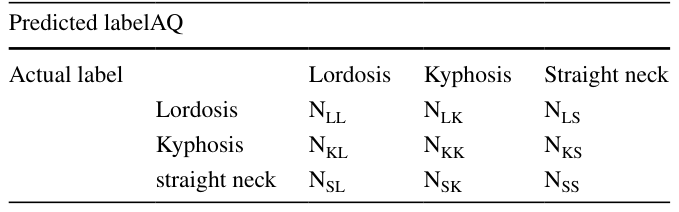
Table 4. Table 4 Confusion matrix for multi-class classification
Table 5
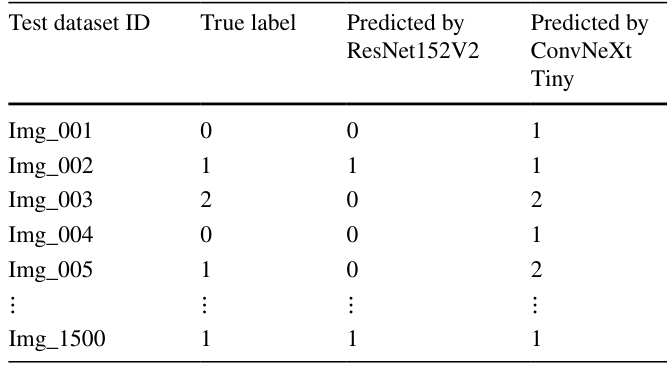
Table 5. Table 5 Pairwise alignment of predictions
Table 6
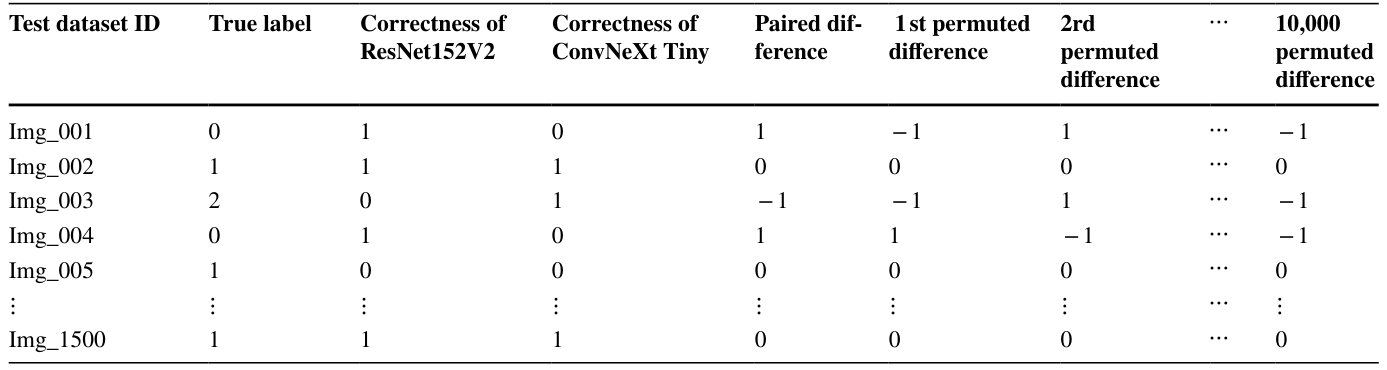
Table 6. Table 6 Pairwise alignment of correctness and permuted difference
Table 11. Table 11 The McNemar test contingency table and p-value ResNet152V2 correct (1) ResNet152V2 wrong (0)
Table 12
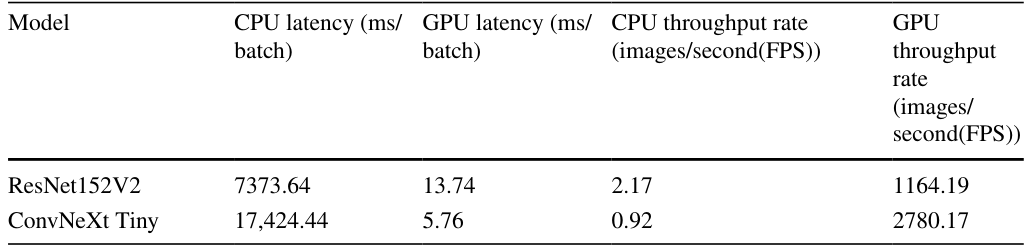
Table 12. Table 12 Latency and throughput of ResNet152 V2 and ConvNeXt Tiny on CPU and GPU
Table 13
Table 13. Table 13 ICC results Type ICC F Df1 Df2 p-value 95% CIs
Table 14
Table 14. Table 14 Percentage of cases within 3 tolerance thresholds
Table 15
Table 15. Table 15 presents the classification performance of ResNet152V2 and the Cobb angle-derived method. Over- all, ResNet152V2 achieved superior performance, with accuracies, precisions, recalls, and F1-scores of 97%, compared to 88% for the Cobb angle-based approach. For class-wise precision, ResNet152V2 achieved perfect pre- cision (1.00) for both lordosis and straight neck, while kyphosis achieved 0.91. Meanwhile, the Cobb angle-based approach achieved the highest precision for lordosis (0.95), straight neck (0.88), and kyphosis (0.82). Regarding recall, ResNet152V2 achieved 1.00 for both kyphosis and lordosis, whereas straight neck achieved 0.90. In contrast, the Cobb angle-based method achieved the highest recall for lordosis (1.00), followed by kyphosis (0.90) and straight neck (0.75). For the F1-score, ResNet152V2 achieved a perfect F1-score of 1.00 for Lordosis, while both Kyphosis and Straight Neck achieved the same F1-score of 0.95. On the other hand, the Cobb angle-derived method achieved the highest F1-score for lordosis (0.98), followed by kyphosis (0.86) and straight neck (0.81). These results indicate that ResNet152V2 con- sistently outperformed the Cobb angle-based classification
Table 16
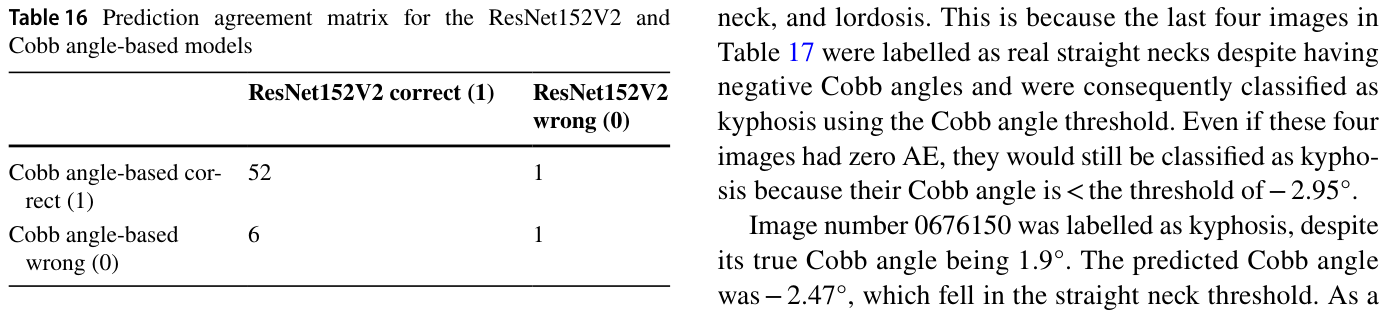
Table 16. Table 16 Prediction agreement matrix for the ResNet152V2 and Cobb angle-based models
Table 17
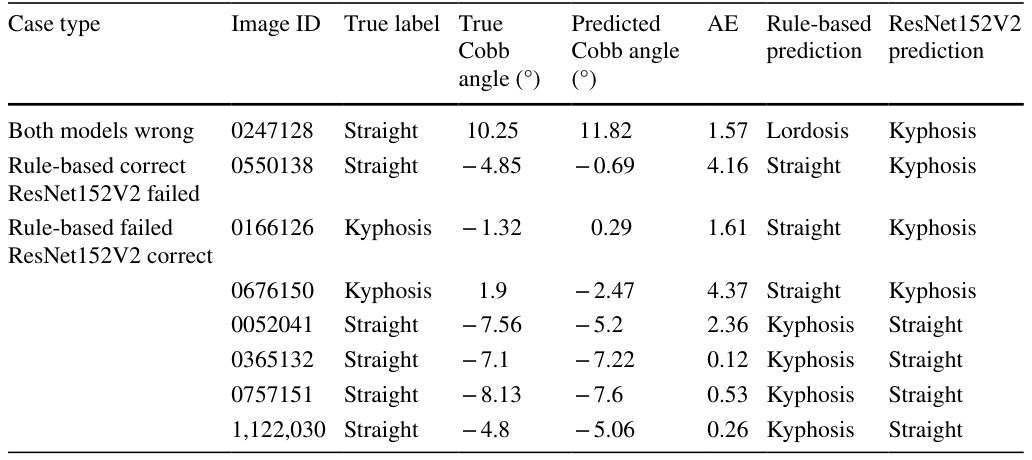
Table 17. Table 17 Analysis of edge cases and model discrepancies Case type Image ID True label True
Table 18
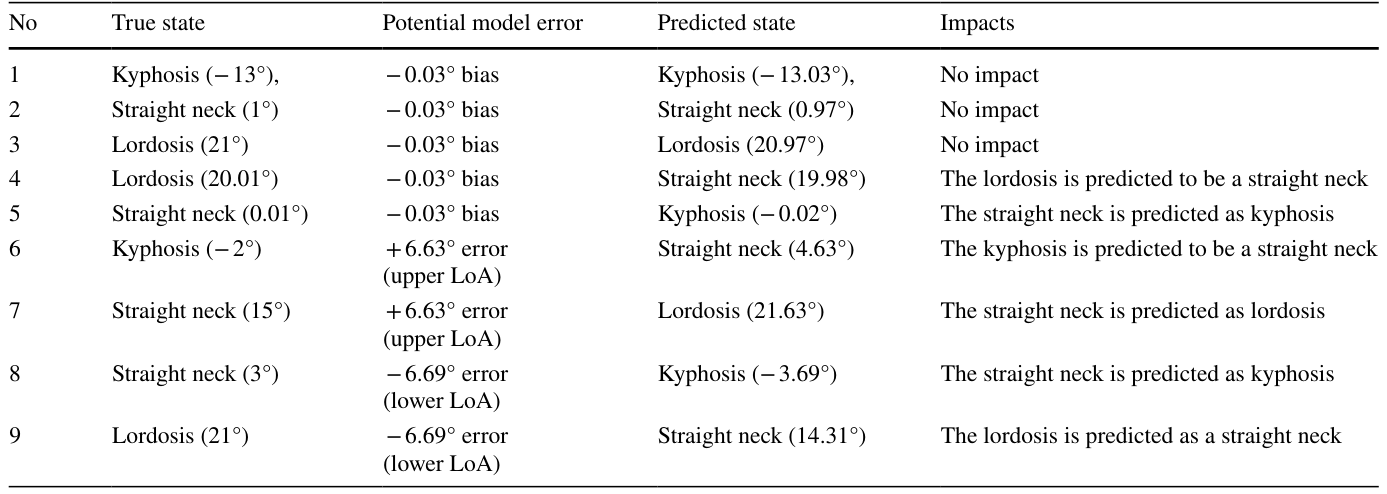
Table 18. Table 18 Sample cases influenced by potential model error







コメントを残す