どうも、Beyond the Pixelです。歩行中の筋肉活動や代謝エネルギー消費(体が活動するために消費するエネルギー量)を軽減する足首外骨格(歩行時の足首の動きを補助し、筋肉の活動やエネルギー消費を減らす外部装置)は、その有効性が広く認識されています。しかし、最適なアシストレベルに関する実験研究とシミュレーション研究の間には、長年にわたる不一致が存在します。実験では、生物学的な足首底屈モーメント(足首を足の裏側に曲げる動きを生み出す力)の約40~60%のサブ最大アシストが最大の代謝改善をもたらすことが一貫して示されています。一方、快適さやバランスなどの要因を考慮しない逆筋骨格シミュレーション(既知の体の動きから、それを生み出す筋肉の力や活動を計算するシミュレーション手法)では、最適なアシストレベルは実験よりも高い値、例えば70~80%と予測されます。なぜこのようなサブ最大アシストが最適なのか、そしてなぜシミュレーションが実験値を過大評価するのか、その生体力学的メカニズムはこれまで十分に解明されていませんでした。本研究では、この疑問に答えるため、歩行の逆シミュレーションを用いて、筋肉・腱のダイナミクス、代謝パワー、足首関節スティフネス(関節の動きに対する抵抗の度合いを示す指標)を系統的に検証しました。これにより、シミュレーションと実験の間のギャップを埋める新たな知見が得られました。
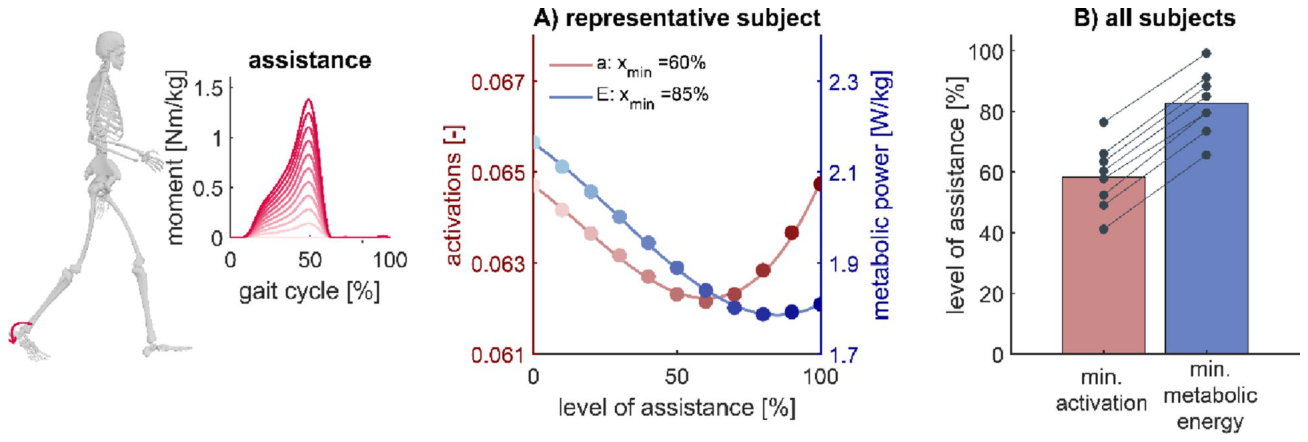
Figure 1. Fig. 1 Submaximal assistance resulted in the largest reductions in average muscle activity and metabolic power. Values across levels of assistance in a representative subject (A) and optimal levels of assistance in all subjects (B). Each dot represents an individual subject in plot B解説: この図は、代表的な対象者(A)および全対象者(B)において、外骨格アシストレベルが平均的な筋肉活動と代謝パワーに与える影響を示しています。サブ最大アシストがこれらの値を最も大きく減少させることを表しています。
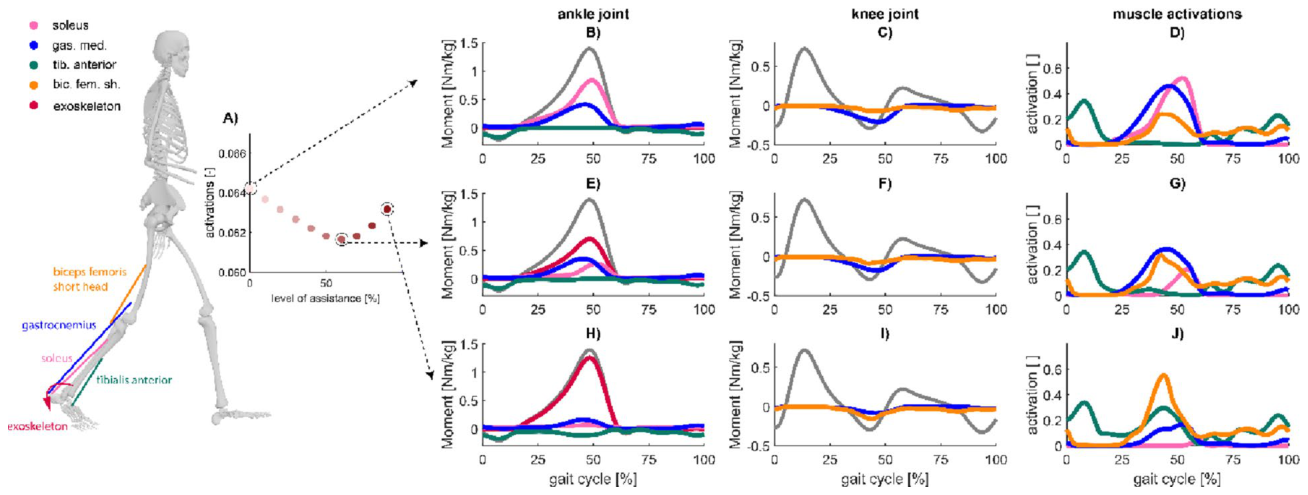
Figure 2. Fig. 2 Changes in muscle moments and activations. Submaximal assistance resulted in the largest reductions in average muscle activations, as shown in a representative subject (A). Joint and muscle moments at the ankle (B, E, and H) and knee joints (C, F, and I) and muscle activations (D, G, and J) dur ing walking with 0, 60, and 90% of the maximum level of assistance for one representative subject. Muscle moments of soleus (pink line), gastrocnemius medialis (blue line), tibialis anterior (green line), and biceps femoris short head (orange line) spanning the ankle and knee joint, and exoskeleton moment (red line) were shown解説: この図は、代表的な対象者における足首関節と膝関節の筋モーメント、および筋肉活動の変化を示しています。アシストレベルが最大レベルの0%、60%、90%の場合の、各筋肉(ヒラメ筋、腓腹筋、脛骨前筋、大腿二頭筋短頭)の貢献と外骨格モーメントを示しています。
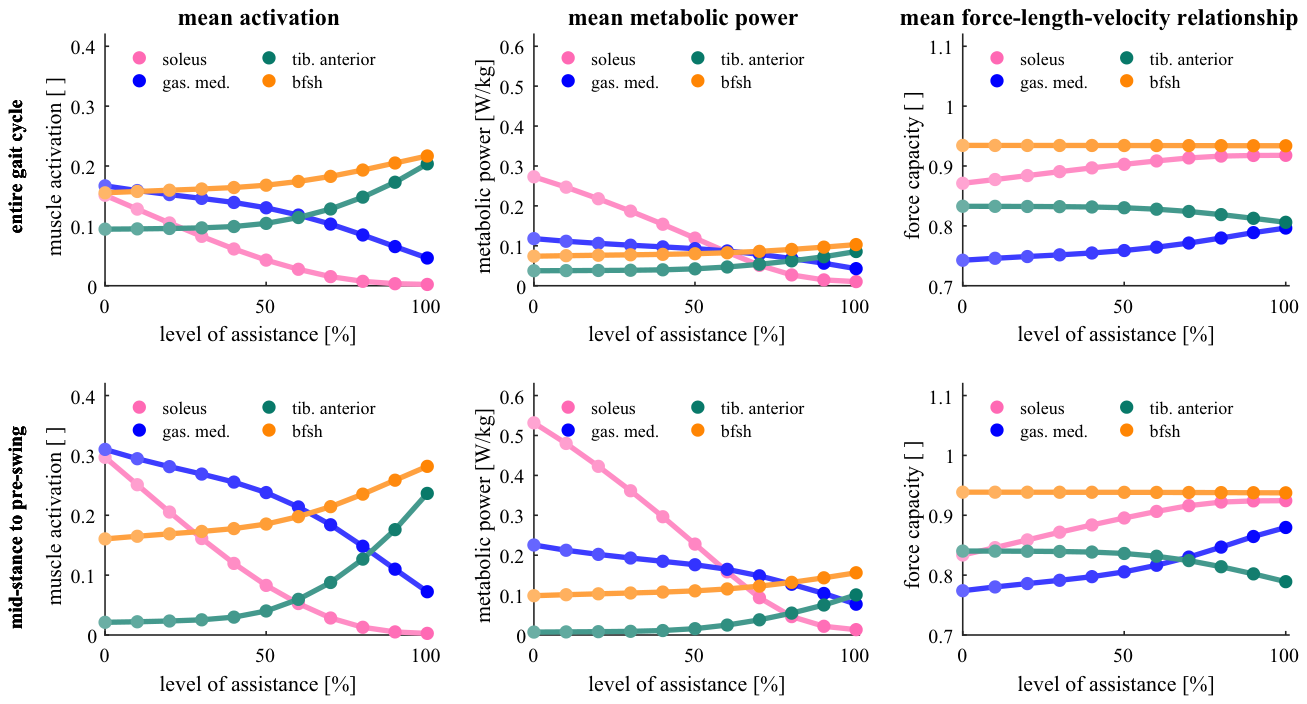
Figure 3. Fig. 3 Mean muscle activations, metabolic rates, and force-length-velocity relationship of soleus, gastrocnemius medialis, tibialis anterior, and biceps femoris short head (bfsh) muscles across levels of assistance. Mean values were computed with respect to the entire gait cycle (upper row) and mid- stance to pre-swing phase, 12 to 62% of the gait cycle. The force-length-velocity relationship represents the active force generation capacity of the muscle, computed as the product of the force-length and force-velocity relationship. Average values were computed among all subjects解説: この図は、アシストレベルに応じたヒラメ筋、腓腹筋、脛骨前筋、大腿二頭筋短頭の平均筋肉活動、代謝率、および力-長さ-速度関係を示しています。これらの平均値は、全歩行サイクル(上段)と立脚中期から前遊脚期(下段)で計算されています。
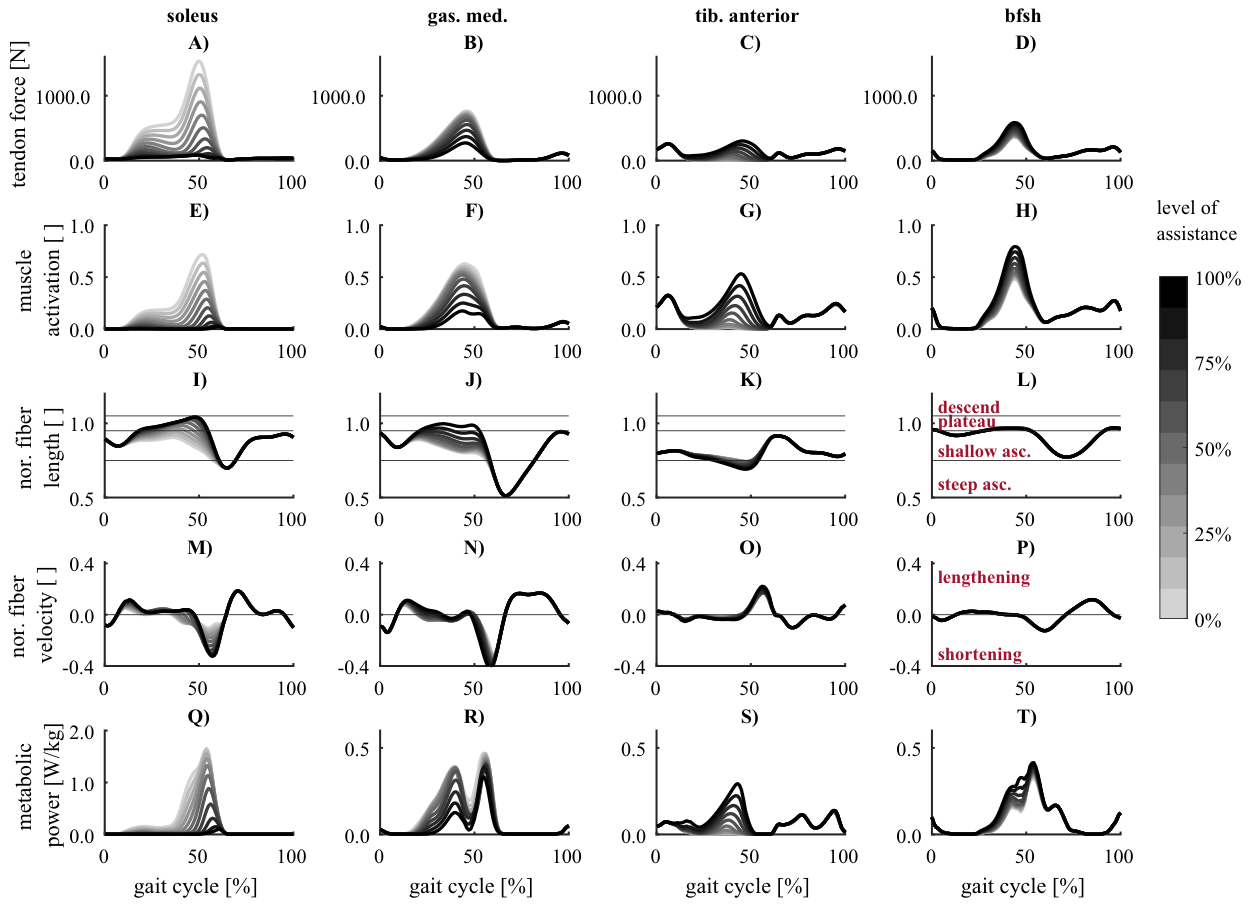
Figure 4. Fig. 4 Exoskeleton assistance influences muscle activations, states, and metabolic power. Tendon force, muscle activation, normalized fiber length, nor malized fiber velocity, and metabolic power of soleus, gastrocnemius medialis (gas. med.), tibialis anterior (tib. anterior), and biceps femoris short head (bfsh) across levels of assistance. Average values computed among all subjects解説: この図は、アシストレベルがヒラメ筋、腓腹筋、脛骨前筋、大腿二頭筋短頭の腱力、筋肉活動、正規化された繊維長、正規化された繊維速度、および代謝パワーに与える影響を示しています。これらの値は全対象者の平均値です。
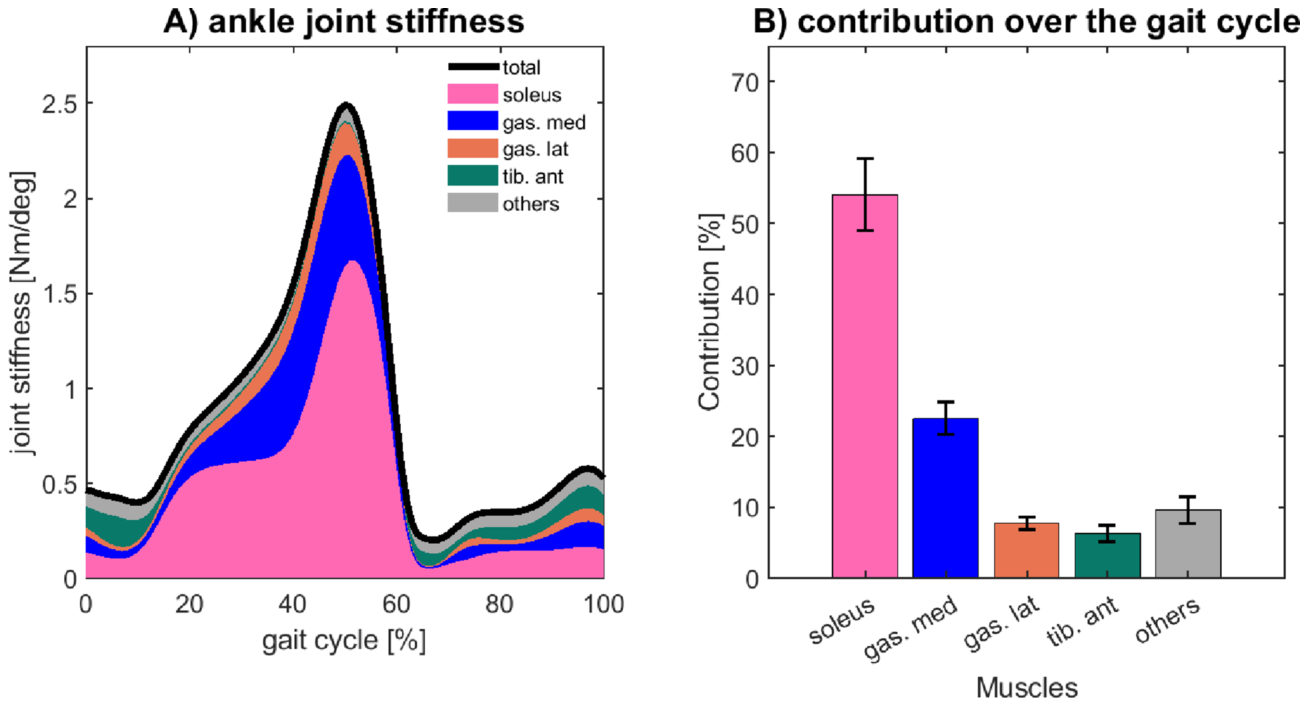
Figure 6. Fig. 6 Ankle joint stiffness and contribution of major muscles in unassisted conditions. Time series of the ankle joint stiffness and the major muscles around the ankle (A) and the percentage contribution of individual muscles around the ankle (B). Average values computed among all subjects. Vertical bar at each muscle represents one standard deviation in plot B解説: この図は、アシストがない状態での足首関節スティフネス(A)と、主要な筋肉の寄与(B)の時間経過を示しています。足首関節周辺の総スティフネスと、各筋肉(ヒラメ筋、腓腹筋、脛骨前筋など)がスティフネスにどれだけ貢献しているかを表しています。
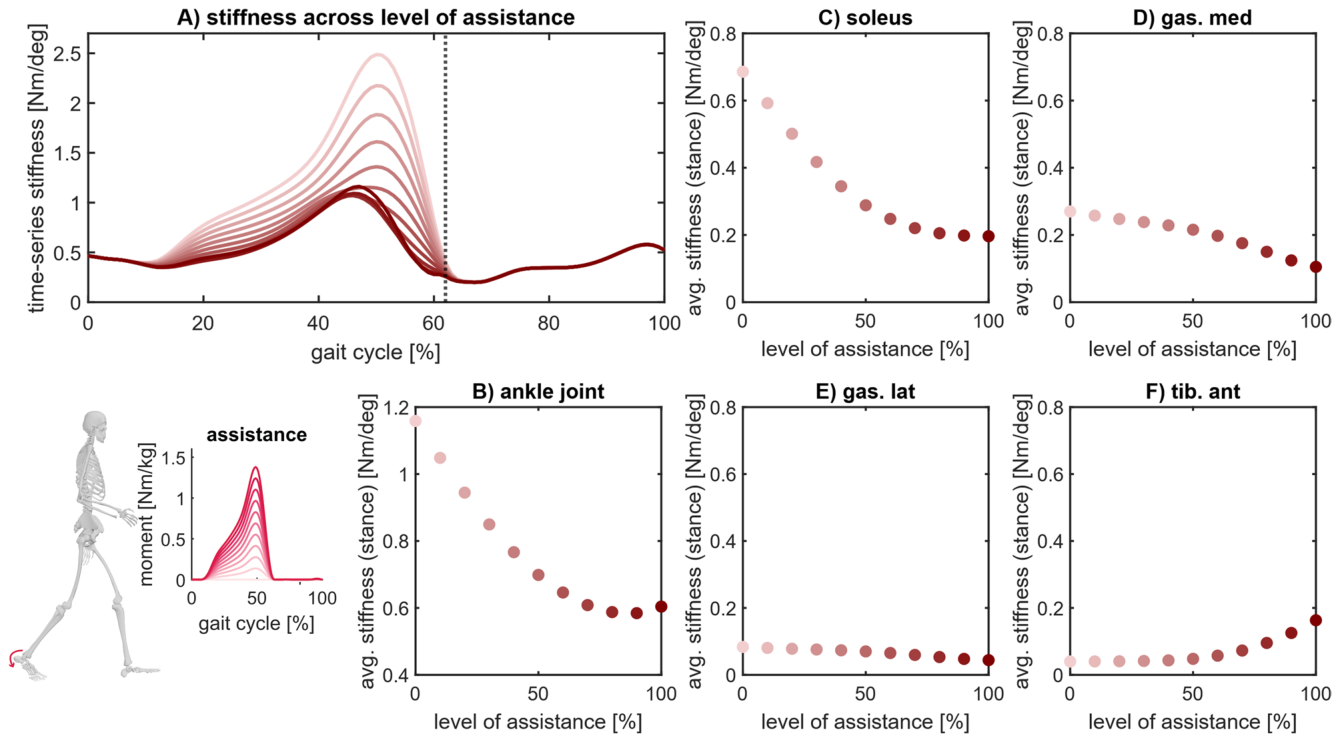
Figure 7. Fig. 7 Ankle and muscle joint stiffness across the level of assistance. Time series ankle joint stiffness across levels of assistance (A), and mean values, over the stance phase, of the ankle joint stiffness (B), soleus (C), gastrocnemius medialis (D), gastrocnemius lateralis (E), and tibialis anterior (F). Average values computed among all subjects解説: この図は、アシストレベルに応じた足首関節と筋肉の関節スティフネスの変化を示しています。足首関節スティフネスの時間経過(A)と、立脚相中の平均値(B)、およびヒラメ筋(C)、腓腹筋(D)、脛骨前筋(F)など各筋肉の平均スティフネスの変化(C, D, E, F)を表しています。


コメントを残す