どうも、Beyond the Pixelです。手足の切断後に、まるで失われた手足がまだそこにあるかのように感じる「幻肢」という現象は広く知られています。その中でも特に苦痛を伴うのが「幻肢痛(Phantom Limb Pain; PLP)」です。切断された手足が焼けるような、あるいは締め付けられるような痛みとして表現され、その原因は未だ完全に解明されていませんが、手足の喪失後に脳内で生じる適応不全な神経可塑的変化、すなわち脳の再編成が関連していると考えられています。PLPは対象者さんの生活の質を著しく低下させる深刻な状態であり、これまでの多くの治療法が効果不十分であるという課題を抱えていました。特に、片側の上肢切断を経験した人々では、PLPの有病率は30〜60%にも上ると報告されています。
脳の左右バランスの乱れに着目した新たなアプローチ
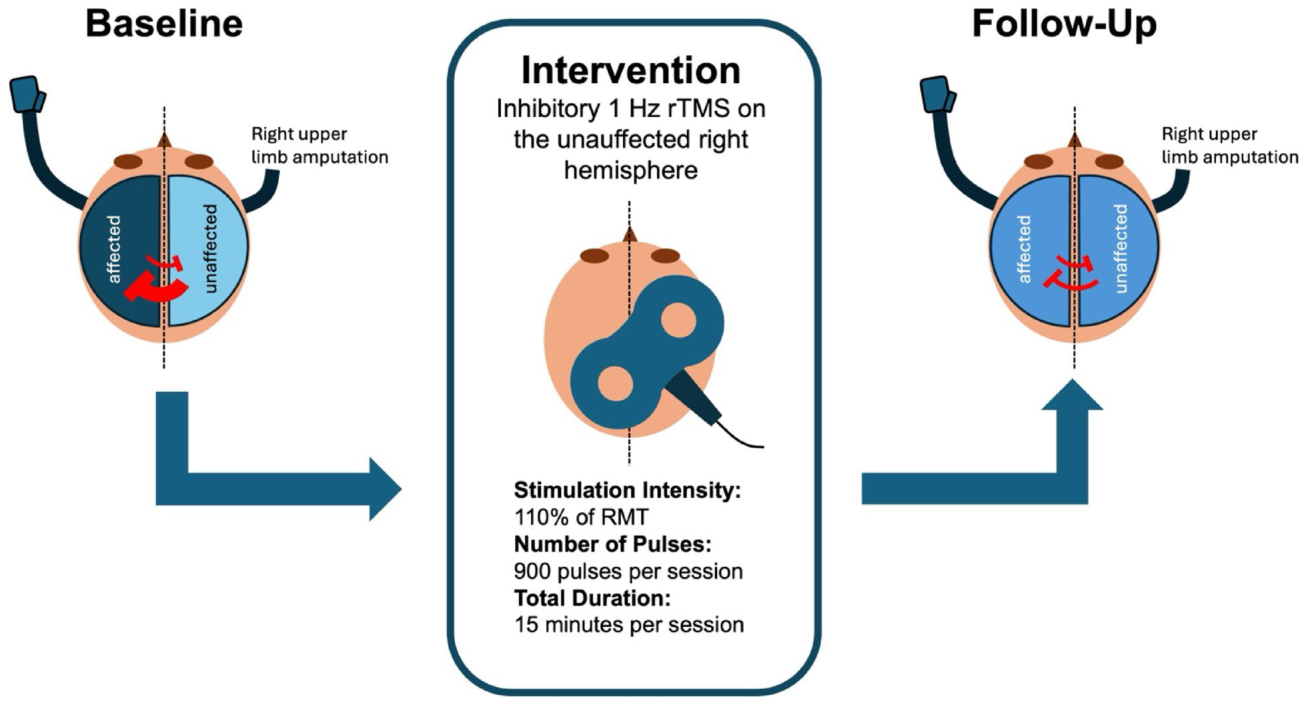
これまでの神経調節アプローチでは、主に切断された手足に対応する脳の反対側(対側)の運動野を標的とするのが一般的でした。しかし、近年、PLPの中心的病態生理学的特徴として「両半球間の不均衡」、つまり脳の左右の運動野間のバランスの乱れが注目されています。健康な状態では、左右の一次運動野(M1)は脳梁を介した抑制回路によってダイナミックな平衡状態を保っています。しかし、片側の上肢を失うことで、このバランスが崩れ、患側の運動野における残存肢の運動表現領域が拡大し、健側にも変化が生じることが報告されています。この研究では、この左右のバランスの乱れを是正することを目指し、これまでとは異なるアプローチを試みました。それは、抑制性の反復経頭蓋磁気刺激(repetitive transcranial magnetic stimulation; rTMS)を、患側ではなく「同側(健側)」の運動野に適用するというものです。
Table 1. Table 1 Baseline demographic and clinical characteristics participant Age (years) Months since amputation解説: 参加者のベースライン時の人口統計学的および臨床的特性を示しています。参加者1は36歳で切断後6ヶ月、参加者2は23歳で切断後18ヶ月です。
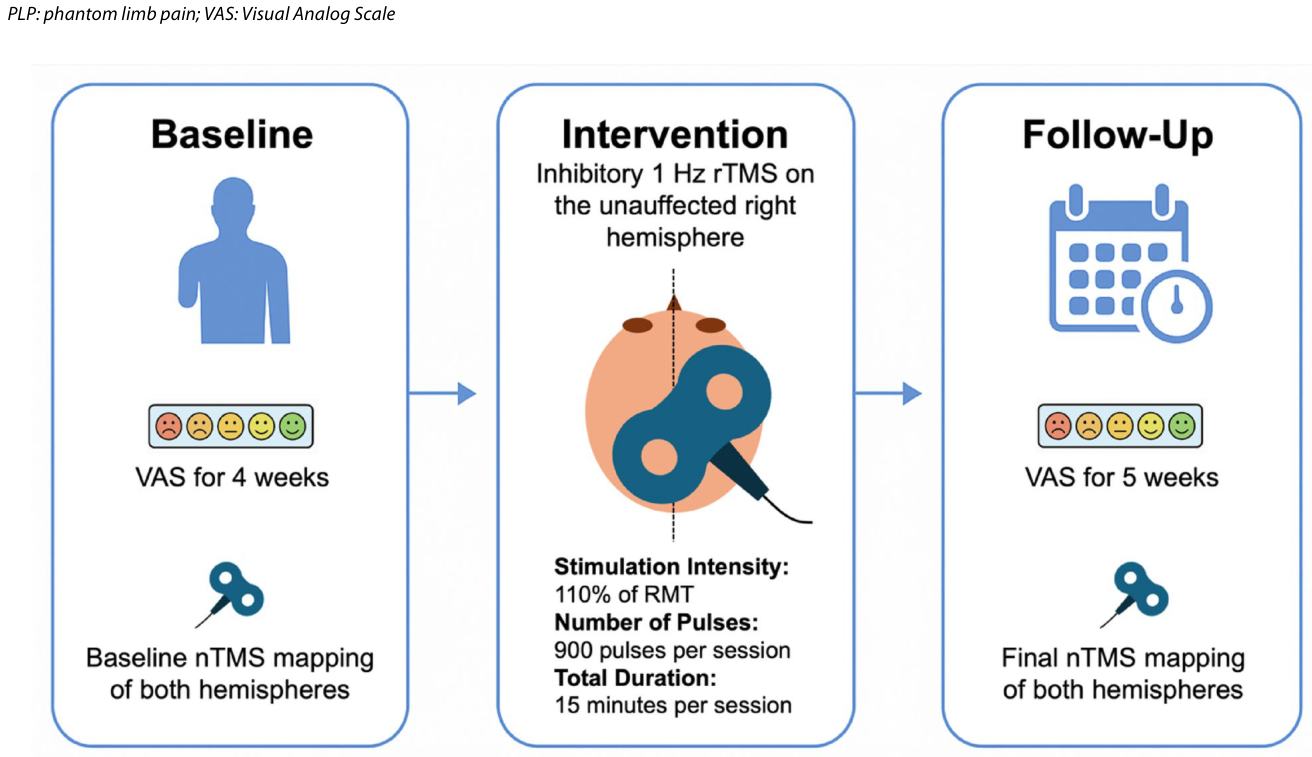
研究は3つの段階で構成されました。まず、4週間のベースライン期間中に、両半球のナビゲーション経頭蓋磁気刺激(navigated Transcranial Magnetic Stimulation; nTMS)による運動マッピングと週ごとのVAS(Visual Analog Scale)痛覚評価が行われました。次に、介入期間として、同側(健側、右)の運動皮質を標的とした抑制性の1Hz rTMSが実施されました。そして、5週間の追跡調査期間中に、毎日VAS評価と介入後のnTMSマッピングが行われました。この研究デザインの概要は
Figure 1. Fig. 1 Study design. Three sequential phases: (1) four-week baseline with bilateral nTMS mapping and weekly VAS assessment; (2) rTMS intervention ap plying inhibitory 1 Hz stimulation (900 pulses per session) to the ipsilateral (unaffected) M1; (3) five-week follow-up with daily VAS and post-intervention bilateral nTMS mapping. nTMS: Navigated transcranial magnetic stimulation; VAS: Visual Analog Scale; M1: Primary motor cortex; rTMS: Repetitive transcra nial magnetic stimulation解説: 本研究の実験デザインを示しています。研究は、4週間のベースライン期間、同側(健側)M1への抑制性1Hz rTMSによる介入期間、そして5週間の追跡調査期間の3段階で構成されています。
Figure 2. Fig. 2 Hypothesized callosal disinhibition mechanism. Schematic illustrating baseline interhemispheric imbalance, with excessive inhibitory drive di rected from the unaffected toward the affected hemisphere, and the proposed effect of ipsilateral inhibitory rTMS in reducing this inhibitory drive and permitting consolidation of the affected hemisphere’s motor representation. M1: Primary motor cortex; rTMS: Repetitive transcranial magnetic stimulation解説: 仮説とされる脳梁介在性脱抑制メカニズムの概要図です。ベースラインでは、健側から患側半球への過剰な抑制が見られ、同側抑制性rTMSがこの抑制を軽減し、患側半球の運動表現の統合を可能にすると考えられています。
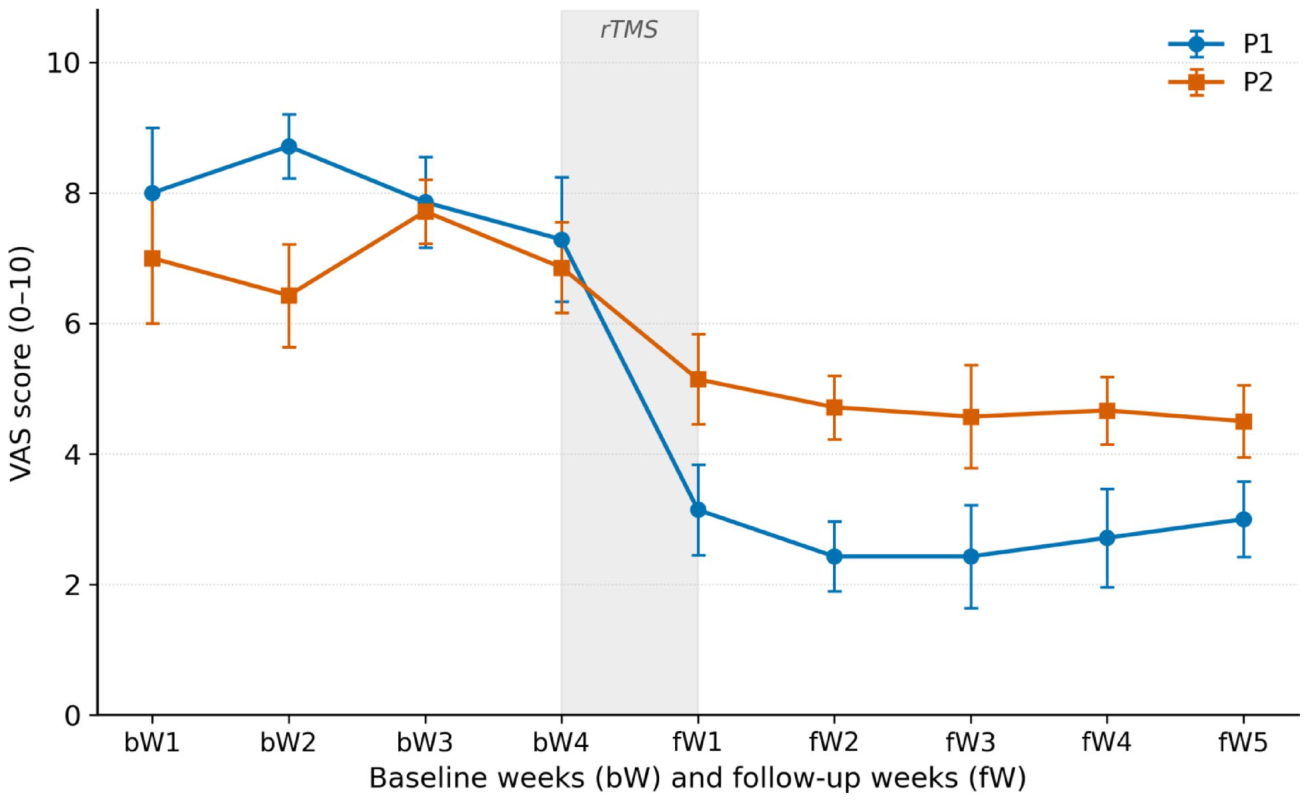
Figure 3. Fig. 3 Averaged weekly VAS scores during baseline and follow-up. Weekly averages of daily self-reported VAS scores for P1 and P2 during baseline weeks (bW1–bW4) and follow-up weeks (fW1–fW5). VAS: Visual Analog Scale; P1: Participant 1; P2: Participant 2; rTMS: Repetitive transcranial magnetic stimulation解説: ベースライン期間と追跡調査期間中の、参加者1(P1)と参加者2(P2)の週ごとのVASスコア平均値を示しています。rTMS介入後に両参加者でVASスコアの減少が見られます。
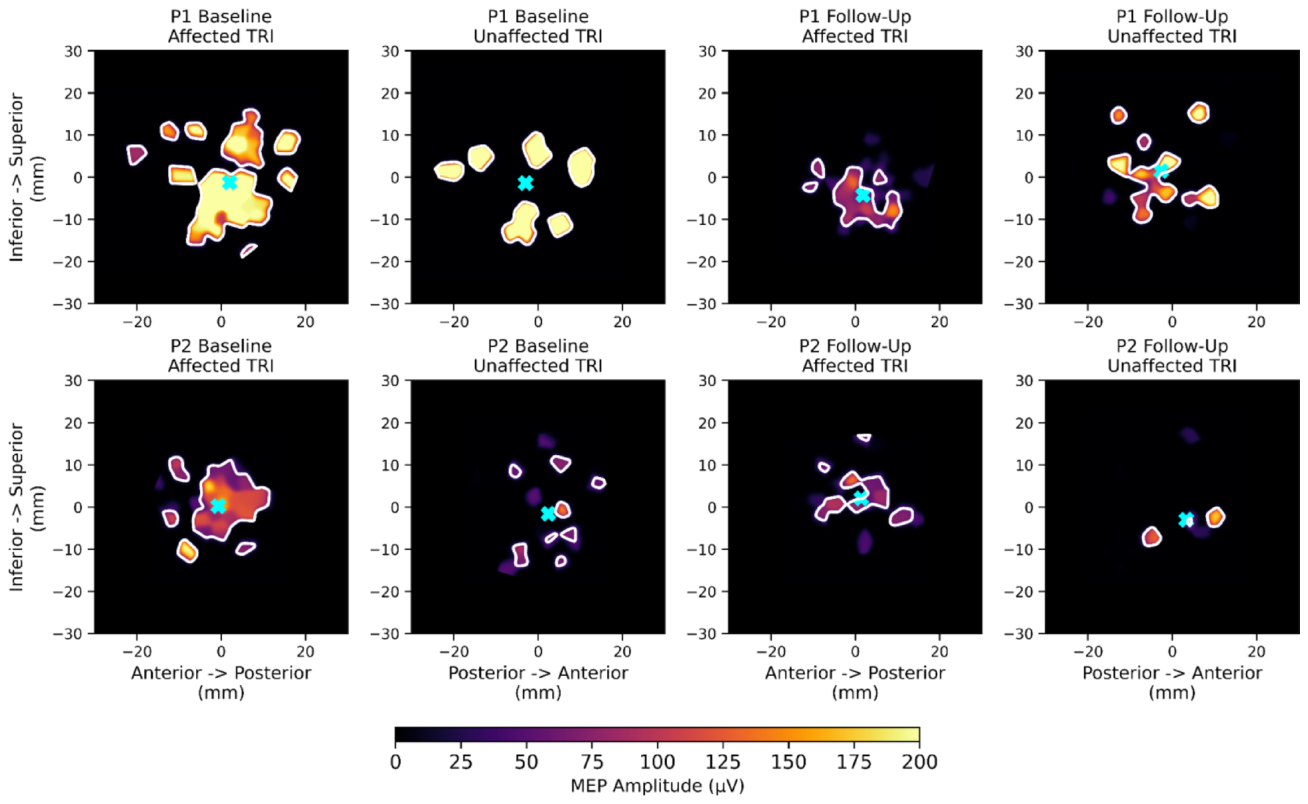
Figure 6. Fig. 6 Interhemispheric comparison of triceps activation maps. Affected and unaffected hemisphere triceps maps displayed side-by-side for each par ticipant at baseline and follow-up. Convergence of cortical excitability reflects normalization of interhemispheric asymmetry after rTMS解説: 患側と健側の半球における上腕三頭筋の活動マップを、ベースライン時と追跡調査時で参加者ごとに並べて表示しています。rTMS後に両半球間の皮質興奮性の収束(非対称性の正常化)が確認されます。
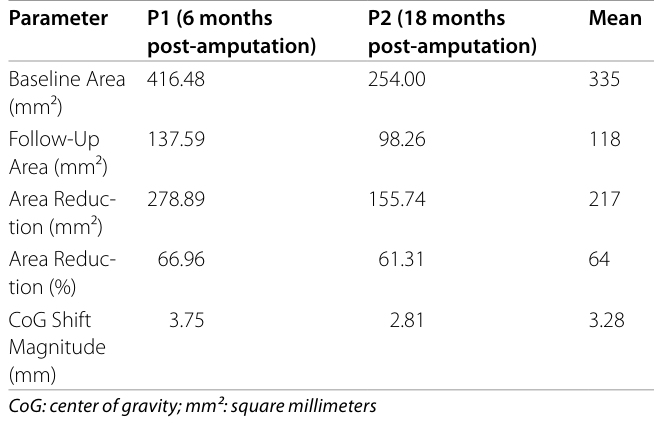
Table 2. Table 2 Triceps representation in the affected (left) hemisphere Parameter P1 (6 months post-amputation)解説: 患側(左)半球における上腕三頭筋の表現領域(mm²)、領域減少率(%)、重心(CoG)シフトの大きさを参加者ごとに示しています。
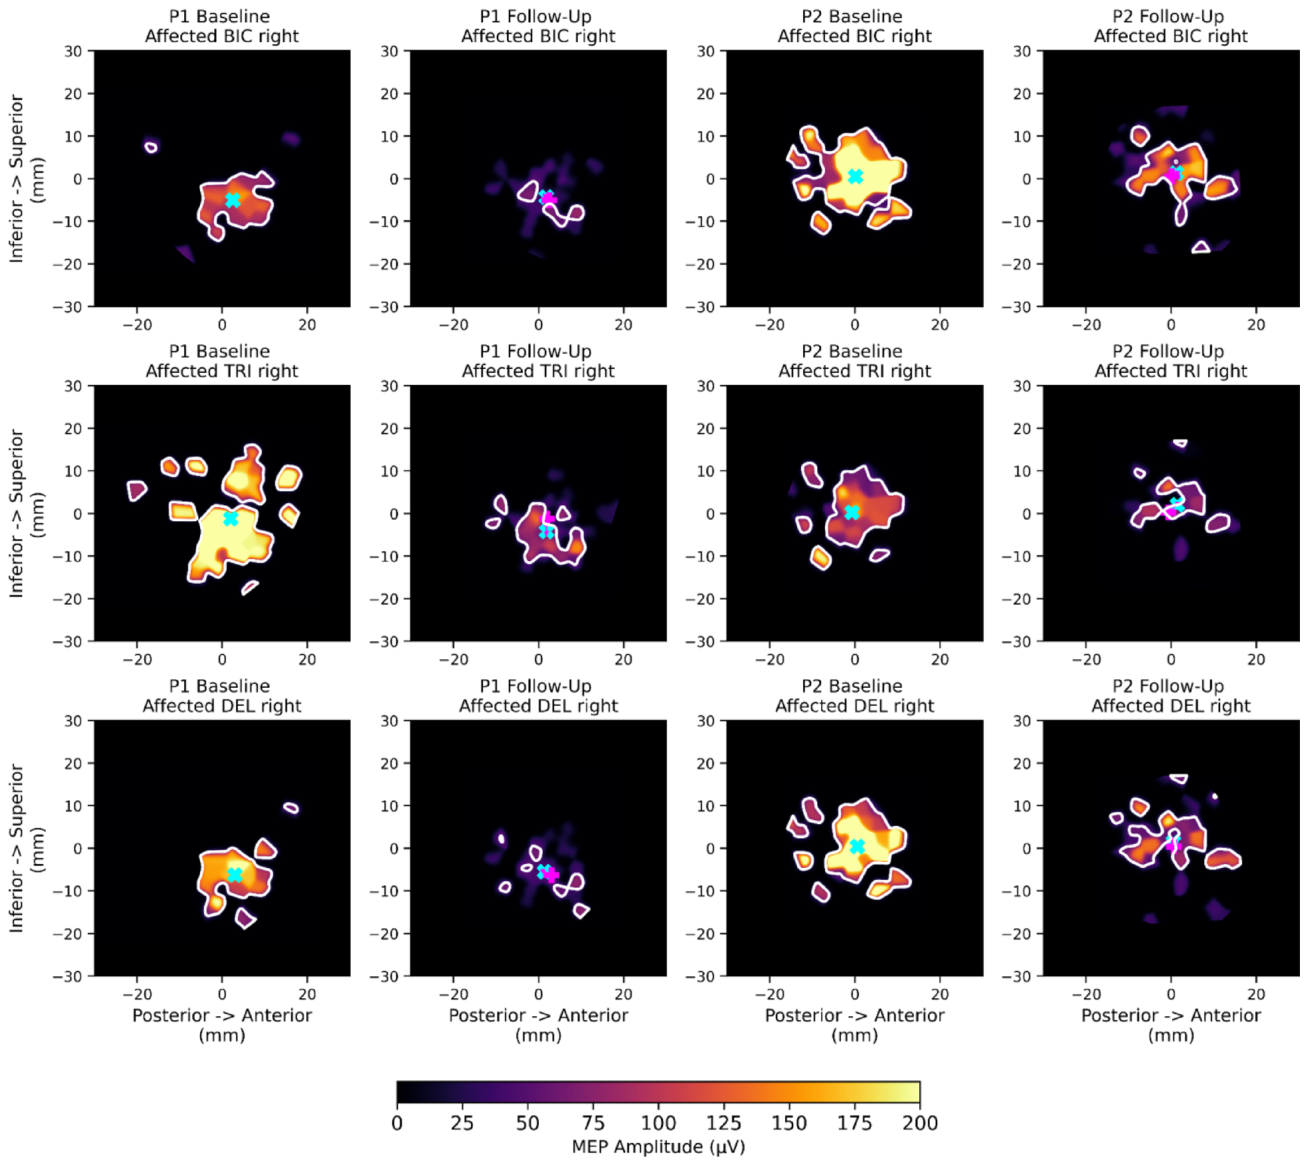
に詳細が示されており、
Figure 4. Fig. 4 Cortical excitability maps in the affected (left) hemisphere. Gaussian kernel-smoothed MEP activation maps for BIC, TRI, and DEL at baseline and post-rTMS follow-up for P1 and P2. The x- and y-axes correspond to PCA-derived physical dimensions in millimeters (range −30 to 30 mm), maintaining a consistent spatial frame across participants and sessions. The 50 µV iso-contour (white line) demarcates the representation boundary. Each map shows the smoothed MEP amplitude distribution using a perceptually uniform colormap ranging from 0 µV (black) to 200 µV (white). Current session CoG: Tur quoise X; Baseline CoG in follow-up maps: Purple X. MEP: Motor evoked potential; BIC: Biceps brachii; TRI: Triceps brachii; DEL: Deltoid; CoG: Center of gravity; PCA: Principal component analysis; mm: Millimeters解説: 患側(左)半球における上腕二頭筋(BIC)、上腕三頭筋(TRI)、三角筋(DEL)のガウスカーネル平滑化されたMEP活動マップを、ベースライン時とrTMS後の追跡調査時で参加者ごとに示しています。
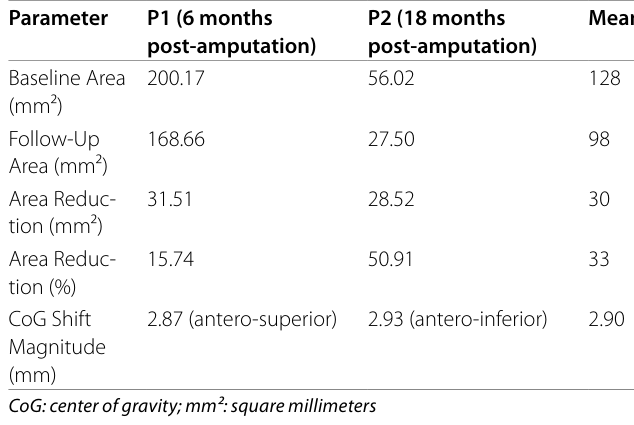
Table 3. Table 3 Triceps representation in the unaffected (right) hemisphere Parameter P1 (6 months post-amputation)解説: 健側(右)半球における上腕三頭筋の表現領域(mm²)、領域減少率(%)、重心(CoG)シフトの大きさを参加者ごとに示しています。
に示されており、
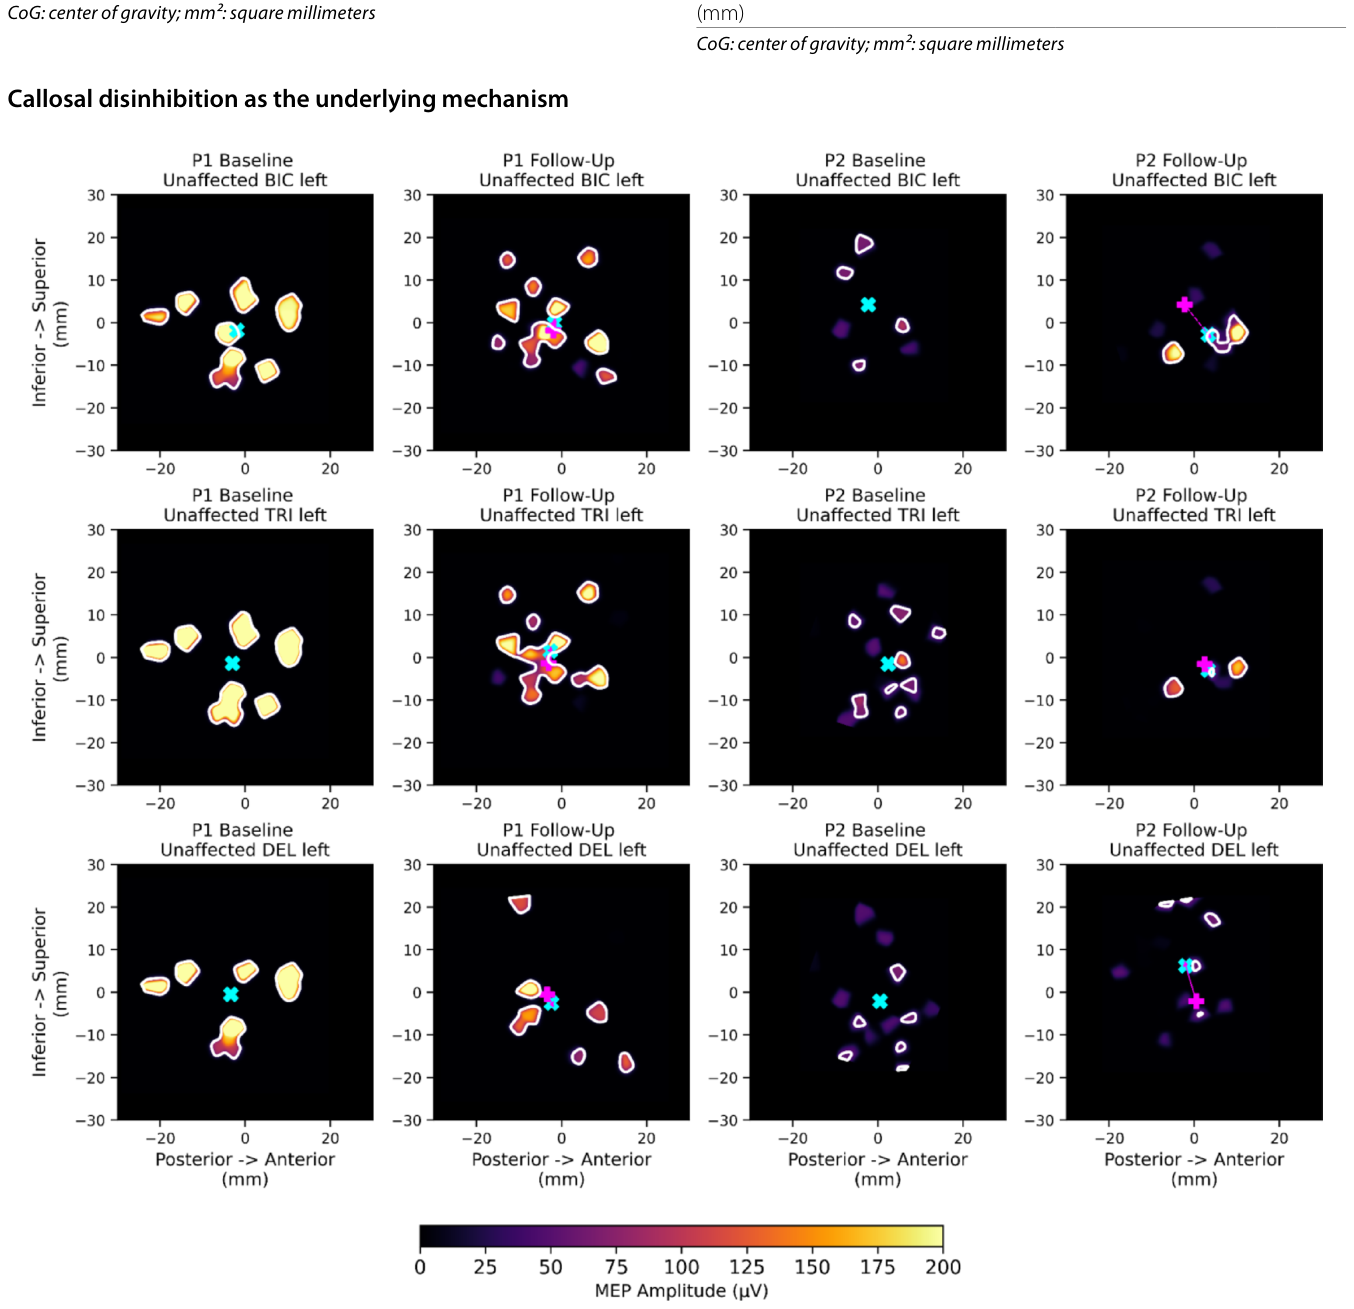
Figure 5. Fig. 5 Cortical excitability maps in the unaffected (right) hemisphere. Format identical to Fig. 4. Reductions in triceps representation area at the rTMS stimulation site are visible in both participants解説: 健側(右)半球における上腕二頭筋(BIC)、上腕三頭筋(TRI)、三角筋(DEL)の皮質興奮性マップを、ベースライン時とrTMS後の追跡調査時で参加者ごとに示しています。上腕三頭筋の表現領域の減少が両参加者に見られます。
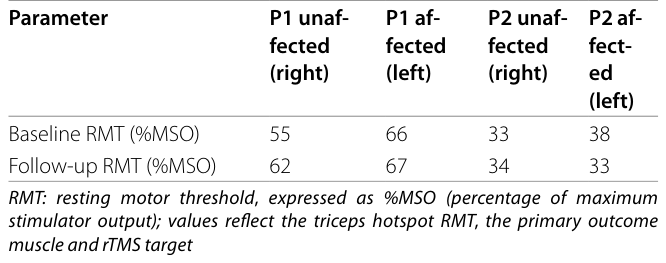
で視覚的に確認できます。ベースラインと追跡調査時の安静時運動閾値(RMT)は
Table 4. Table 4 Resting motor threshold by hemisphere, participant, and session Parameter P1 unaf fected (right)解説: ベースライン時と追跡調査時における、半球ごと、参加者ごとの安静時運動閾値(RMT)を示しています。値は主に上腕三頭筋ホットスポットのRMTです。
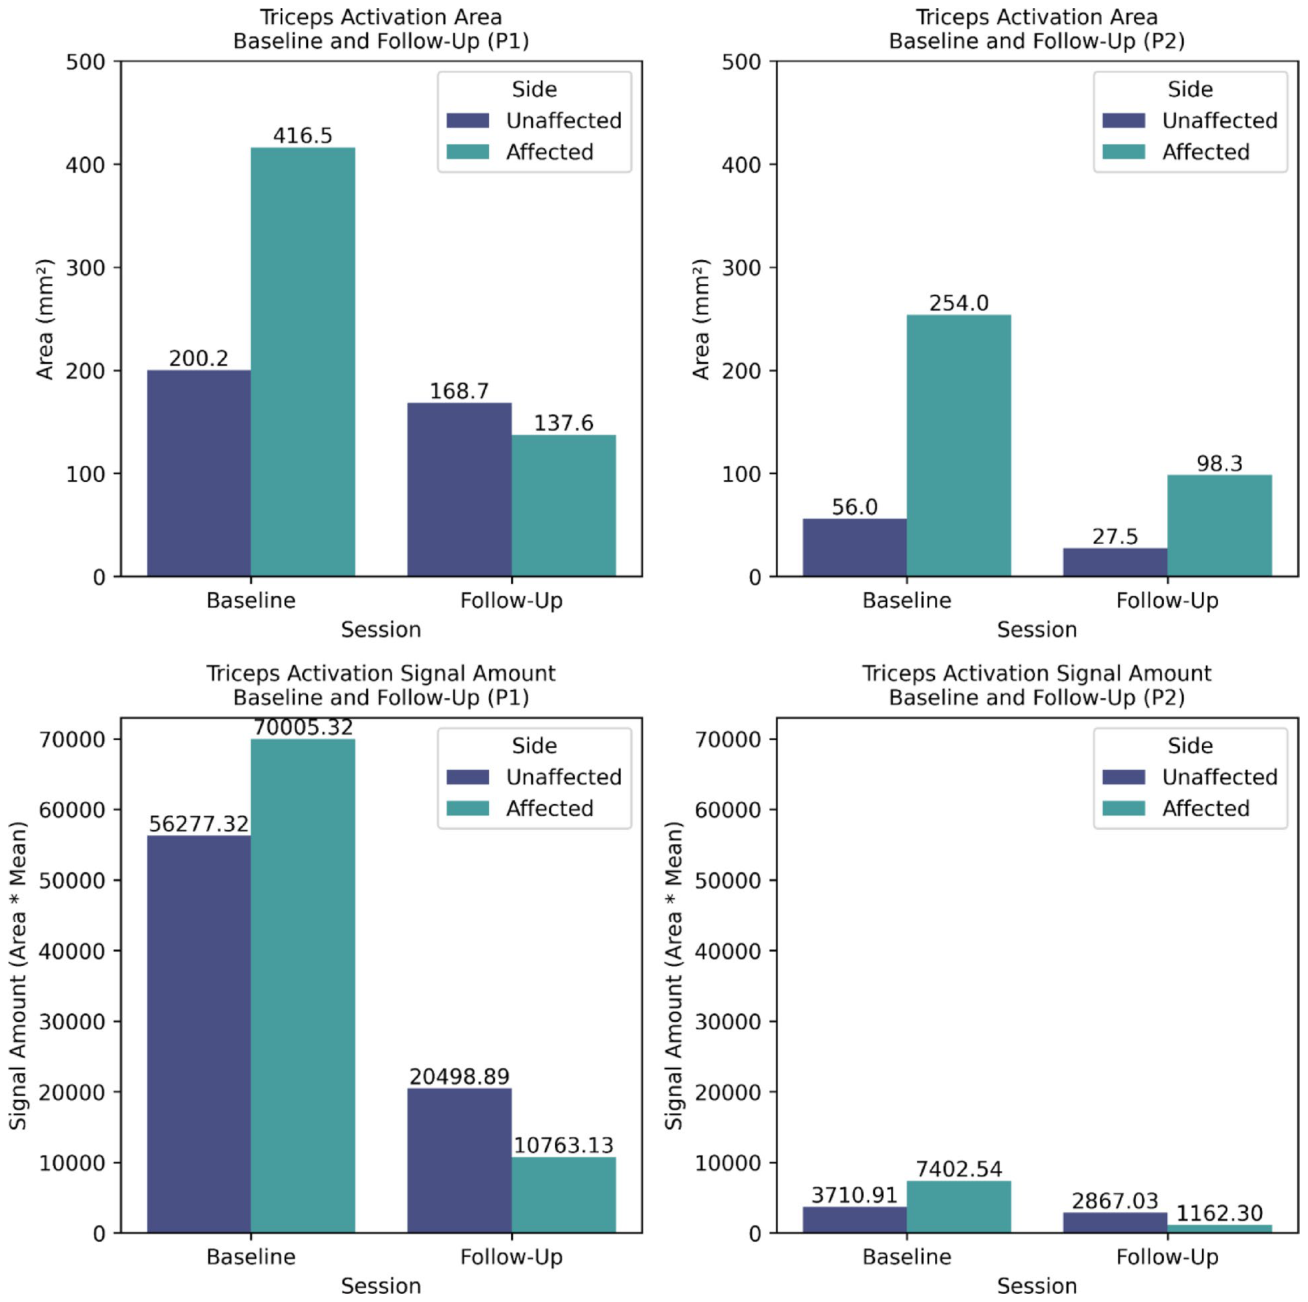
Figure 7. Fig. 7 Triceps motor representation parameters by hemisphere and session display increased similarity in follow-up compared to baseline. Activation area (mm²) and signal amount (mean MEP amplitude × area) for P1 and P2 at baseline and follow-up. Navy: Unaffected hemisphere; Teal: Affected hemi sphere. MEP: Motor evoked potential; mm²: Square millimeters; P1: Participant 1; P2: Participant 2解説: 参加者1(P1)と参加者2(P2)のベースライン時と追跡調査時における、上腕三頭筋の運動表現パラメータ(活動領域と信号量)を示したグラフです。追跡調査では、ベースラインと比較して両半球間の類似性が増加していることがわかります。



コメントを残す