どうも、Beyond the Pixelです。近年、がんの発見や評価に不可欠な画像診断モダリティであるPET/CT検査は、同時に放射線被ばくを伴うため、その安全性と生物学的影響の正確な把握は重要な課題です。特に、PET/CTでは、体内に投与される放射性薬剤18F-FDG(フルオロデオキシグルコース)による内部被ばくと、CTスキャンによる外部被ばくの両方があります。これまでの疫学的研究では、医用画像検査ががんリスク増加に寄与する可能性が示唆されており、合理的に達成可能な限り低く抑える(ALARA)原則に基づいた線量低減の努力が続けられています。しかし、PET/CTにおける最適なCT線量設定に関する明確なコンセンサスはまだありませんでした。また、FDGとCTによる放射線が体内でどのように相互作用するのかも不明な点が多く残されていました。本研究は、これらの疑問に対し、染色体異常(CA)解析という高感度な手法を用いて、FDGとCTそれぞれの生物学的寄与を定量的に評価し、PET/CTにおけるCT線量最適化戦略のための生物学的基盤を提供することを目的としています。
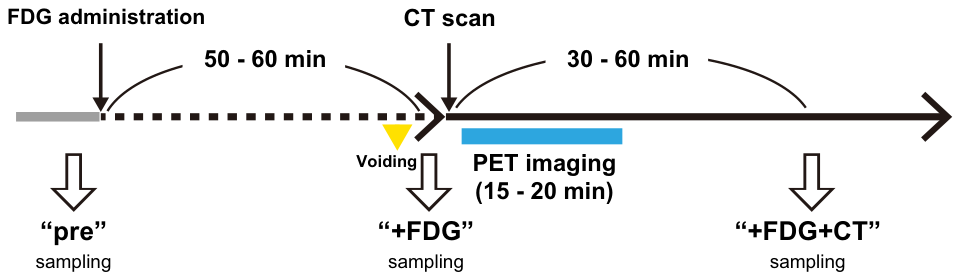
Figure 1. Fig. 1 Patient flow and PET/CT blood-sampling schedule. a Flowchart of patient enrollment at the two centers. Center RD and Center SD denote the reduced‑dose and standard‑dose PET/CT centers, respectively. Peptide nucleic acid fluorescence in situ hybridization (PNA-FISH) was used to detect chromosomal aberrations (CAs) in peripheral blood lymphocytes (PBLs). Patients included in PNA-FISH analysis were considered CA-evaluable patients. b PET/CT procedure and blood‑sampling schedule. Peripheral blood was collected immediately before 18 F‑fluorodeoxyglucose (18F‑FDG) administration (“pre”), 50–60 min after FDG administration (“+FDG”), and 30–60 min after CT acquisition (“+FDG + CT”)解説: 本図は、PET/CT検査における血液サンプル採取スケジュールを示しています。FDG投与前("pre")、FDG投与50〜60分後("+FDG")、CTスキャン30〜60分後("+FDG+CT")の3つの時点で採血が行われました。これにより、FDG投与とCTスキャンそれぞれの影響を評価することが可能となります。⚠ 自動抽出画像の検証で一致を確認できませんでした。正確な内容は元論文のFigure 1をご参照ください。
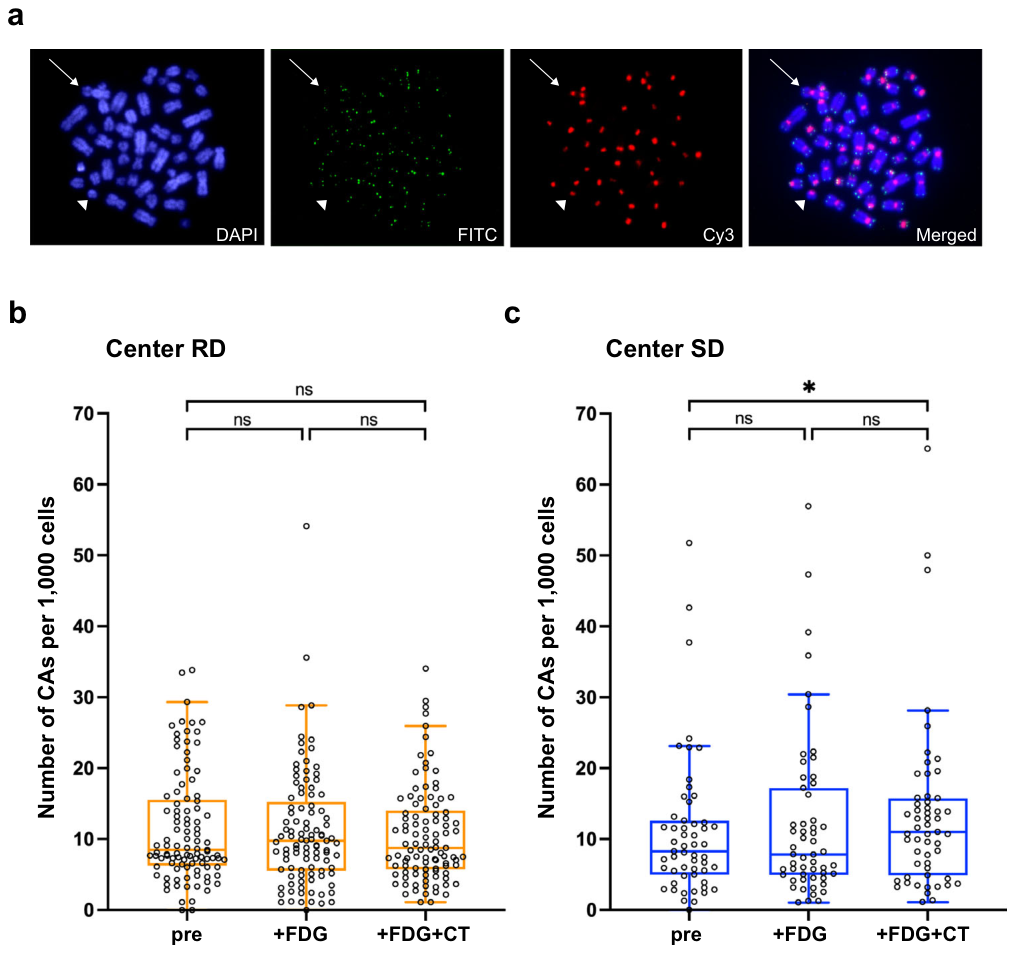
Figure 2. Fig. 2 Chromosomal aberrations at each sampling point. a Representative metaphase lymphocyte showing chromosomal aberrations. A dicentric chromosome with two centromeres (arrow) and a ring chromosome lacking telomeres (arrowhead) are indicated. Chromosomal DNA is stained with 4′,6-diamidino-2-phenylindole (DAPI) (blue); telomeres with fluorescein isothiocyanate (FITC) (green); centromeres with Cy3 (red); the right panel shows the merged image. b, c Number of chromosomal aberrations (CAs) per 1000 cells at each sampling point in b Center RD (reduced-dose PET/CT protocol) and c Center SD (standard-dose PET/CT protocol). Within-center temporal changes were first assessed using the Friedman test. For Center RD, “ns” indicates a non-significant overall Friedman test. For Center SD, pairwise comparisons were performed using Wilcoxon signed-rank tests with Holm adjustment because the Friedman test was significant. Pairwise comparisons: “pre” vs “+FDG,” “+FDG” vs “+FDG + CT,” and “pre” vs “+FDG + CT.” * p < 0.05; ns, not significant解説: 本図は、染色体異常の代表的な画像と、各採血時点における染色体異常(CA)の頻度を示しています。aパネルでは、2つの動原体を持つ二動原体染色体と、末端が欠損した環状染色体が示されています。bパネルはCenter RD(低線量CTプロトコル)、cパネルはCenter SD(標準線量CTプロトコル)におけるCA頻度を時系列で示しており、Center SDの標準線量CT後にCAが有意に増加したことが示されています。
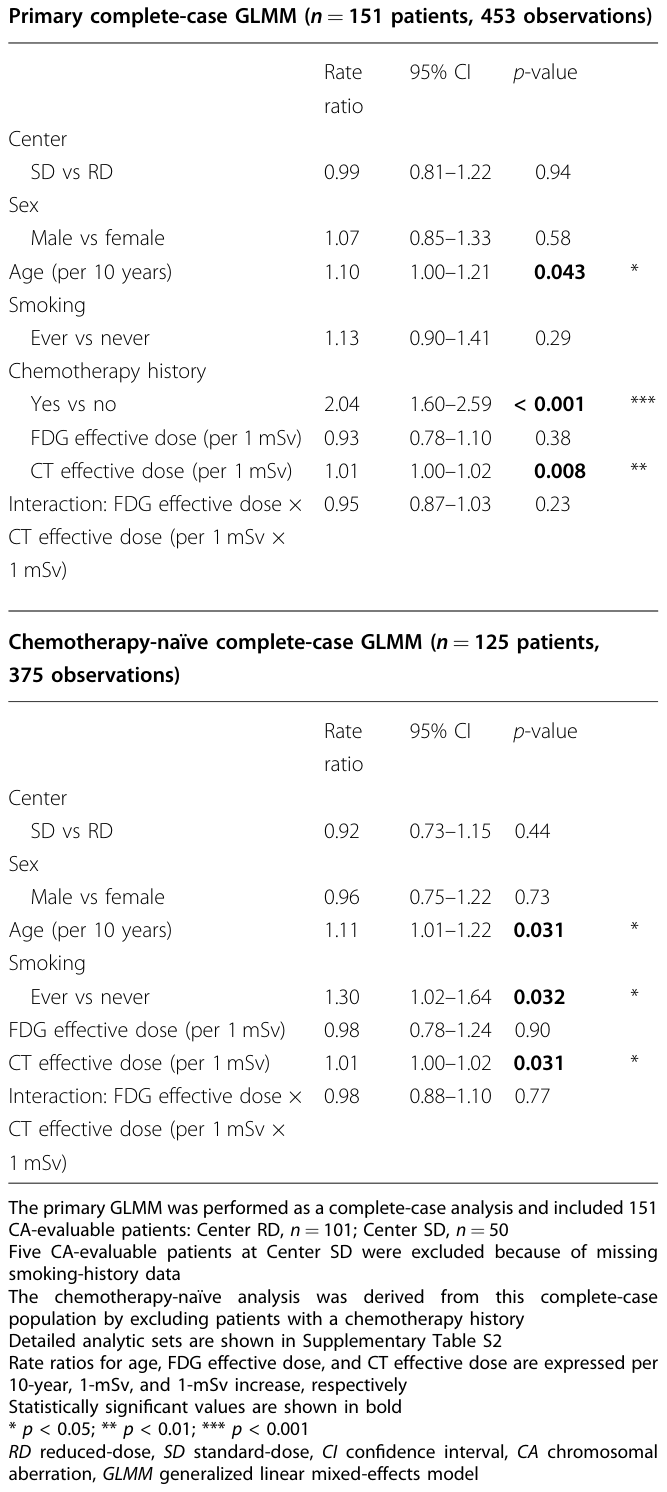
Table 3. Table 3 Primary complete-case Poisson generalized linear mixed model for factors associated with CA frequency解説: 本表は、染色体異常(CA)頻度に関連する要因を評価するための多変量一般化線形混合効果モデルの結果です。年齢、化学療法歴、CT実効線量がCA頻度と有意に関連していることが示されており、特に化学療法歴が最も強い関連を示しています。FDG実効線量やFDGとCTの相互作用は有意な関連がありませんでした。
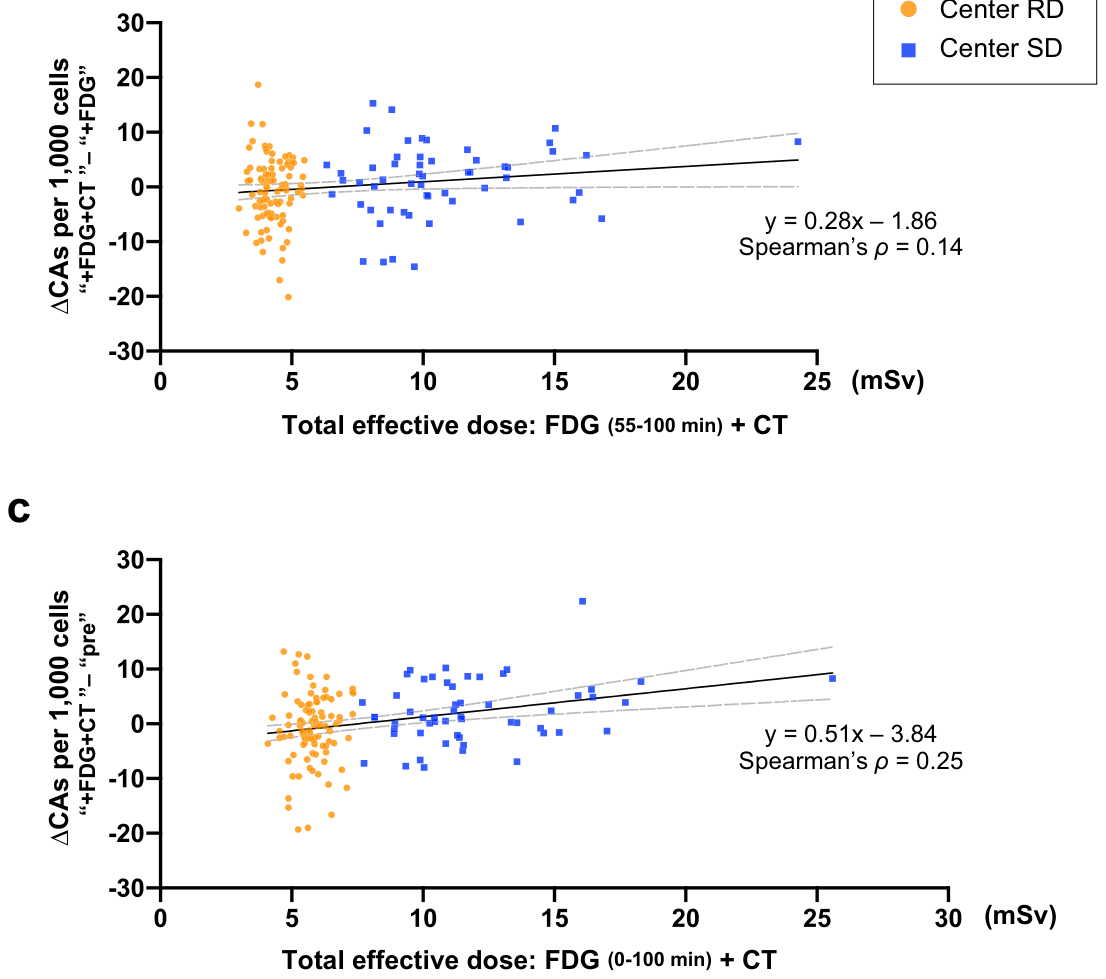
Figure 3. Fig. 3 (See legend on next page.)解説: 本図は、FDG、CT、およびPET/CTの総線量と染色体異常(CA)の変化との相関関係を示しています。パネルbは、「+FDG+CT」と「+FDG」間のCAの変化とFDG(55-100分)およびCTからの実効線量との相関を、パネルcは、「+FDG+CT」と「pre」間のCAの変化とPET/CTからの総実効線量(FDG (0-100分) + CT)との相関を示しています。FDG単独ではCA変化との相関が低い一方、CTを含む総実効線量では正の相関が見られます。⚠ 自動抽出画像の検証で一致を確認できませんでした。正確な内容は元論文のFigure 3をご参照ください。
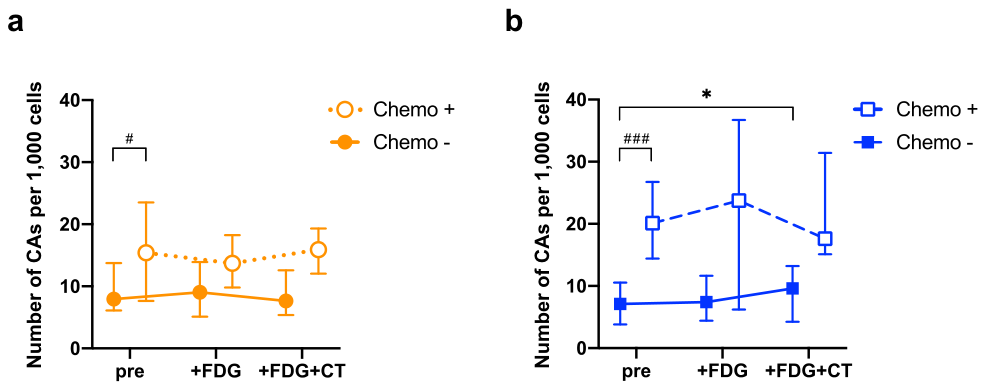
Figure 4. Fig. 4 Subgroup analysis according to history of chemotherapy. a Center RD; b Center SD. In each center, patients were stratified into those with a history of chemotherapy (Chemo +) and those without (Chemo −). Open symbols (circles in a, squares in b) represent Chemo +, and filled symbols represent Chemo −. The y-axis shows the number of chromosomal aberrations (CAs) per 1000 cells. Sampling time points (“pre,” “+FDG,” “+FDG + CT”) are defined as in Fig. 1. Between-group comparisons at baseline (“pre”) within each center were performed with the Mann–Whitney U test; # indicates p < 0.05, ### indicates p < 0.001. Within-group changes over time were assessed using the Friedman test, followed by Wilcoxon signed-rank tests for pairwise comparisons with Holm correction. Pairwise comparisons were performed between “pre” and “+FDG,” “+FDG” and “+FDG + CT,” and “pre” and “+FDG + CT.” * p < 0.05; comparisons without an asterisk were not statistically significant after adjustment解説: 本図は、化学療法歴の有無による染色体異常(CA)のサブグループ解析結果です。aパネルはCenter RD、bパネルはCenter SDにおける、化学療法歴のある対象者(Chemo +)とない対象者(Chemo -)でのCA頻度の推移を示しています。化学療法歴のある対象者はベースラインのCAレベルが高い傾向にあり、Center SDの化学療法歴のない対象者でのみ、PET/CT後にCAが有意に増加しました。


コメントを残す