どうも、Beyond the Pixelです。年齢を重ねるにつれて、注意や記憶といった認知機能が徐々に低下することはよく知られています。この認知機能の低下は、日常生活に支障をきたし、将来的にはアルツハイマー病のような神経変性疾患へと進行する可能性も指摘されています。このような背景から、認知機能の低下を遅らせるための非薬物療法に注目が集まっています。タスク訓練(task training)と低強度経頭蓋電気刺激(tES)は、その中でも特に有望なアプローチとして研究が進められています。tESは、頭皮に弱い電流を流すことで脳の興奮性を調節する非侵襲的な(体を傷つけない)手法です。本研究は、健康な高齢者を対象に、左背外側前頭前野(DLPFC)を標的とした反復的なtESとタスク訓練を組み合わせることが、認知機能にどのような影響を与えるかを検証することを目的としています。
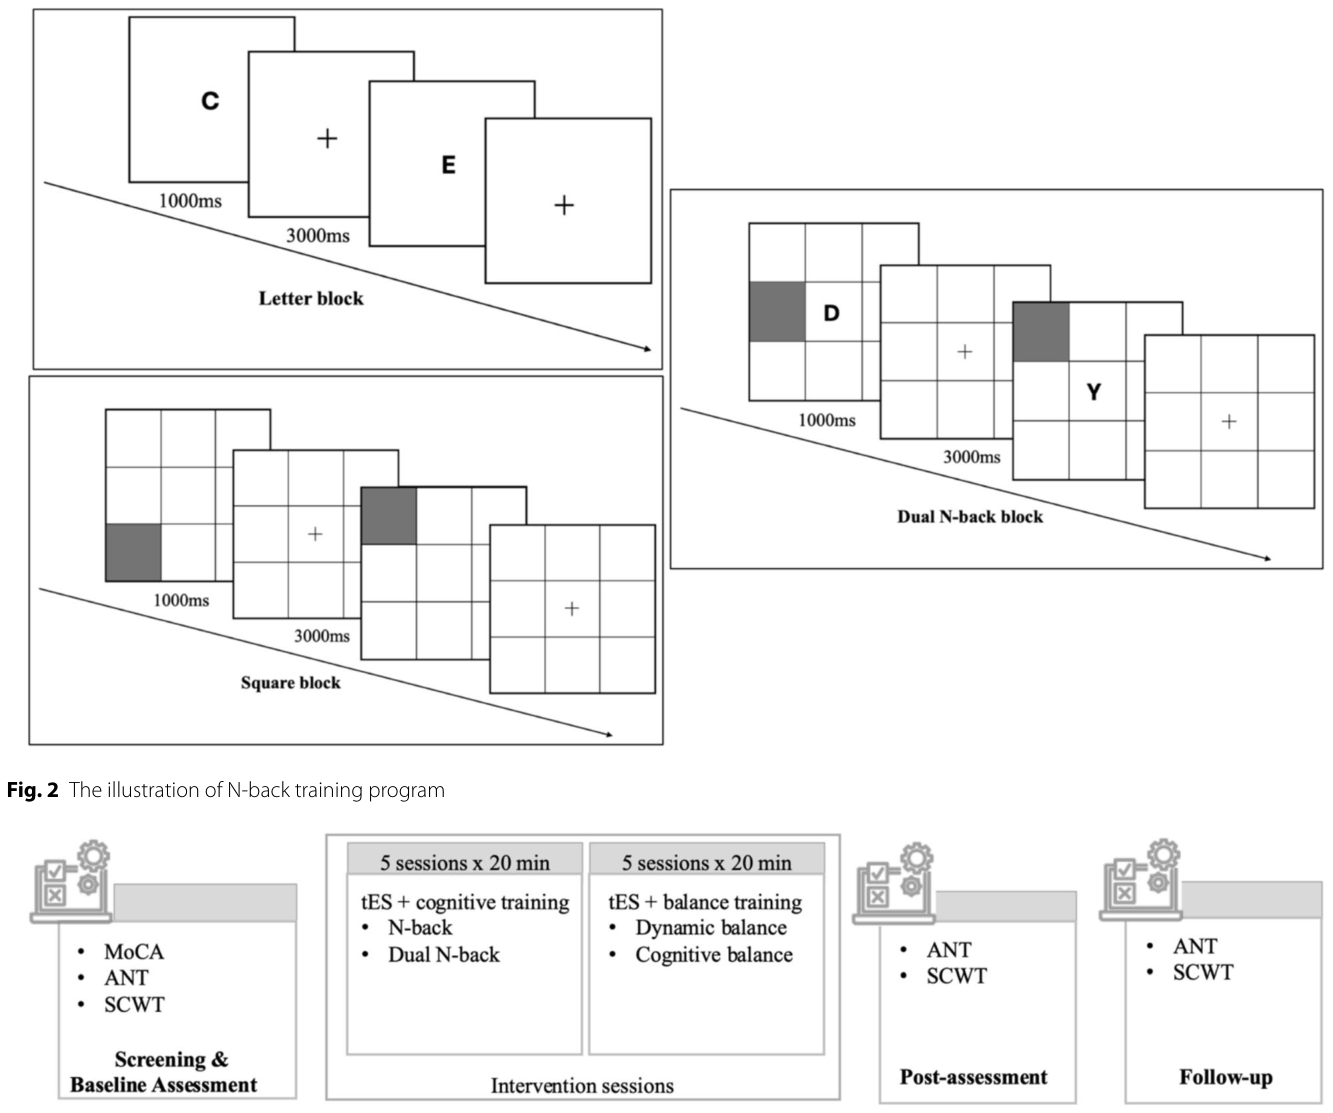
Figure 3. Fig. 3 Diagram of study design. Post-assessments were conducted within 24 h after the last intervention. Follow-up assessments were conducted 4-week after the last intervention. MoCA: Montreal Cognitive Assessment; ANT: attention network test; SCWT: Stroop Color-Word Test解説: 研究デザインの図です。スクリーニングとベースライン評価、介入セッション、介入後の評価、追跡評価の各段階と、それぞれの段階で実施されるテスト(MoCA、ANT、SCWT)が示されています。介入セッションはtESと認知訓練、動的バランス訓練が組み合わされています。
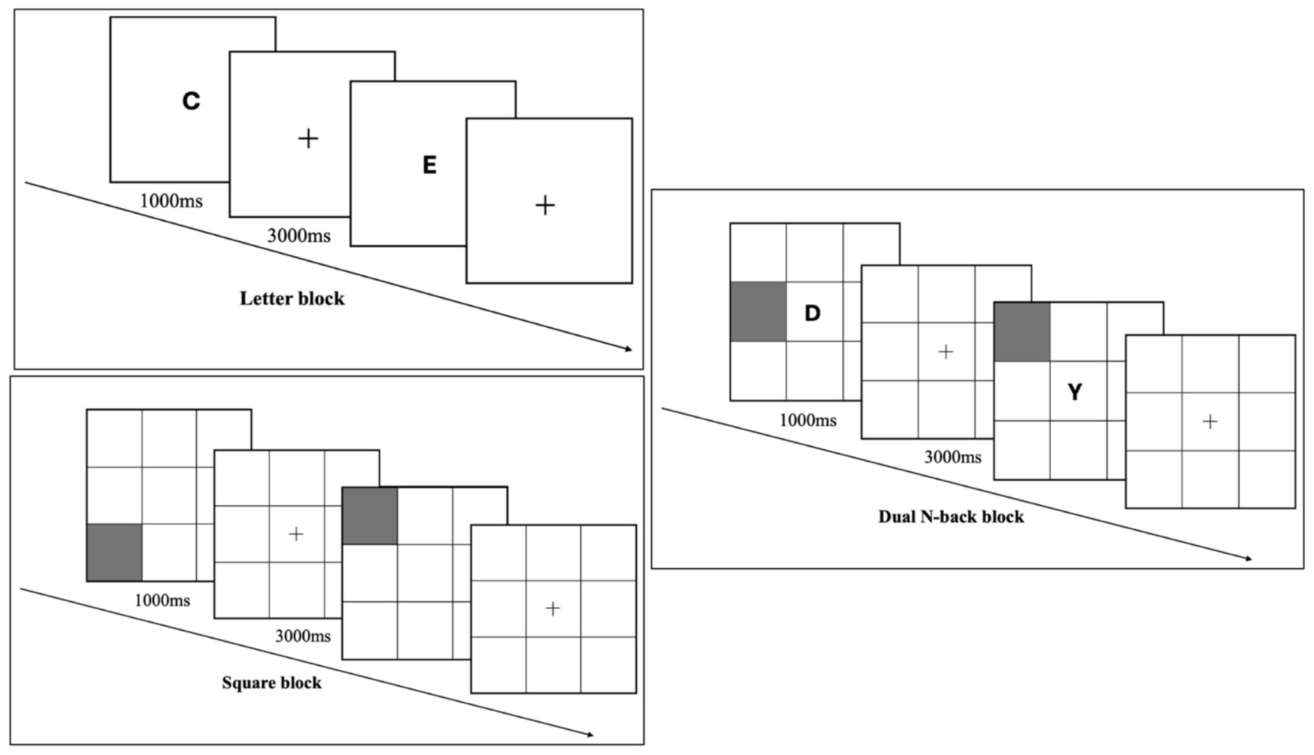
Figure 2. Fig. 2 The illustration of N-back training program解説: N-back訓練プログラムのイラストです。文字ブロック、四角ブロック、デュアルN-backブロックの3つのタスクタイプが示されており、それぞれの刺激提示時間と反応キーが説明されています。
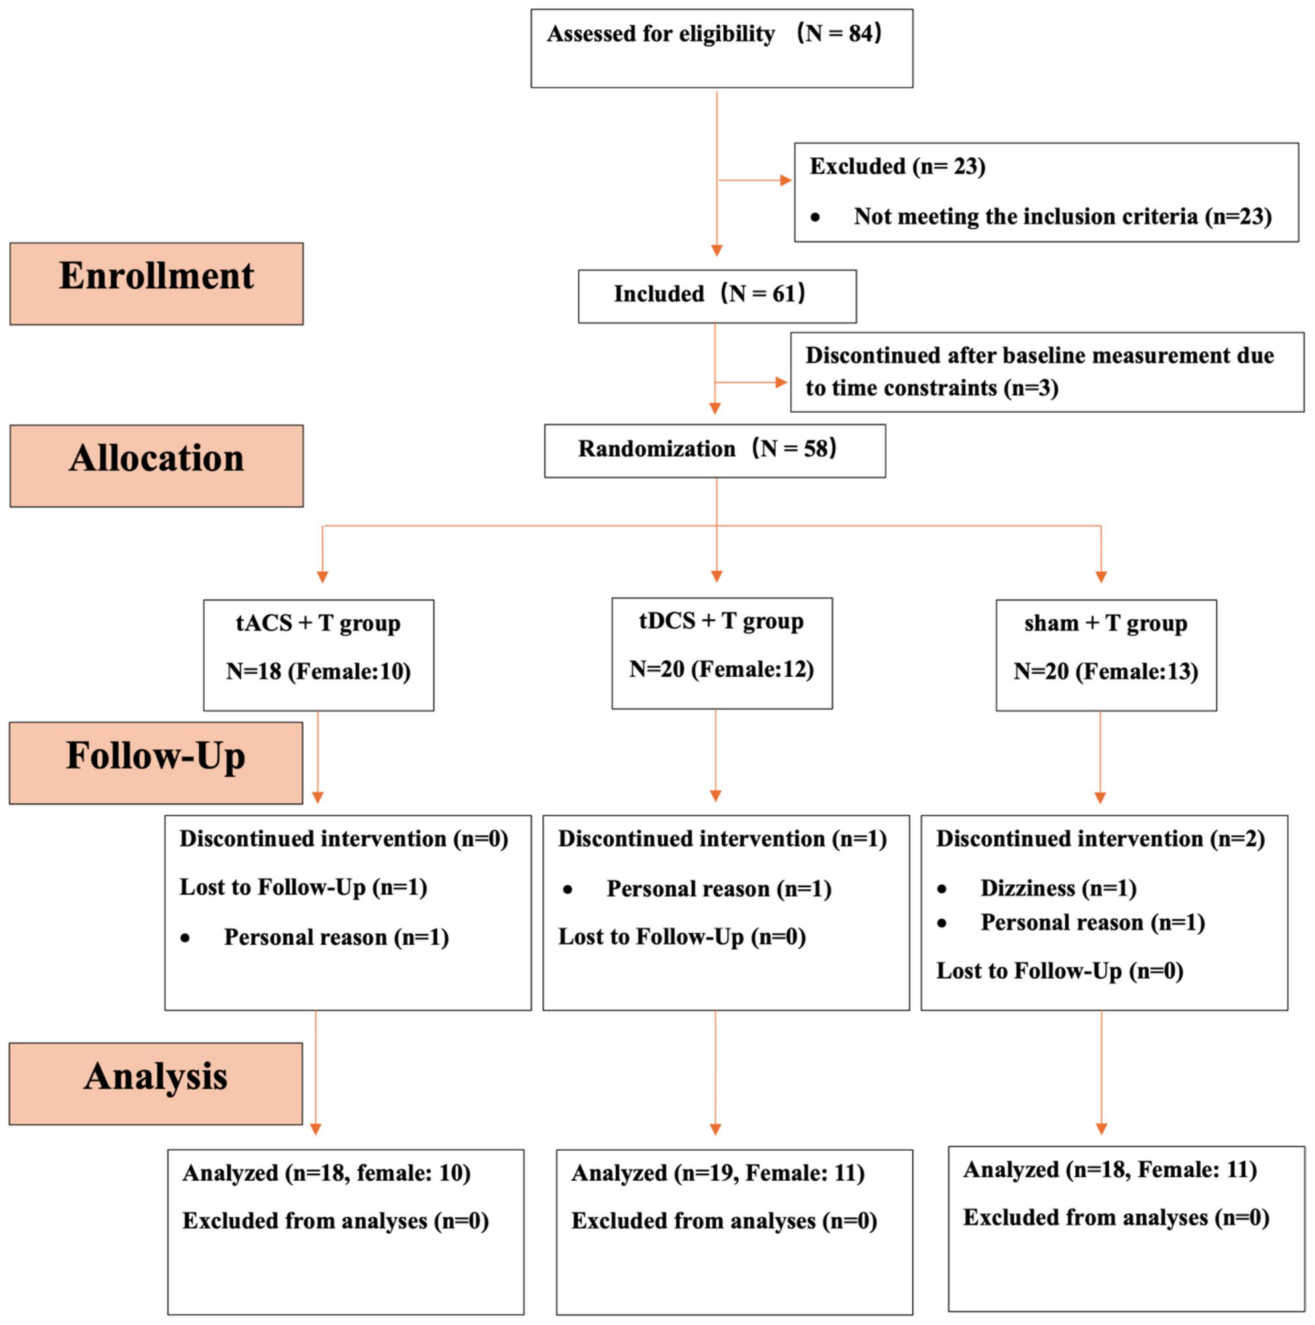
Figure 1. Fig. 1 Consolidated Standards of Reporting Trials flow diagram of participants in the study解説: 本研究の参加者の流れを示した図です。合計84人が適格性を評価され、最終的に55人がデータ解析に含まれました。
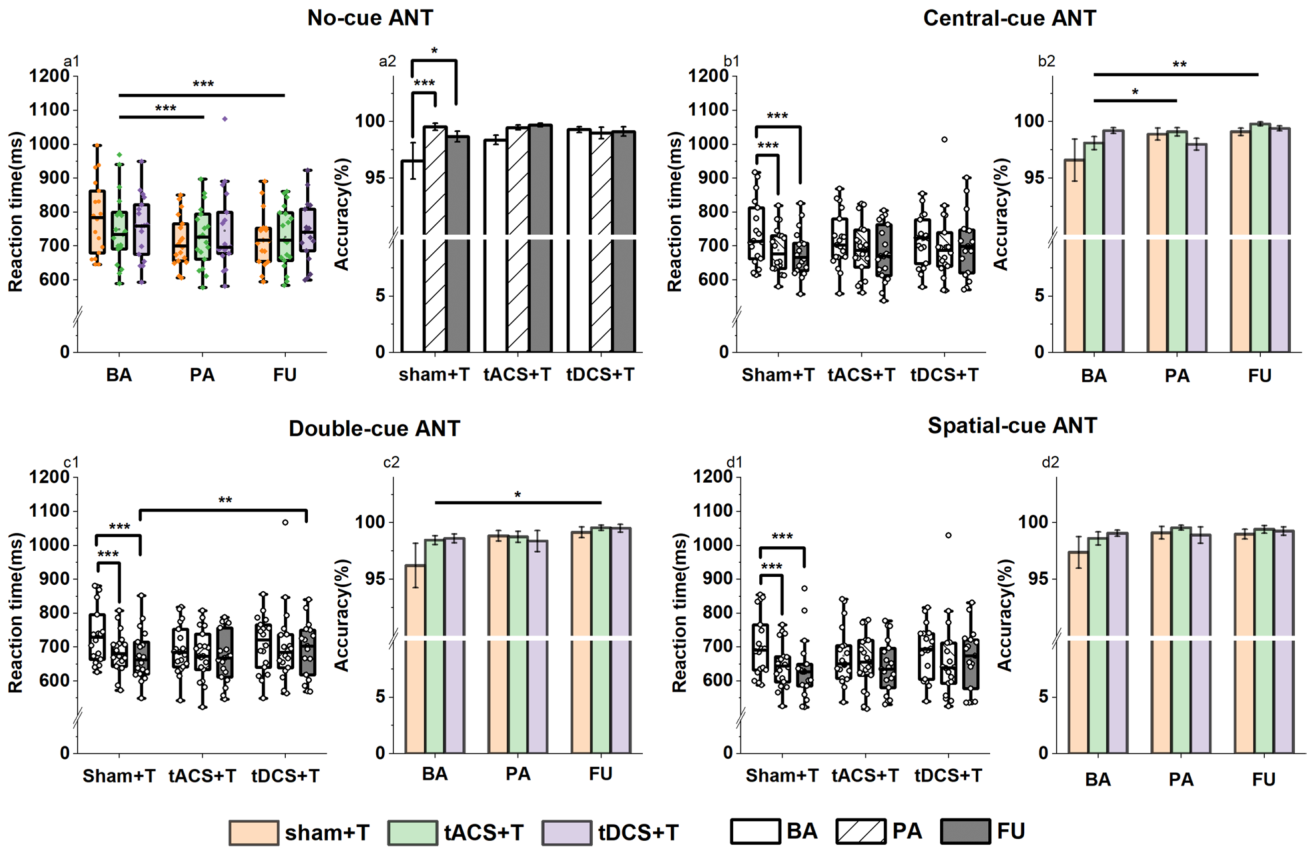
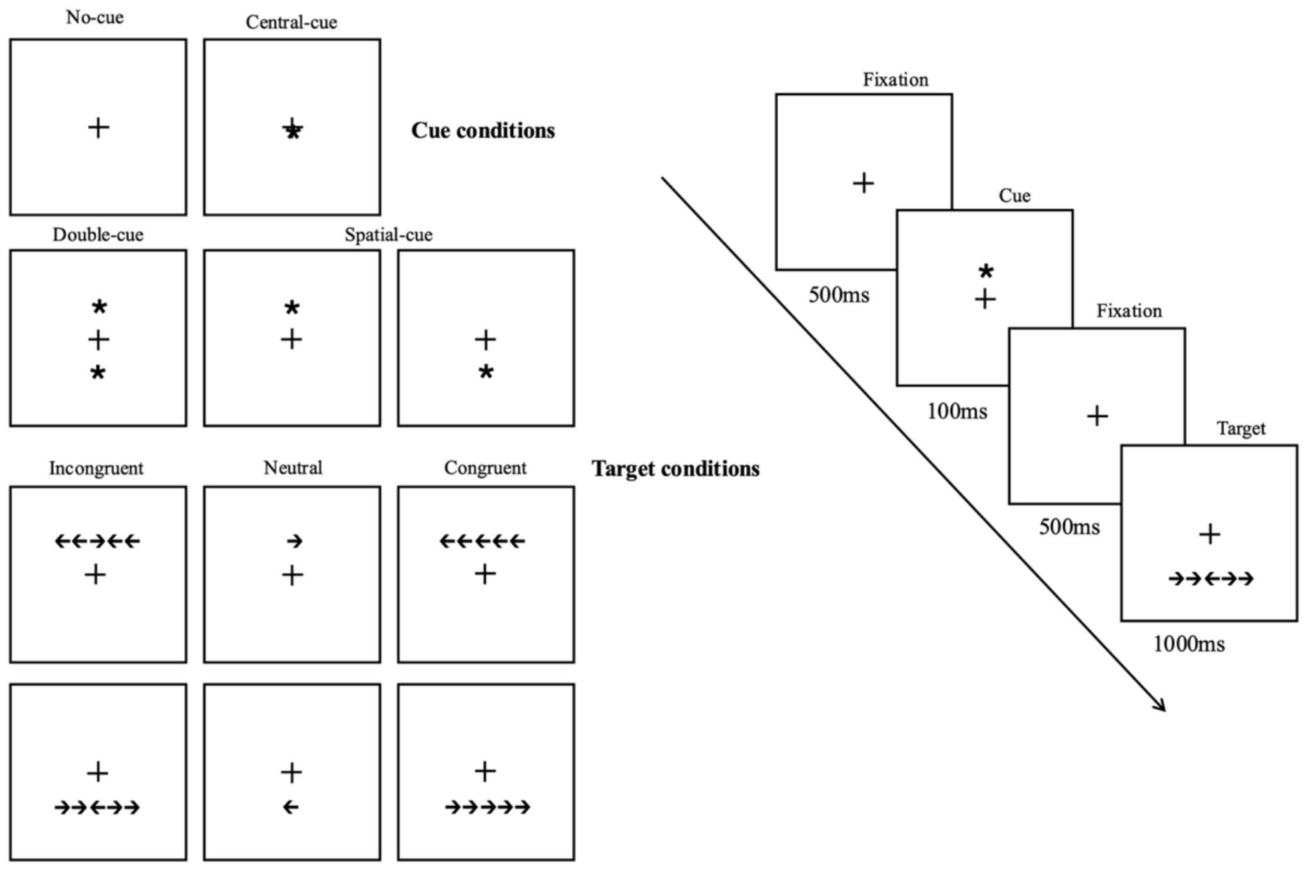
Figure 6. Fig. 6 Performance across different ANT conditions. Data are presented as boxplots with overlaid individual participant data points for each group (Sham + T, tACS + T, tDCS + T). The box represents the IQR, the horizontal line indicates the median, and whiskers extend to 1.5 × IQR. Colors represent dif ferent groups, whereas different fill patterns indicate assessment time points (BA, PA, FU). Panels labeled “1” (a1–d1) display reaction time (ms), and panels labeled “2” (a2–d2) display accuracy. a–d Correspond to the No-cue, Center-cue, Double-cue, and Spatial-cue conditions, respectively. For visualization purposes, the x-axis was adapted according to the type of statistical effect: for panels showing a main effect of time, time (BA, PA, FU) is displayed on the x-axis with groups represented by color; for panels showing interaction effects, group is displayed on the x-axis with time represented by different fill patterns. p < 0.05; *p < 0.01; **p < 0.001解説: 異なるANT(注意ネットワークテスト)条件におけるパフォーマンスを示す箱ひげ図です。各パネルは反応時間(ms)と正答率(%)を示しており、ノーキュー、セントラルキュー、ダブルキュー、空間キューの各条件におけるグループと時間の変化を比較しています。
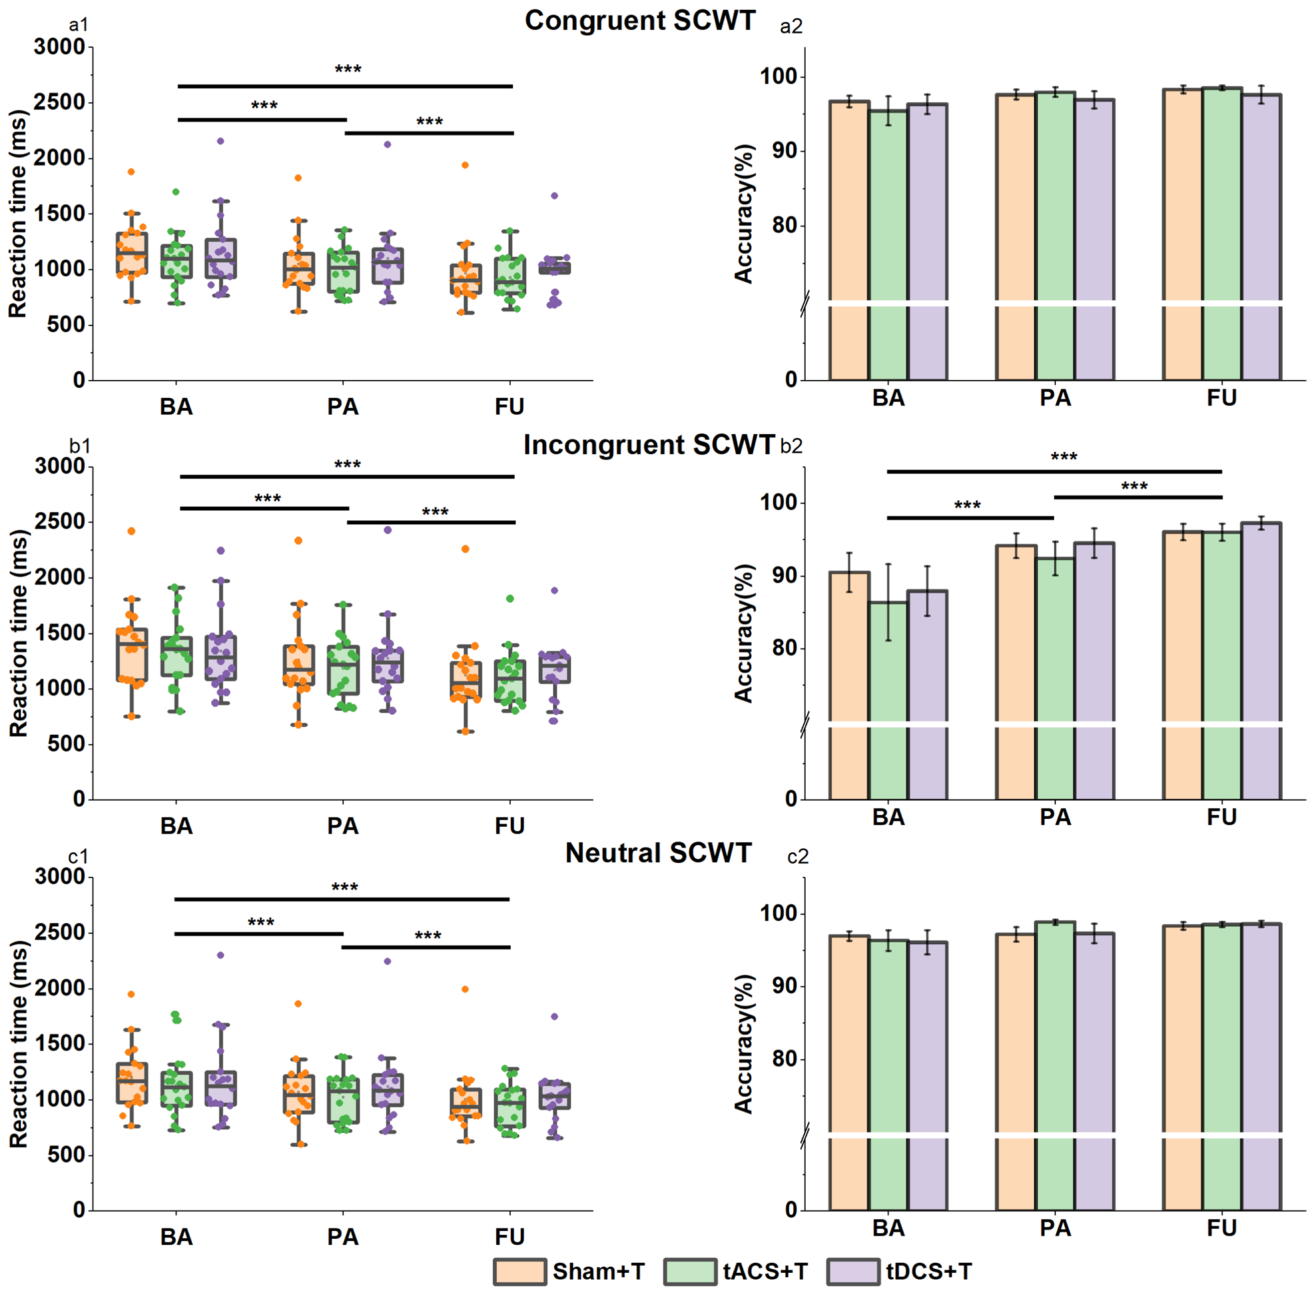
また、SCWTのパフォーマンスも全てのグループで介入後に向上しました。
Figure 7. Fig. 7 Performance on the Stroop task. Data are presented as boxplots with overlaid individual participant data points for each group (Sham + T, tACS + T, tDCS + T). The box represents the IQR, the horizontal line indicates the median, and whiskers extend to 1.5 × IQR. Panels labeled “1” (a1–c1) display reaction time (ms), whereas panels labeled “2” (a2–c2) display accuracy (%). a–c correspond to the congruent, incongruent, and neutral conditions, respectively. BA = baseline; PA = post-assessment; FU = follow-up. *: 0.01 < p ≤ 0.05; **: 0.001 < p ≤ 0.01; ***: p ≤ 0.001解説: ストループ色単語テスト(SCWT)におけるパフォーマンスを示す箱ひげ図です。各パネルは反応時間(ms)と正答率(%)を示しており、一貫、不一致、中立の各条件におけるグループと時間の変化を比較しています。
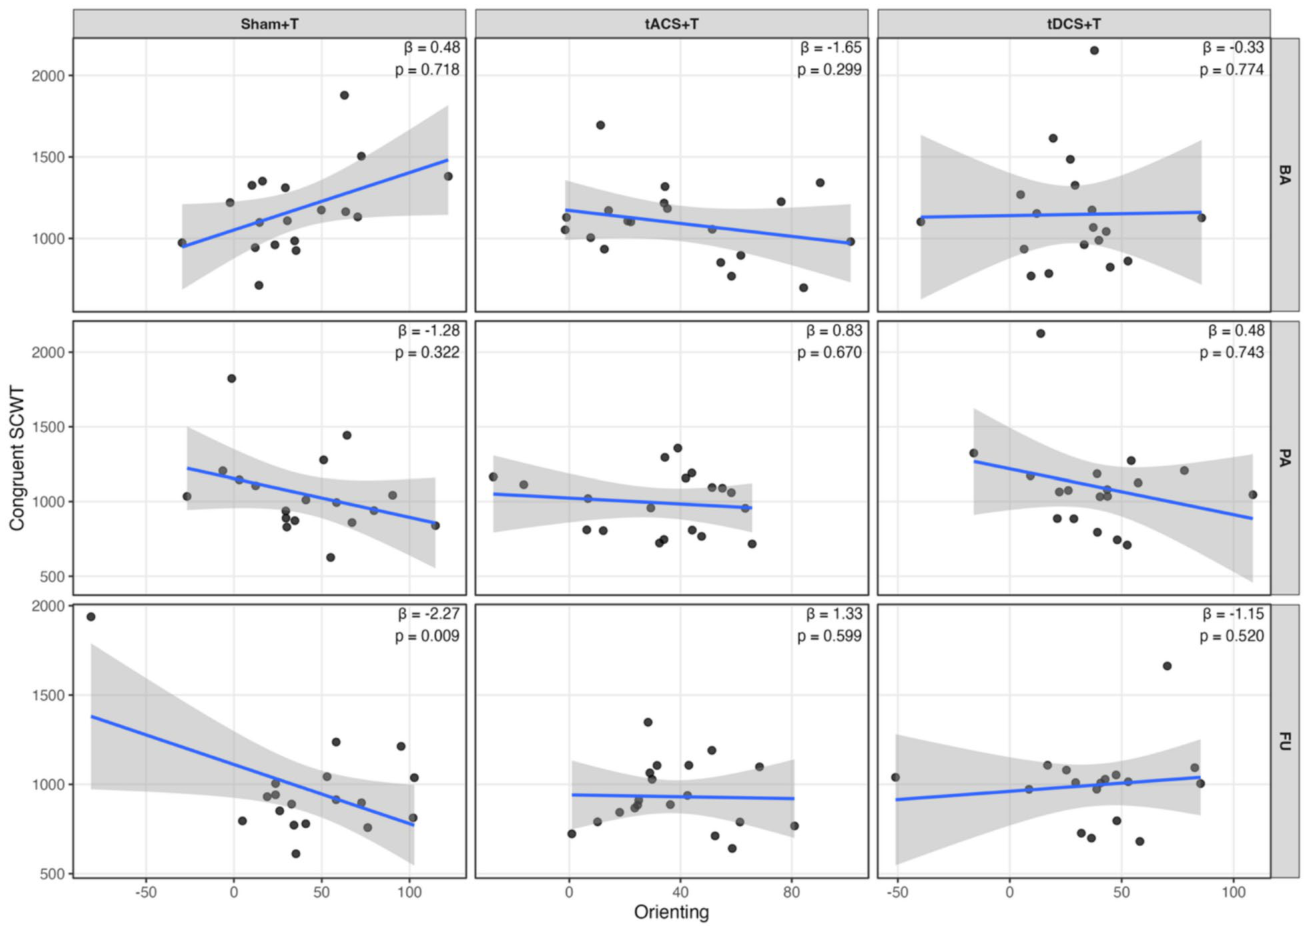
注目すべきは、シャム+Tグループにおいて、追跡評価時における定位ネットワーク効率スコア(orienting network efficiency score)と一貫性のあるSCWTパフォーマンスとの間に、ベースライン時と比較して有意に強い負の相関が認められたことです(t = 2.686, p = 0.024)。
Figure 8. Fig. 8 Scatterplots illustrating the association between orienting network efficiency and congruent reaction time (ms) across groups and time points. Each panel represents one group (columns: Sham + T, tACS + T, tDCS + T) and one assessment time (BA = baseline; PA = post-assessment; FU = follow-up). Dots represent individual participants, and solid lines indicate fitted linear regression lines with shaded areas representing 95% confidence intervals. The β coefficients and corresponding p-values are displayed in each panel. A significant negative association was observed in the Sham + T group at follow-up, while no significant associations were found in the other conditions解説: 定位ネットワーク効率と一貫性のあるSCWT反応時間(ms)との関連性を、グループと評価時点ごとに示す散布図です。各パネルには線形回帰直線と95%信頼区間が示され、β係数とp値が記載されています。
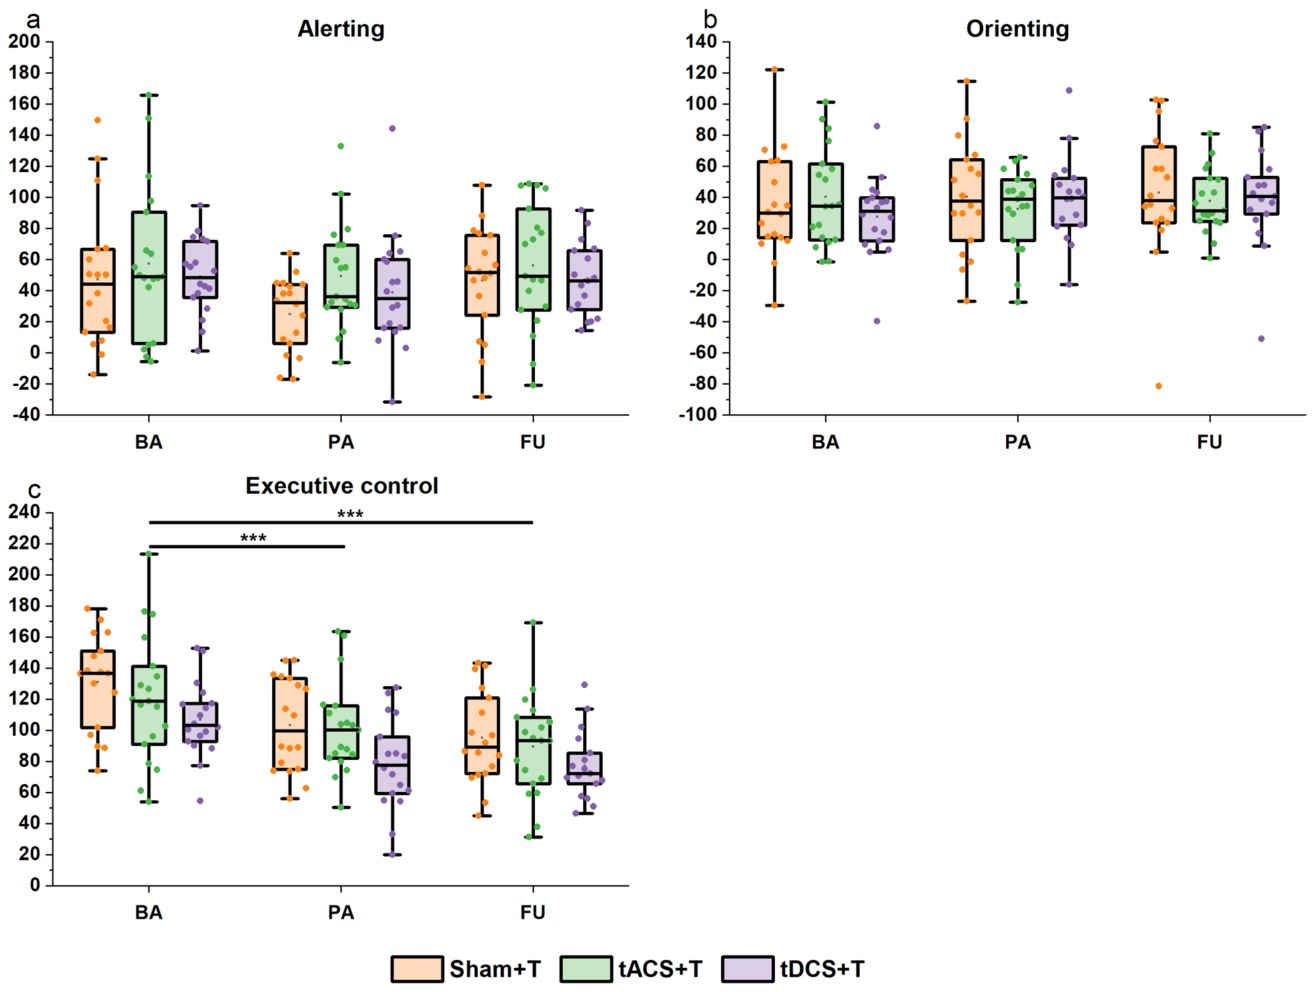
Figure 5. Fig. 5 Performance of the three attentional networks. Data are presented as boxplots with overlaid individual participant data points for each group (Sham + T, tACS + T, tDCS + T). The box represents the interquartile range (IQR), the horizontal line indicates the median, and whiskers denote the data range. BA = baseline; PA = post-assessment; FU = follow-up. Panels a–c correspond to the Alerting, Orienting, and Executive control networks, respectively. For the Executive control network, lower scores indicate better efficiency. *: 0.01 < p ≤ 0.05; **: 0.001 < p ≤ 0.01; ***: p ≤ 0.001解説: 3つの注意ネットワーク(覚醒、定位、実行制御)のパフォーマンスを示す箱ひげ図です。各パネルは、ベースライン(BA)、介入後(PA)、追跡評価(FU)時点での各グループ(Sham+T, tACS+T, tDCS+T)のデータを示しています。実行制御ネットワークでは、スコアが低いほど効率が良いことを示します。
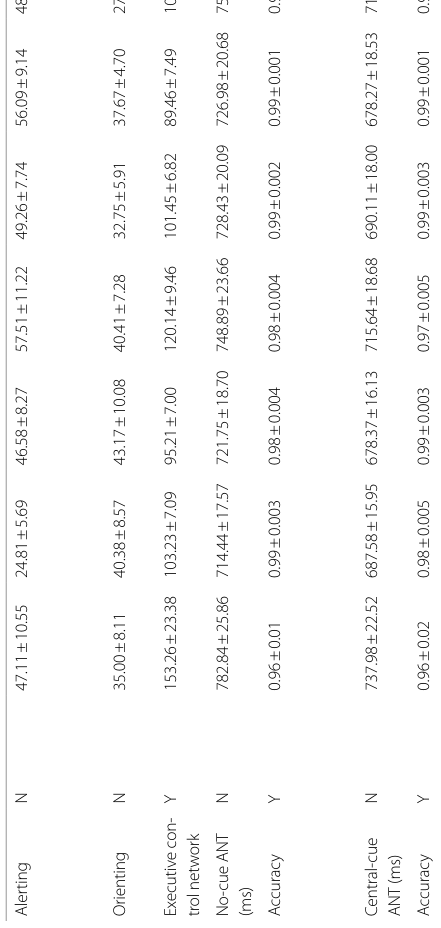
詳細なパフォーマンスと統計結果は、以下の表にまとめられています。
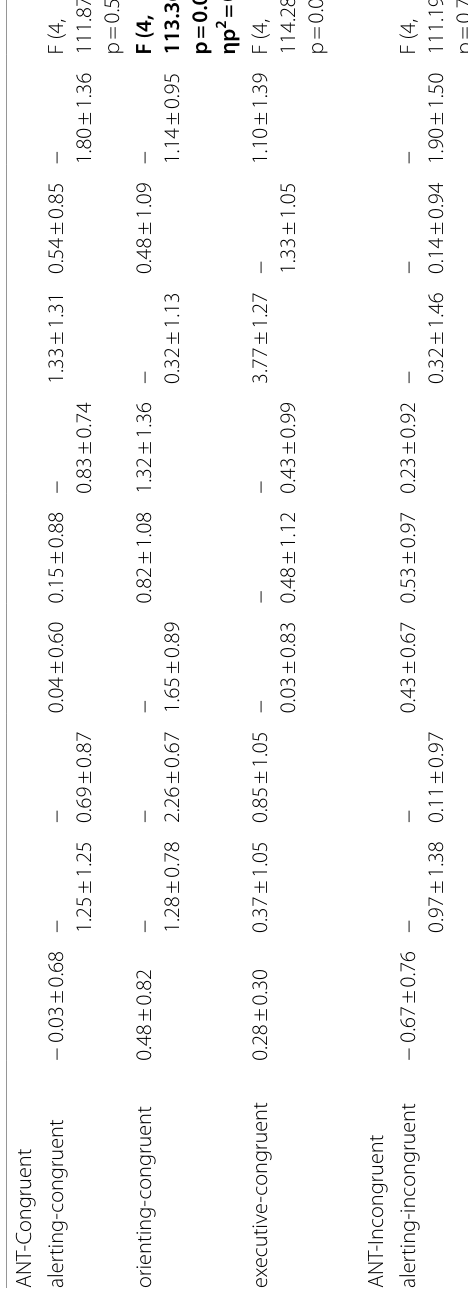
Table 2. Table 2 Performances and results of the attention network test and the stroop color-word test解説: 注意ネットワークテスト(ANT)とストループ色単語テスト(SCWT)のパフォーマンス結果と統計データを示す表です。覚醒、定位、実行制御ネットワークの効率、およびANTとSCWTの各条件における反応時間と正答率のベースライン、介入後、追跡評価時点での平均値と標準誤差が記載されています。
また、注意ネットワークの効率性とSCWTの相関に関する結果はこちらです。
Table 3. Table 3. Interaction and main effects of the correlations between network efficiencies and Stroop Color-Word Test performances解説: 注意ネットワーク効率とストループ色単語テスト(SCWT)のパフォーマンス相関における相互作用および主効果を示す表です。覚醒、定位、実行制御ネットワークの効率とSCWTの一貫、不一致、中立条件の相関関係について、各グループと評価時点における回帰傾きとその統計値が示されています。


コメントを残す