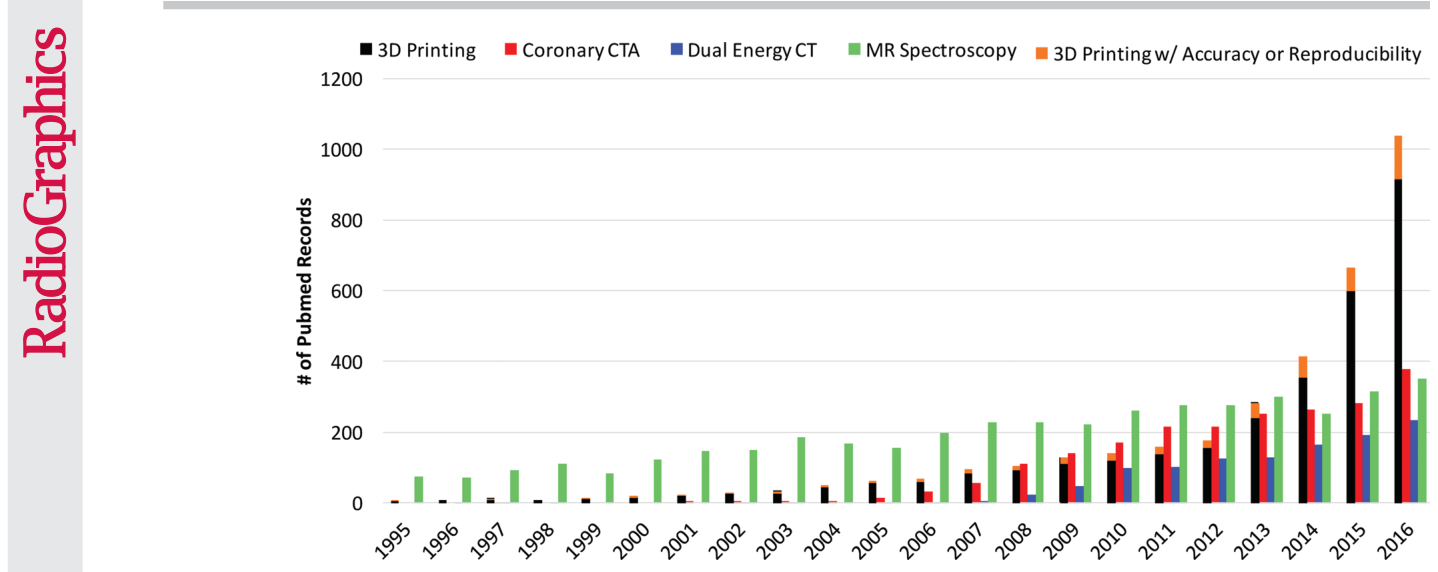
どうも、Beyond the Pixelです。医療分野における3Dプリンティング技術の進化は、ここ数年で著しいものがあります。PubMedに掲載された論文数の増加率を見ると、冠動脈CTアンギオグラフィーやデュアルエネルギーCT、MRスペクトロスコピーといった特定の画像診断モダリティに関するものを上回るペースで、3Dプリンティング関連の発表が増加していることが示されています (
Figure 1. Figure 1. Bar graph shows the number of publications cited in PubMed (https://www.ncbi.nlm.nih.gov/pubmed/) that contain reports on coronary CT angiography, dual-energy CT, MR spectroscopy, and 3D printing. Data for 2016 are based on results returned until the end of May 2016. Statistical data were collected by using the follow ing searches: For all reports on 3D printing, ((3d printing[Title/Abstract]) OR (rapid prototyping[Title/Abstract]) OR (additive manufacturing[Title/Abstract])) AND (“xxxx/1/1”[Date – Publication]: “xxxx/12/31”[Date – Publication]). For all reports on coronary CT angiography (CTA), ((coronary ct[Title/Abstract]) OR (coronary cta[Title/Abstract])) AND (“xxxx/1/1”[Date – Publication]: “xxxx/12/31”[Date – Publication]). For all reports on dual-energy CT, (dual energy ct[Title/Abstract]) AND (“xxxx/1/1”[Date – Publication]: “xxxx/12/31”[Date – Publication]). For all reports on MR spec troscopy, ((mr spectroscopy[Title/Abstract]) OR (mri spectroscopy[Title/Abstract])) AND (“xxxx/1/1”[Date – Publica tion]: “xxxx/12/31”[Date – Publication]). For all reports on 3D printing mentioning accuracy or reproducibility, ((3d printing[Title/Abstract]) OR (rapid prototyping[Title/Abstract]) OR (additive manufacturing[Title/Abstract])) AND ((accuracy[Title/Abstract]) OR (reproducibility[Title/Abstract])) AND (“xxxx/1/1”[Date – Publication]: ”xxxx/12/31”[Date – Publication]). In the above search terms, “xxxx” denotes the corresponding year on the horizontal axis of the graph.解説: PubMedに掲載された冠動脈CTアンギオグラフィー、デュアルエネルギーCT、MRスペクトロスコピー、および3Dプリンティングに関する論文数の経年変化を示す棒グラフです。3Dプリンティング関連の論文が他の画像診断モダリティの論文よりも急速に増加していることが分かります。
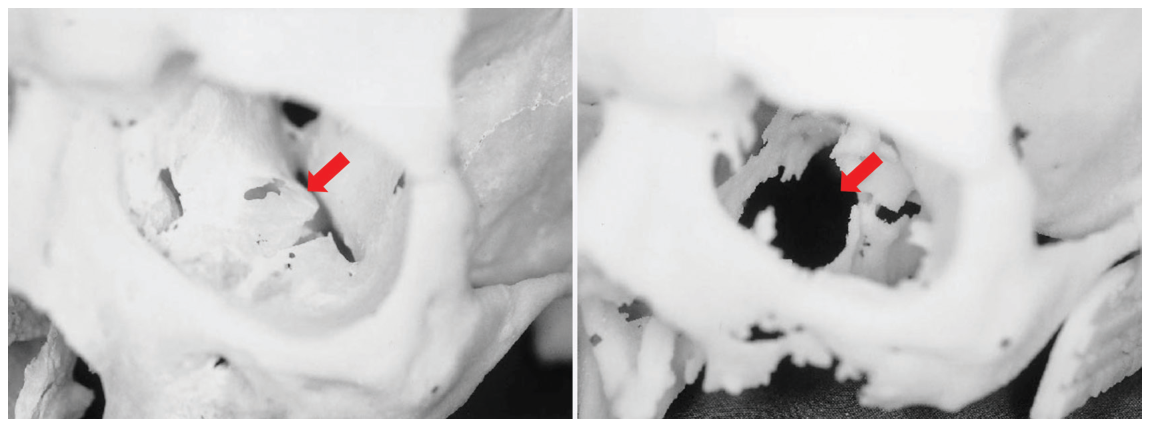
Figure 2. Figure 2. Photographs of a cadaveric skull (left) and the corresponding 3D printed model (right) show a loss of detail in the orbital floors (arrows) and along the margins of a maxillary defect, where the bone is thin, on the 3D model. (Reprinted, with permission, from reference 17.)解説: 遺体頭蓋骨(左)とその対応する3Dプリントモデル(右)の写真です。3Dモデルでは、眼窩底(矢印)や、骨が薄い上顎骨病変の縁に沿った詳細が失われていることが示されています。
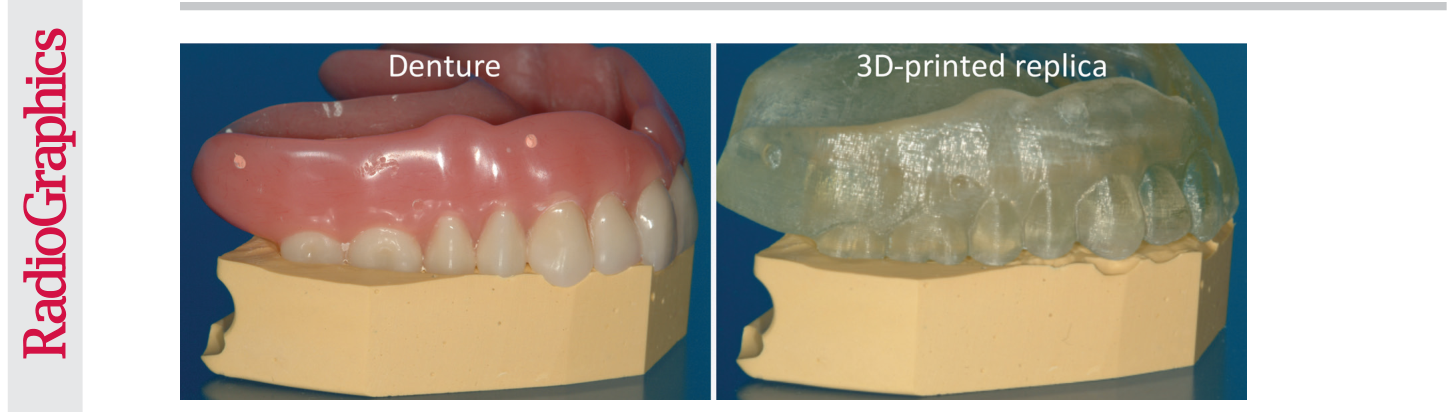
Figure 3. Figure 3. Left: Denture fitted on a stone platform. Right: The 3D printed model of the denture derived from cone-beam CT (0.4-mm section thickness) does not fit the platform. (Courtesy of Lambert J. Stumpel, DDS, San Francisco, Calif.)解説: 石膏台に装着された義歯(左)と、コーンビームCT(0.4mmスライス厚)から作成された義歯の3Dプリントモデル(右)です。3Dプリントモデルが石膏台に適合していない様子が示されています。
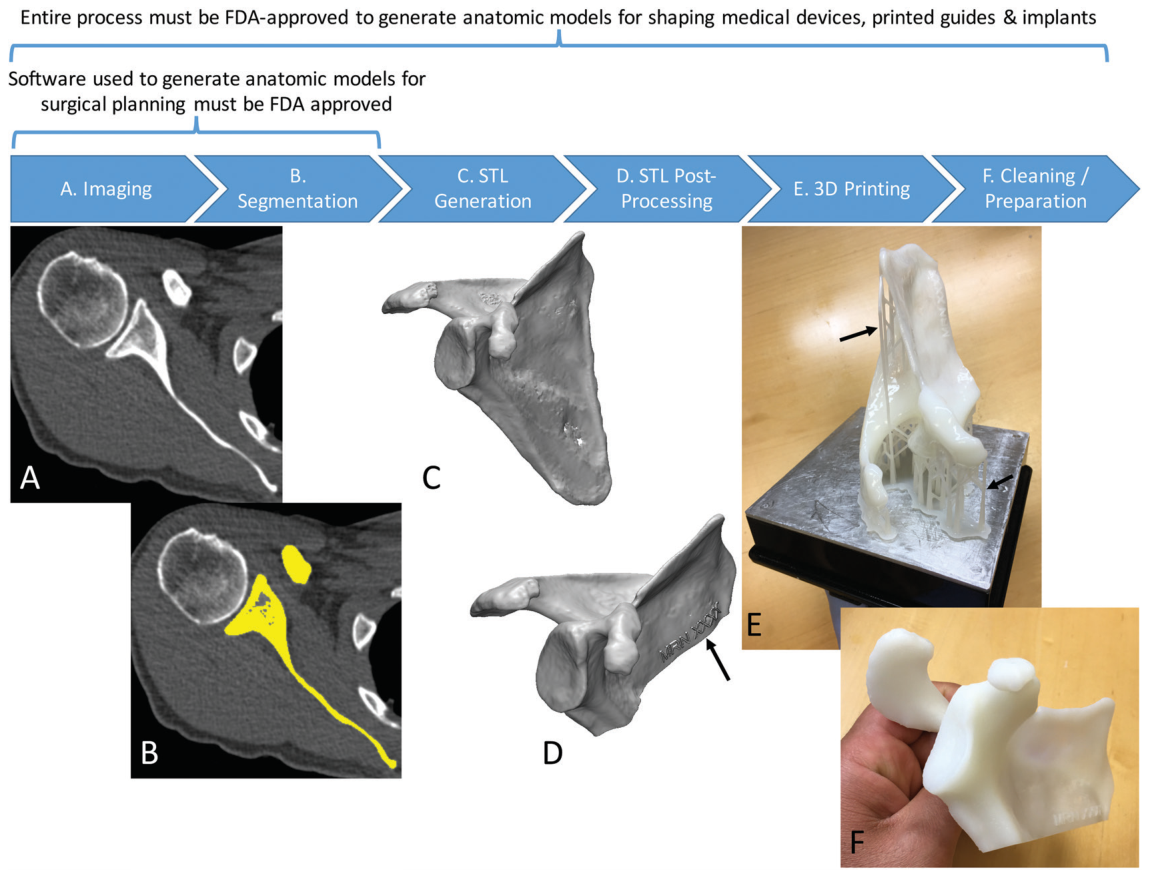
Figure 4. Figure 4. Process of 3D printing of tissue models. A, A scapula is imaged with non–contrast material–enhanced CT. B, The scapula (yellow) is then segmented from the CT image. C, A surface enclosing the segmented voxels—that is, the Standard Tessellation Language (STL) model—is created. D, The STL model is typically postprocessed—for example, to trim unnecessary portions and add identifiers (arrow). E, The designed model is then printed by using a 3D printer. F, The printed model is cleaned to remove support structures, such as the scaffold (arrows in E) generated by the stereolithog raphy printer in this example.解説: 組織モデルを3Dプリンティングするプロセスを示しています。Aは非造影CTで画像診断された肩甲骨、BはCT画像からセグメンテーションされた肩甲骨、Cはセグメンテーションされたボクセルを囲むSTLモデル、Dは後処理されたSTLモデル、Eは3Dプリンターで造形中のモデル(サポート構造付き)、Fは洗浄後のプリントモデルです。医療機器の成形やインプラントのための解剖学的モデル生成にはFDAの承認が必要な全プロセスが示唆されています。
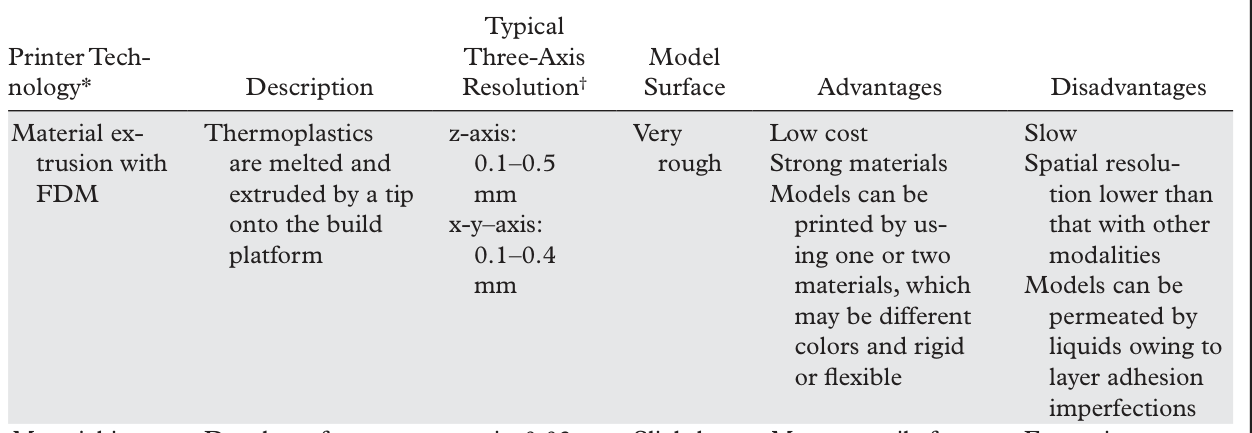
Table 1. Table 1: Commonly Used Medical 3D Printing Technologies解説: 医療分野で一般的に使用される3Dプリンティング技術についてまとめた表の一部です。FDM技術の概要、典型的な3軸分解能、モデルの表面性状、利点、欠点について記述されています。
Table 2. Table 2: Reported Accuracies of Dimensions Measured on 3D Printed Models versus Design STL Models解説: 3Dプリントモデルの寸法と設計STLモデルの寸法を比較した、報告されている精度に関する表の一部です。異なる研究、プリントモデル、測定技術、プリンティング技術における絶対差と相対差が示されています。
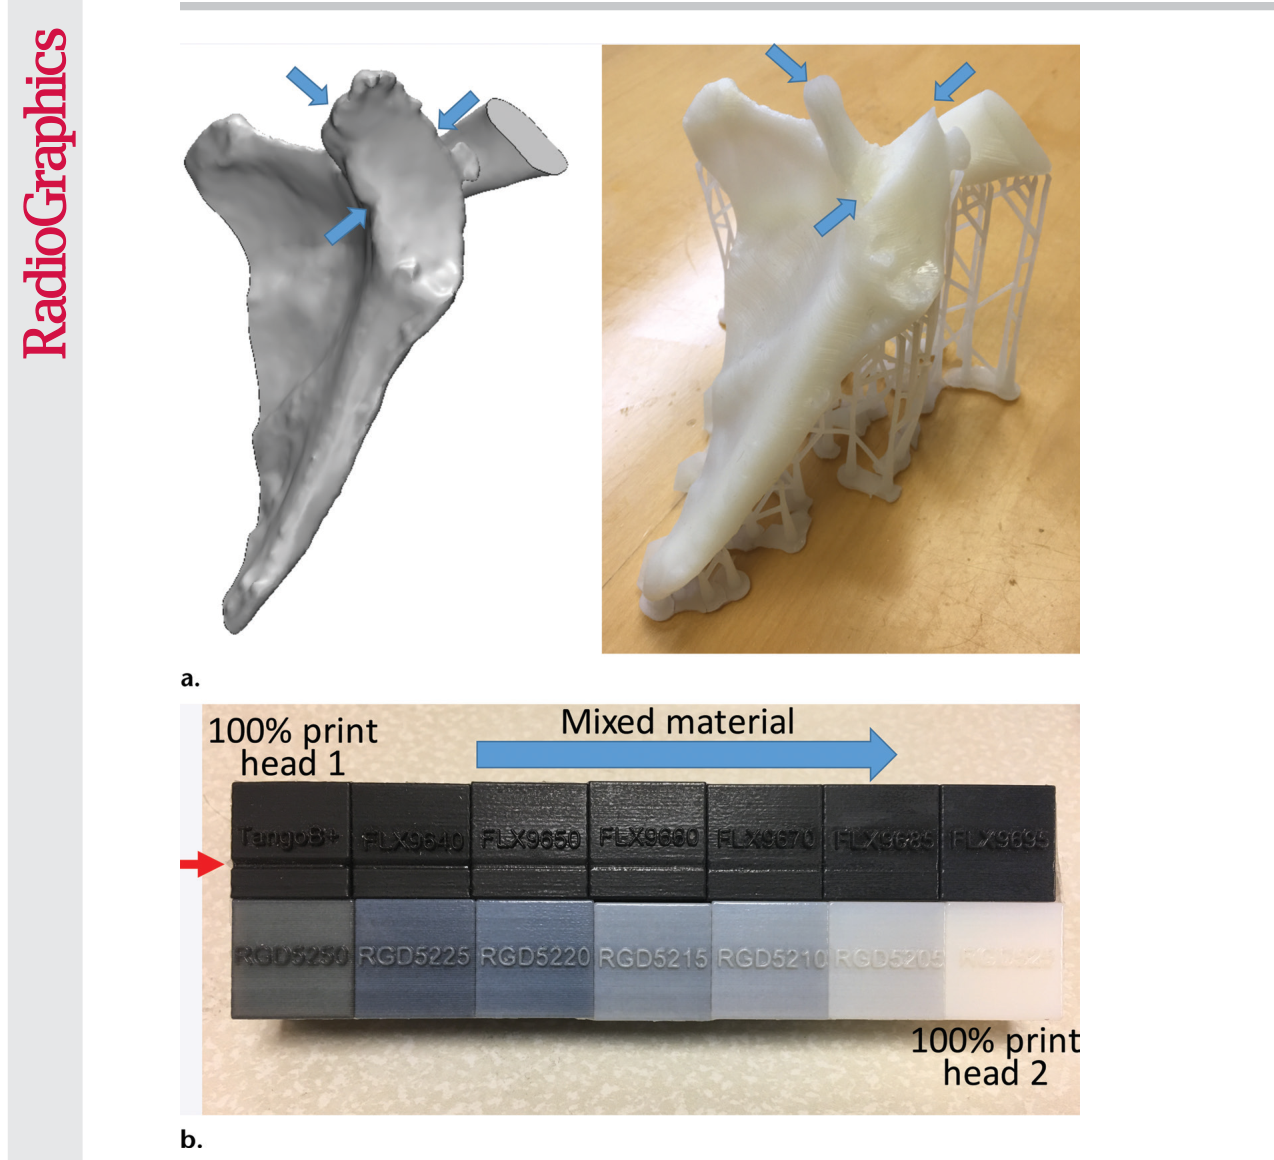
Figure 5. Figure 5. (a) STL model of the scapula (left) shows that the fabrication (right) created by using a bottom-up desktop SLA printer (Form 1+; Formlabs, Cambridge, Mass) does not include the glenoid cavity (arrows). Such failures occur owing to dirty optics or mechani cal forces exerted on the model during printing. (b) Printing failure involving a material jetting printer with two print heads (Objet Connex 2; Stratasys), each loaded with one material. The black cube at the top far left corner was printed with 100% of material 1. The cube in the far right corner at the bottom was printed with 100% material 2, with the cubes between them printed with mixtures of the two materials in different proportions. Use of the 100% black material in a faulty print head led to a depression (red arrow) where the model height was 19.54 mm as opposed to the model design height of 20 mm. The model created with the fully white material measured 19.99 mm in height. The cubes containing increasing amounts of the material printed with the correctly functioning head have progressively less error.解説: 3Dプリンティングにおける失敗例を示しています。(a) 肩甲骨のSTLモデル(左)と、ボトムアップ式SLAプリンターで造形されたモデル(右)で、関節窩(矢印)が含まれていないことが示されています。このような失敗は、光学系の汚れやプリント中の機械的力に起因します。(b) 2つのプリントヘッドを持つマテリアルジェッティングプリンターでのプリント失敗例で、欠陥のあるプリントヘッドを使用した材料で作成された部分にへこみが生じ、モデルの高さが設計値に達していないことが示されています。
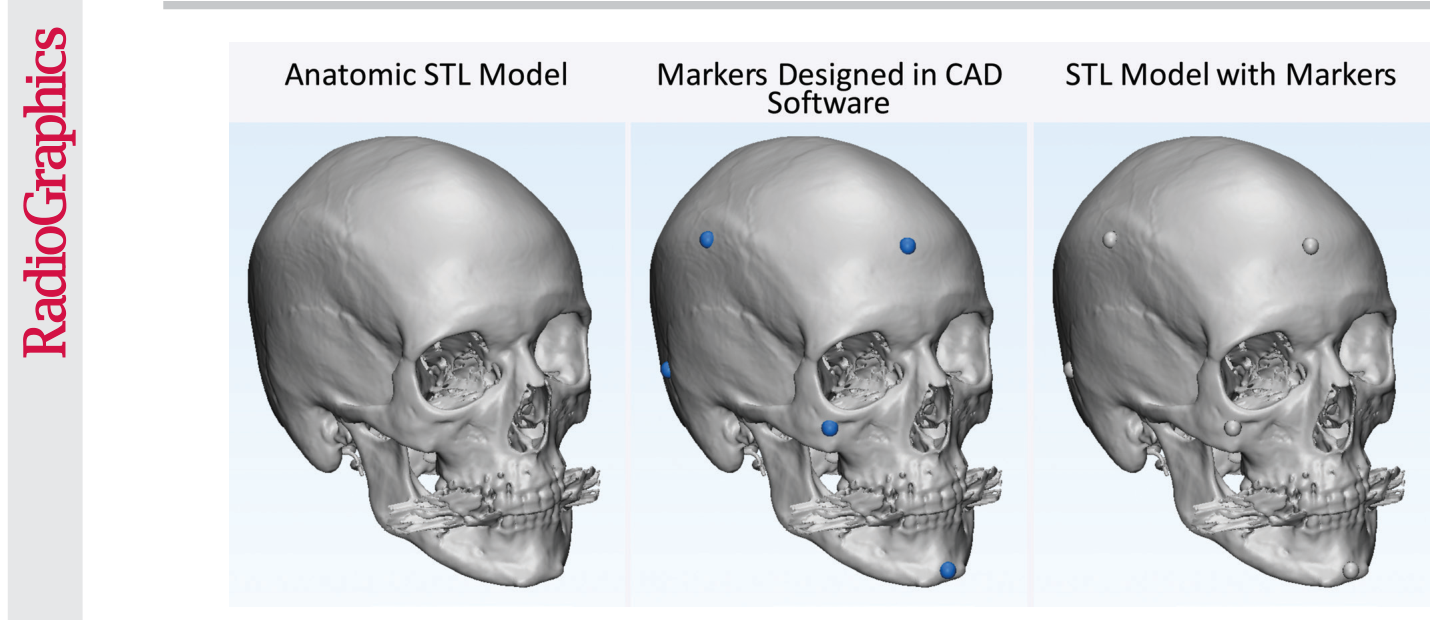
Figure 6. Figure 6. Testing printer accuracy by using anatomic models. By using computer-aided design (CAD) software, a skull STL model (left) is augmented with fiduciary markers (blue spheres) (middle) to yield a new STL model (right). The locations of the markers on the printed model can be measured with, for example, calipers or automated coordinate-measuring machine systems and compared with the locations of the markers on the designed STL model.解説: 解剖学的モデルを用いたプリンター精度のテスト方法を示しています。CADソフトウェアを使用して、頭蓋骨STLモデル(左)にフィデューシャルマーカー(青い球体)(中央)を追加し、新しいSTLモデル(右)を作成します。プリントモデル上のマーカーの位置は、設計されたSTLモデル上のマーカーの位置と比較して測定できます。
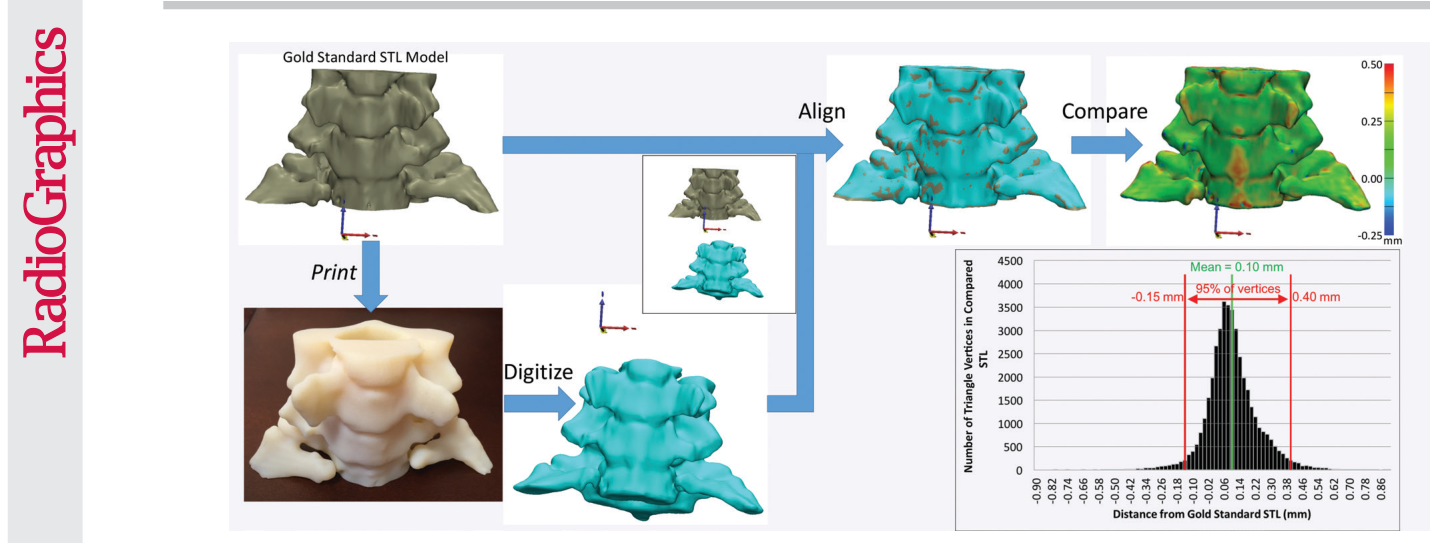
Figure 8. Figure 8. Digitization and alignment of a 3D printed model. The original STL model is printed as a 3D object, which is subse quently digitized—by using CT in this example. After the original and digitized STL models are aligned, the distances between the vertices of one STL model—in this example, the digitized version—and the surface of the other model—in this example, the original STL version—can be calculated. The reference-standard STL model can be an arbitrary model to test printer accu racy or a digitized (eg, laser-scanned) model of a cadaveric specimen to establish the accuracy of the entire process, including the technique used to image the specimen and the segmentation technique used to create the model.解説: 3Dプリントモデルのデジタル化とアラインメントのプロセスを示しています。オリジナルのSTLモデルから3Dオブジェクトがプリントされ、その後CTなどの方法でデジタル化されます。オリジナルとデジタル化されたSTLモデルがアラインメントされた後、一方のSTLモデル(デジタル化版)の頂点と他方のモデル(オリジナルSTL版)の表面との間の距離が計算され、差が可視化されます。グラフは、比較された三角形頂点の数とゴールデンスタンダードSTLからの距離の分布を示しており、平均差と95パーセンタイルの差が示されています。
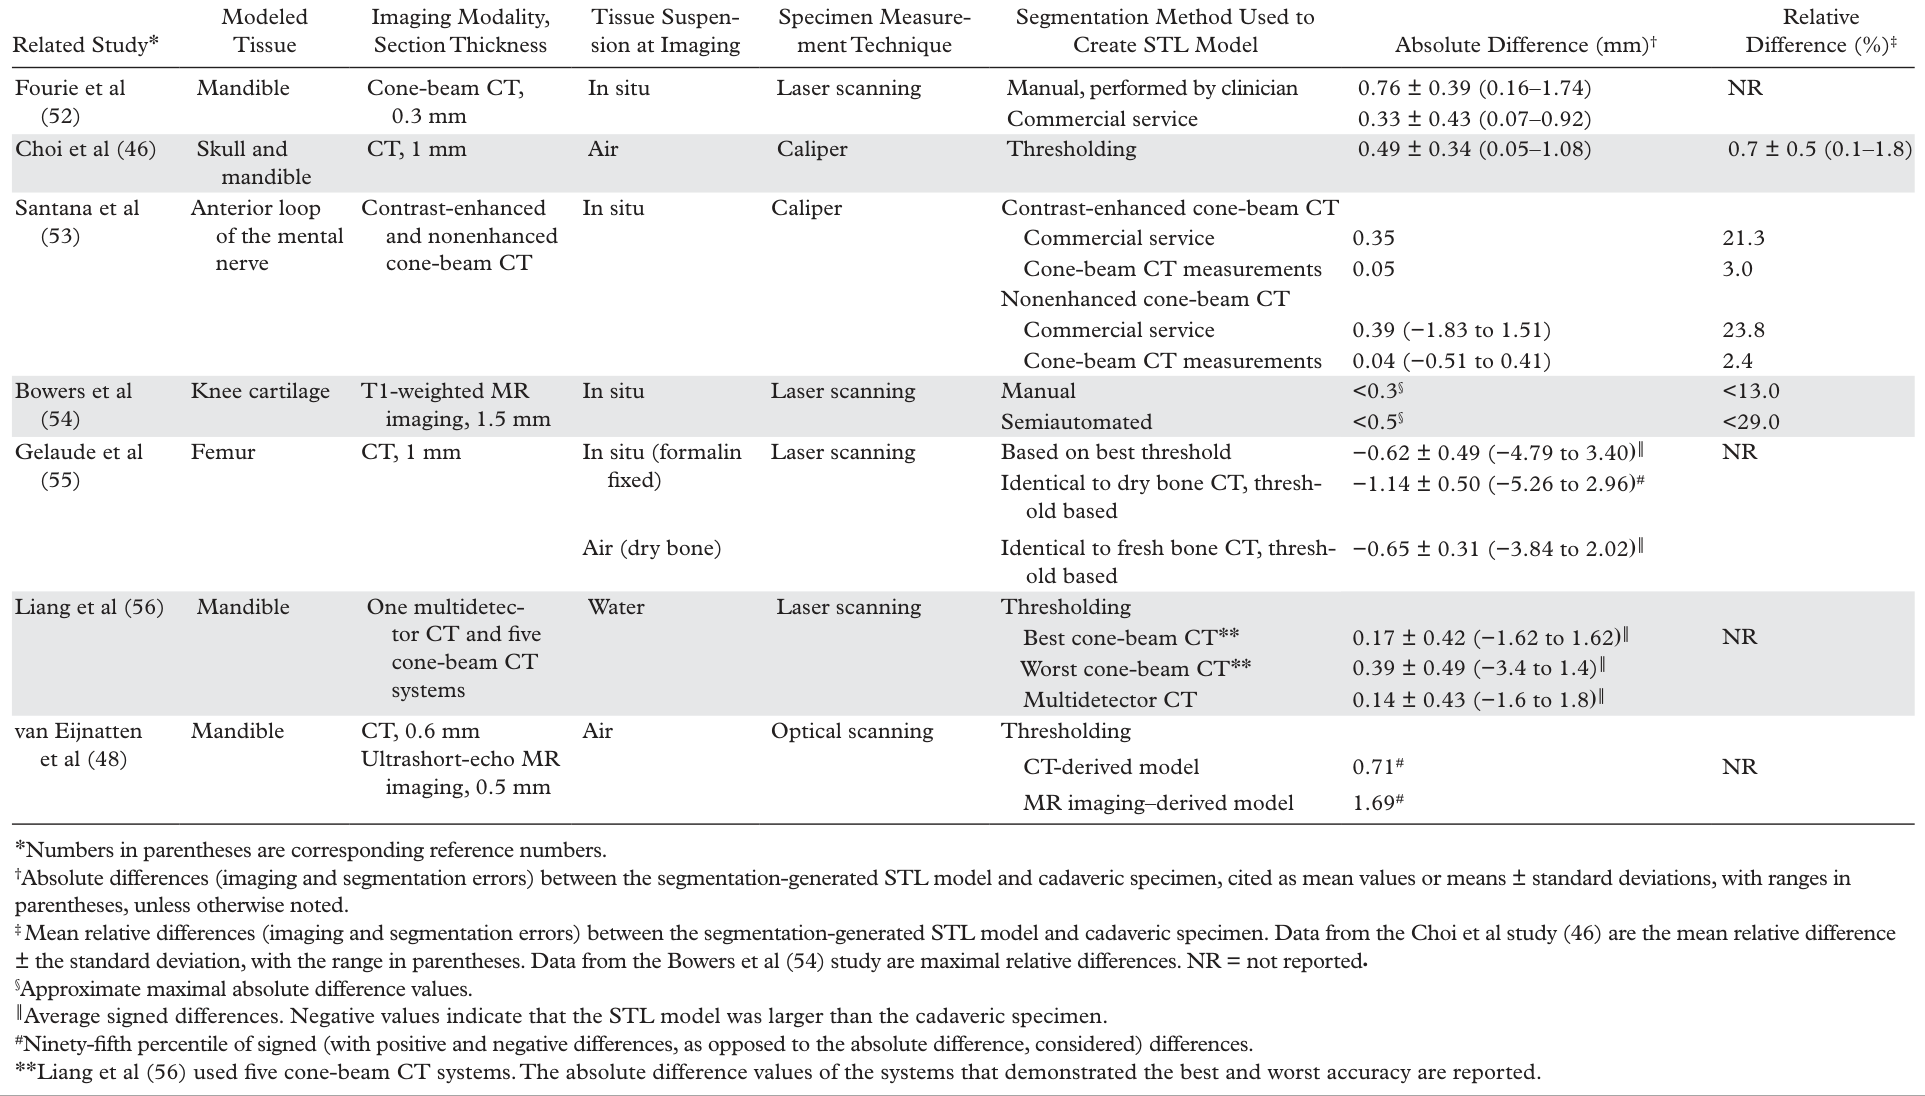
Table 3. Table 3: Reported Measurement Accuracies of 3D Printed Bone Models, as Compared with Cadaveric Specimens解説: 遺体標本と比較した3Dプリント骨モデルの測定精度について報告されたデータの一部をまとめた表です。異なる研究、モデリングされた組織、画像診断モダリティ、組織の懸濁状態、測定技術、プリンティング技術における絶対差と相対差が示されています。
Table 4. Table 4: Reported Accuracies of STL Bone Models, as Compared with Cadaveric Specimens解説: 遺体標本と比較したSTL骨モデルの報告された精度に関する表です。異なる研究、モデリングされた組織、画像診断モダリティ、組織の懸濁状態、標本測定技術、STLモデル作成に使用されたセグメンテーション方法における絶対差と相対差が示されています。
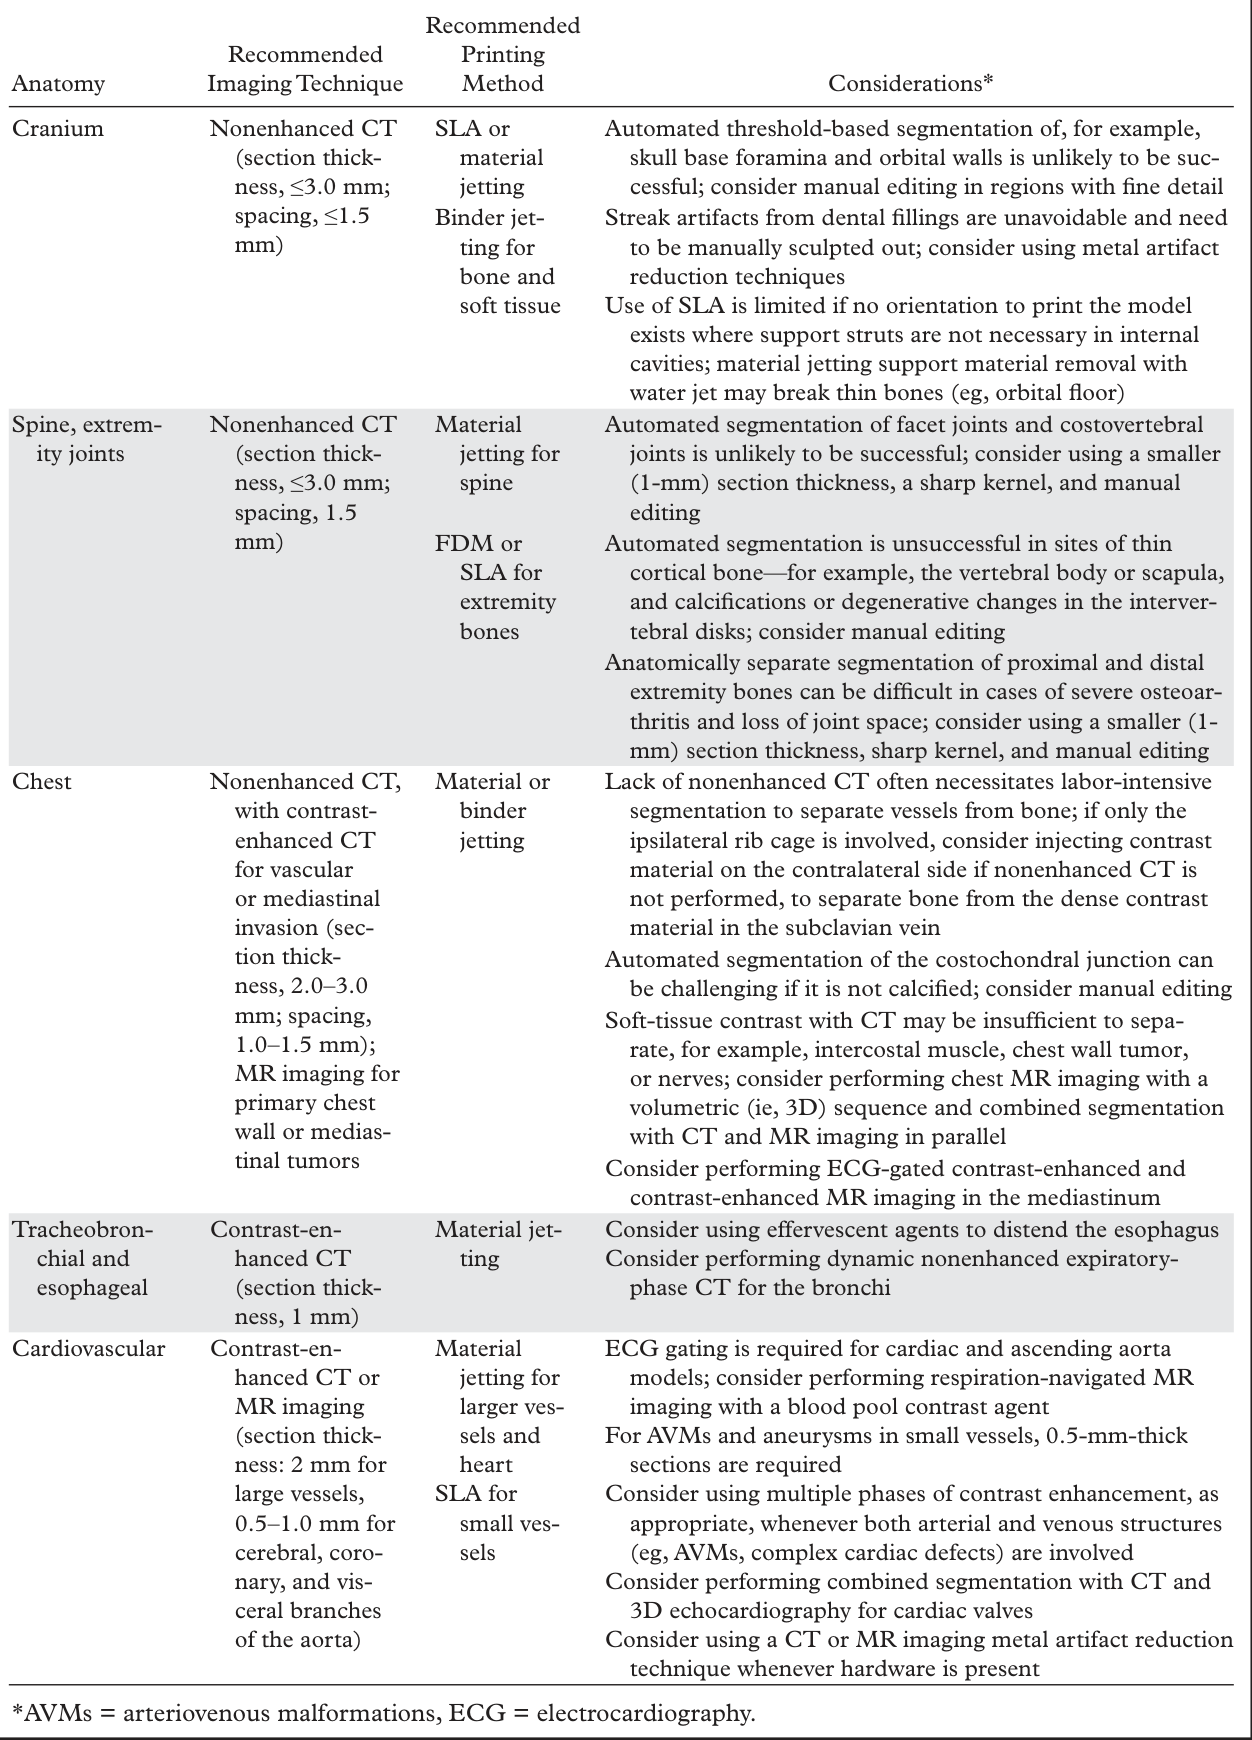
Table 5. Table 5: General Guidelines and Practical Considerations Regarding Imaging and Segmentation for Common 3D Printing Indications解説: 一般的な3Dプリンティングの適応症に対する画像診断とセグメンテーションに関する一般的なガイドラインと実践的考慮事項について記述された表の一部です。頭蓋、脊椎、胸部、気管気管支・食道、心血管系といった各解剖学的部位に対して推奨される画像診断技術やプリンティング方法、および特記事項が簡潔に示されています。ただし、画像は表の全体ではなく一部のみを示しています。⚠ 自動抽出画像の検証で一致を確認できませんでした。正確な内容は元論文のTable 5をご参照ください。
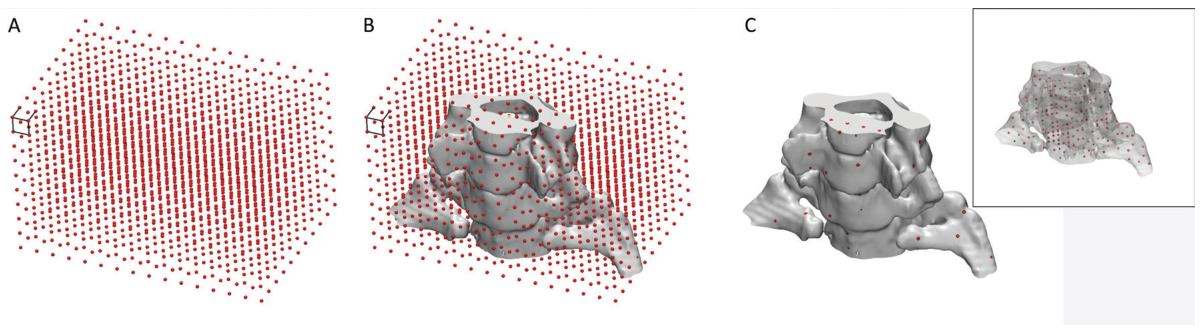
Figure 9. Figure 9. Conceptual illustration of the use of internal fiduciary markers to establish the dimensional accuracy of a 3D printed model. A, A grid of markers—0.7-mm–diameter spheres with 7-mm spacing between them—covers, B, the extent of the model. C, Markers that fall within the solid part of the model and made of material that has similar mechanical properties but different radiodensity compared with the remainder of the model can be printed. An image of the model with different marker radiodensity compared with the radiodensity of the remainder of the model can be used to extract coordinates of the markers and compare these coordinates with locations on the designed grid to establish the dimensional accuracy of the model. Inset: All markers within the model can be seen because the model is plotted as a semitransparent object.
Figure 10
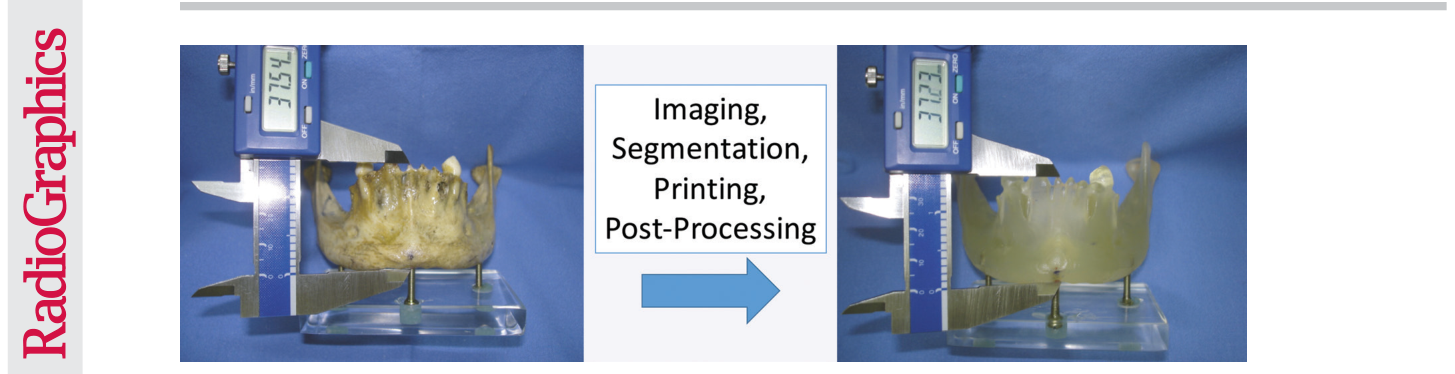
Figure 10. Figure 10. Comparison of cadaveric versus 3D printed model measurements to assess the accuracy of 3D printing. A dry cadaveric mandible (left) and 3D printed model of the mandible (right) derived from CT imaging of the dry bone show that manual caliper measurements of anatomic landmarks on both the dry bone and the printed model can be used to establish the accuracy of the entire 3D printing process, including the imaging and segmentation steps (eg, with use of particular Hounsfield unit thresholds for segmentation). This accuracy will not apply to the printing of other, for example, less dense or thick bones because a different threshold may be required for the segmentation. (Reprinted, with permission, from reference 45.)
Figure 11
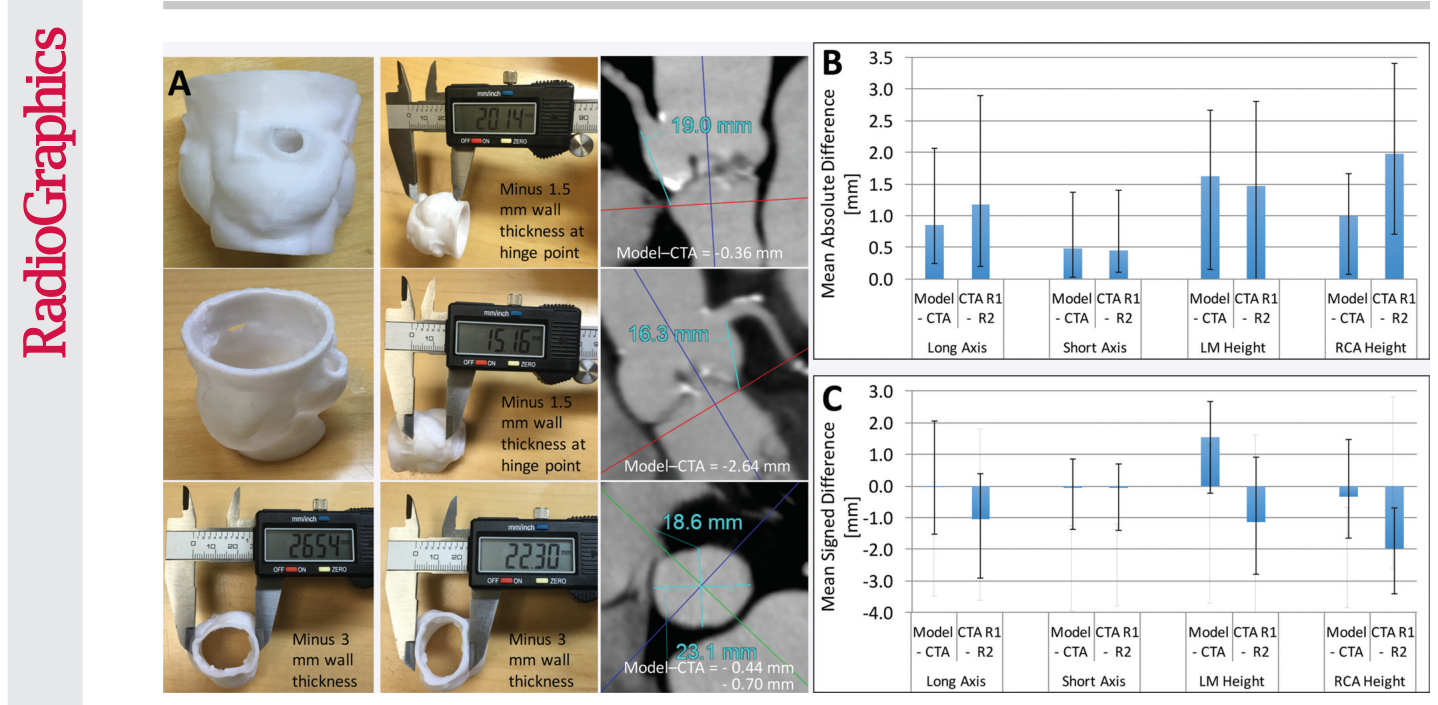
Figure 11. Figure 11. Printed 3D model versus image measurements of the aortic valve. A, Caliper measurements performed on a 3D printed model of the aortic valve and radiologist measurements performed on source CT angiograms (CTA) demonstrate individual differences in coronary artery heights and aortic annulus diameters between the model and angiograms. B, Graph data show that in 10 patients, mean absolute differences in these measurements were within the range of interobserver variability in CT angiographic measurements. C, Graph data show that the use of mean signed differences led to an overestimation of the accuracy of the 3D printing process, as the positive and negative differences for different patients canceled each other. Error bars indicate the maximal differences across the 10 patients. LM = left main coronary artery, RCA = right coronary artery, R1 = reader 1, R2 = reader 2.
Figure 12
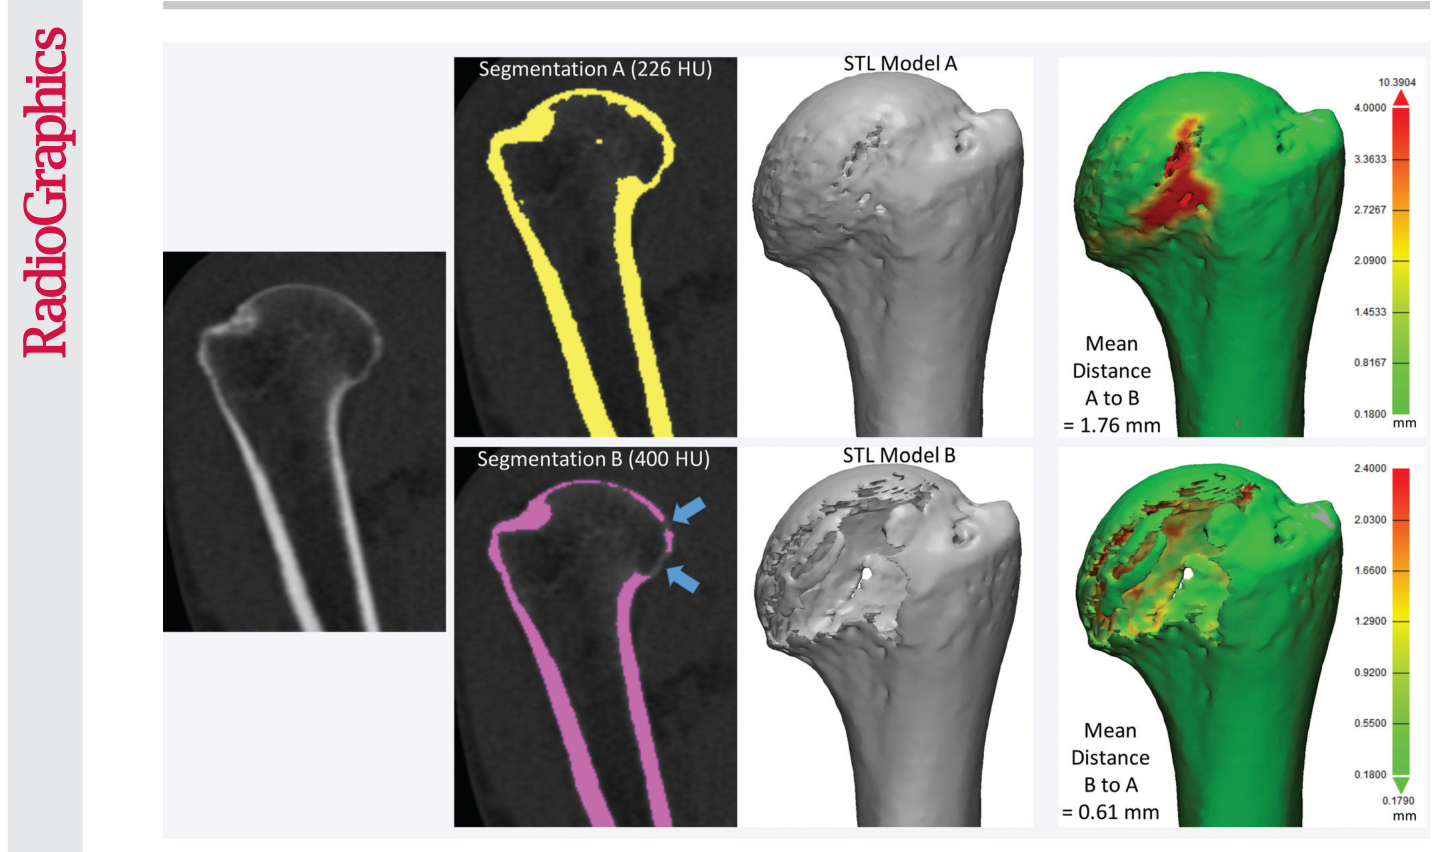
Figure 12. Figure 12. Humerus segmented from a CT image by using attenuation thresholds of 226 and 400 HU. The two resultant 3D models differ in shape, as the model segmented with the higher threshold is missing portions of the humeral head (blue arrows). Distance metrics (green models, far right) did not enable quantification of the difference between the two models; different average, minimal, and maximal distances were measured, depending on which model was being compared with another model.
Figure 13
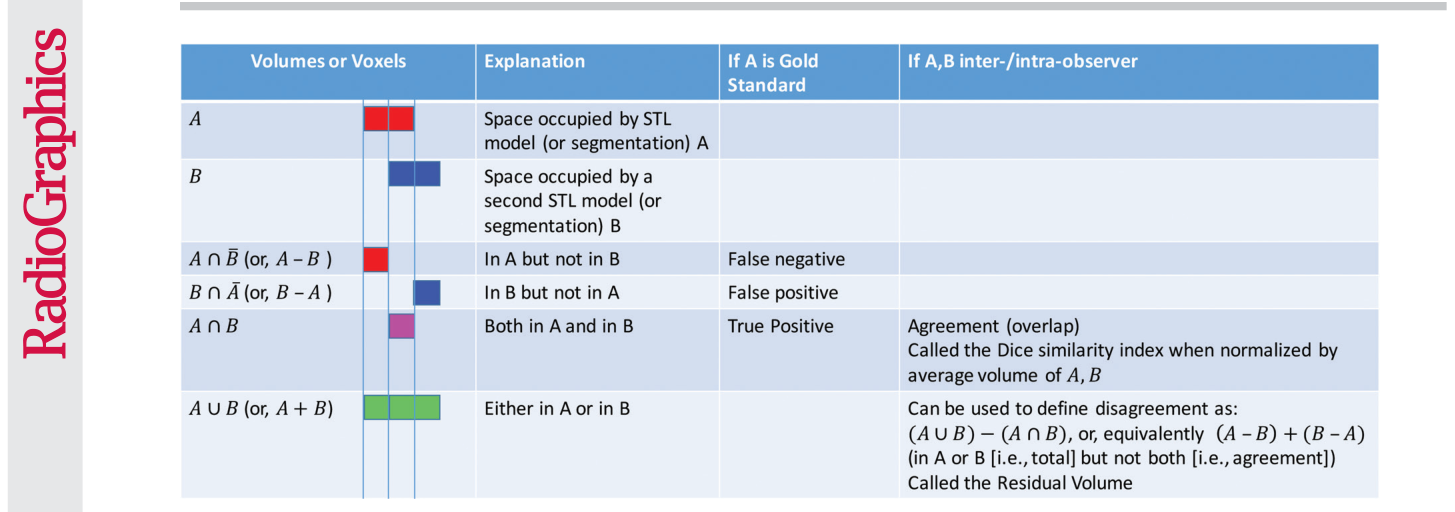
Figure 13. Figure 13. Set theory operations that are useful for characterizing differences between models generated from images for 3D printing. The operations of volumes (or voxel collections) in set theory notation and shorthand (in parentheses), as well as visual color depictions of the volumes corresponding to the operations, are listed in the first (far left) column. For example, the volume of space (or voxels) belonging to model A is depicted in red, and that belonging to model B is depicted in blue.
Figure 14
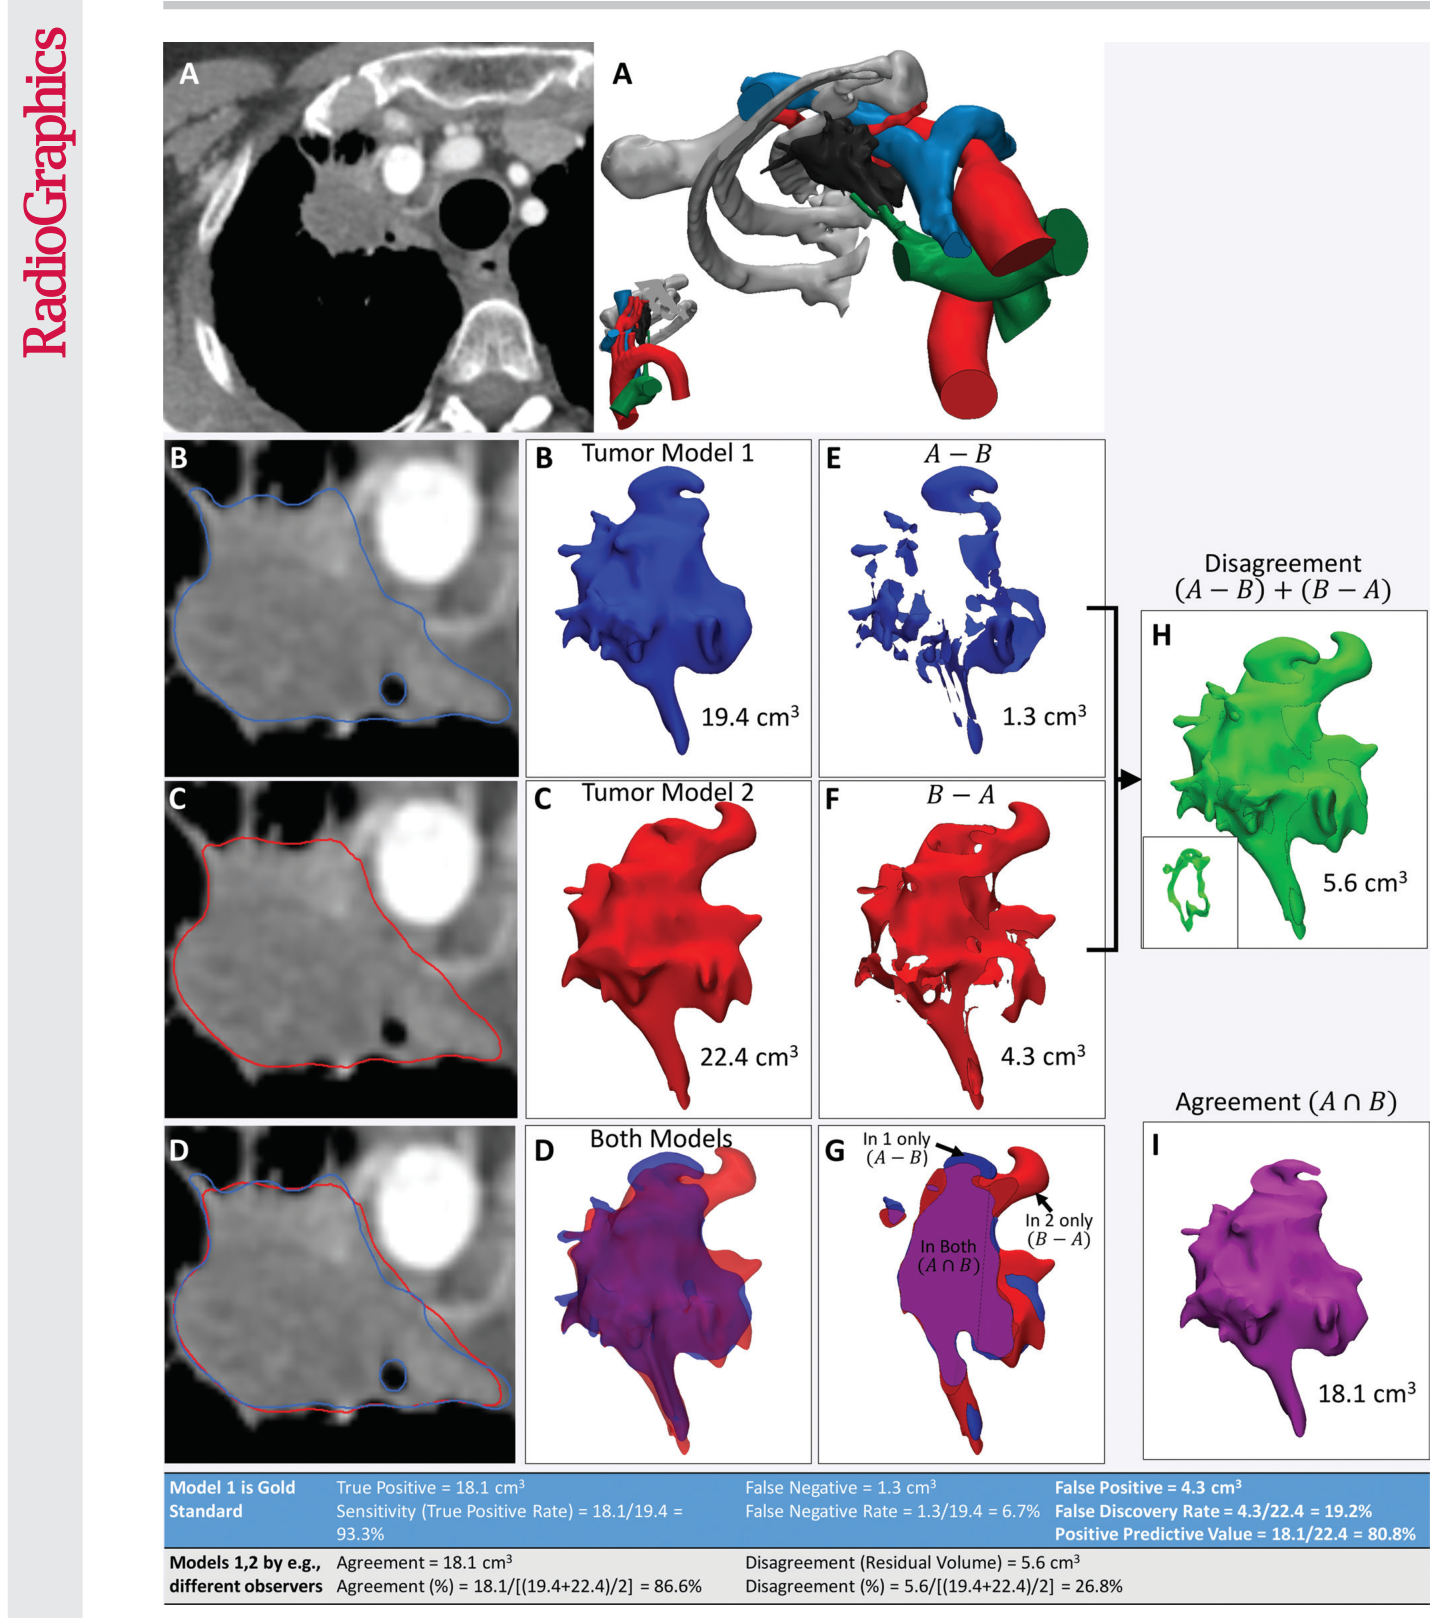
Figure 14. Figure 14. Use of agreement and disagreement operations to compare different segmentation methods. A, Example assessment of similarities and differences in lung apex tumor models (right) derived from axial contrast-enhanced CT images (left). B, C, The tumor segmented by two independent readers (B and C, respectively) and seen on axial CT images (left) and 3D visualization models (right) is qualitatively different. D, Both models, seen superimposed on the axial CT image (left) and semitransparent 3D visualization models (right), are cut through the model in G. E, F, Morphologic operations are used to define differences quantitatively. For example, the model in, E, shows the tissue considered by one reader to be in the model, in disagreement with the interpretation of the second reader. The model in, F, shows the tissue considered by the second reader to be in the model, in disagreement with the interpretation of the first reader. H, I, Disagreement, H, and agreement, I, can be used to define diagnostic accuracy or reproducibility parameters (Table at bottom). The inset in, H, shows a section through the volume that is empty where there is agreement.
Figure 15
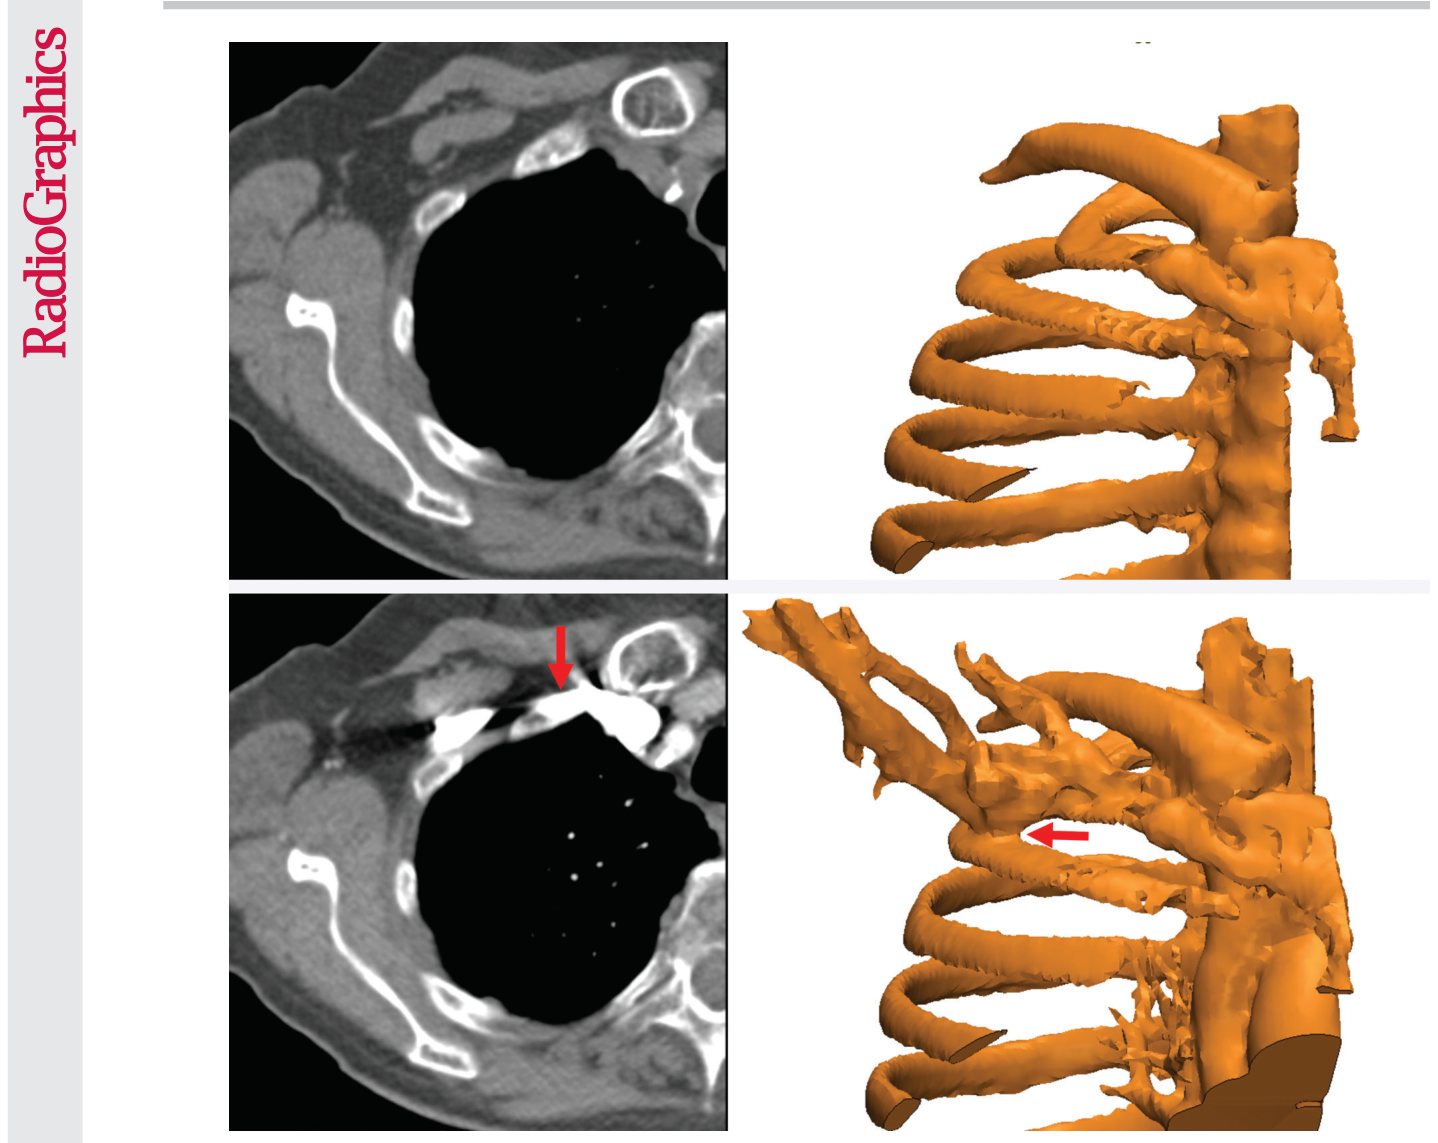
Figure 15. Figure 15. Segmentation complicated by contrast enhancement. Three-dimensional models of the ribs (right) were created from axial nonenhanced (top left) and contrast-enhanced (bottom left) CT images. The proximity of the subclavian vein, which is filled with high-density intravenously injected contrast material (bottom), precludes separation of the bone and vasculature (red arrows).
Figure 16
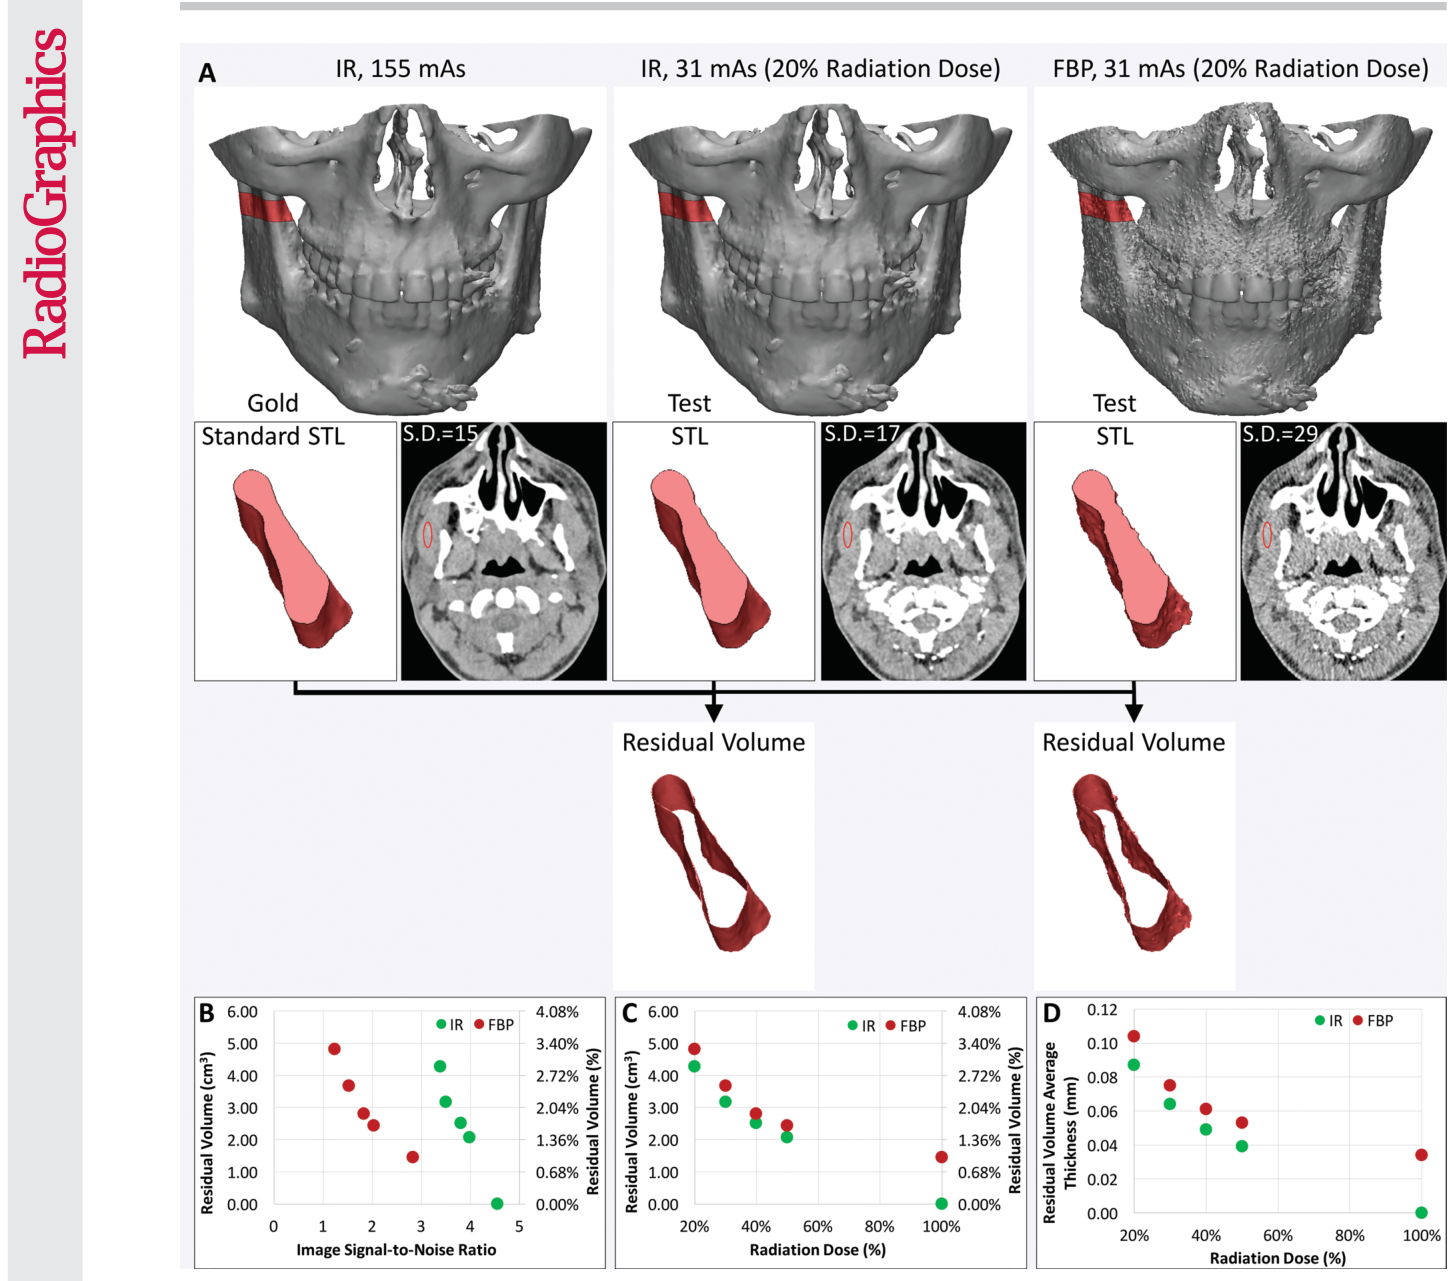
Figure 16. Figure 16. Use of residual volume measurements to assess the CT radiation dose reduction process for 3D printing of bone. A, The residual volume is used to compare the effect of reducing the CT radiation dose with iterative reconstruction (IR) versus filtered back- projection (FBP) reconstruction for 3D printing of the maxillofacial bone. Top: The residual volume is the red shell around the bone on the reference-standard model derived from 155-mAs IR images (left), and on each test STL model derived from images acquired with a reduced radiation dose (middle and right). Bottom: A small portion of the mandible is shown in pink to aid in visualizing the residual volume. S.D. = standard deviation. B, C, Despite the higher signal-to-noise ratio of the IR images, B, calculated from the mean and standard deviation of the muscle attenuation (in Hounsfield units), the IR and FBP reconstruction performed quite similarly in terms of residual volume at all given reduced doses, C. D, The average thickness of the residual volume was calculated to quantify the average difference in the dimensions of the bone derived from each image dataset.
Figure 17
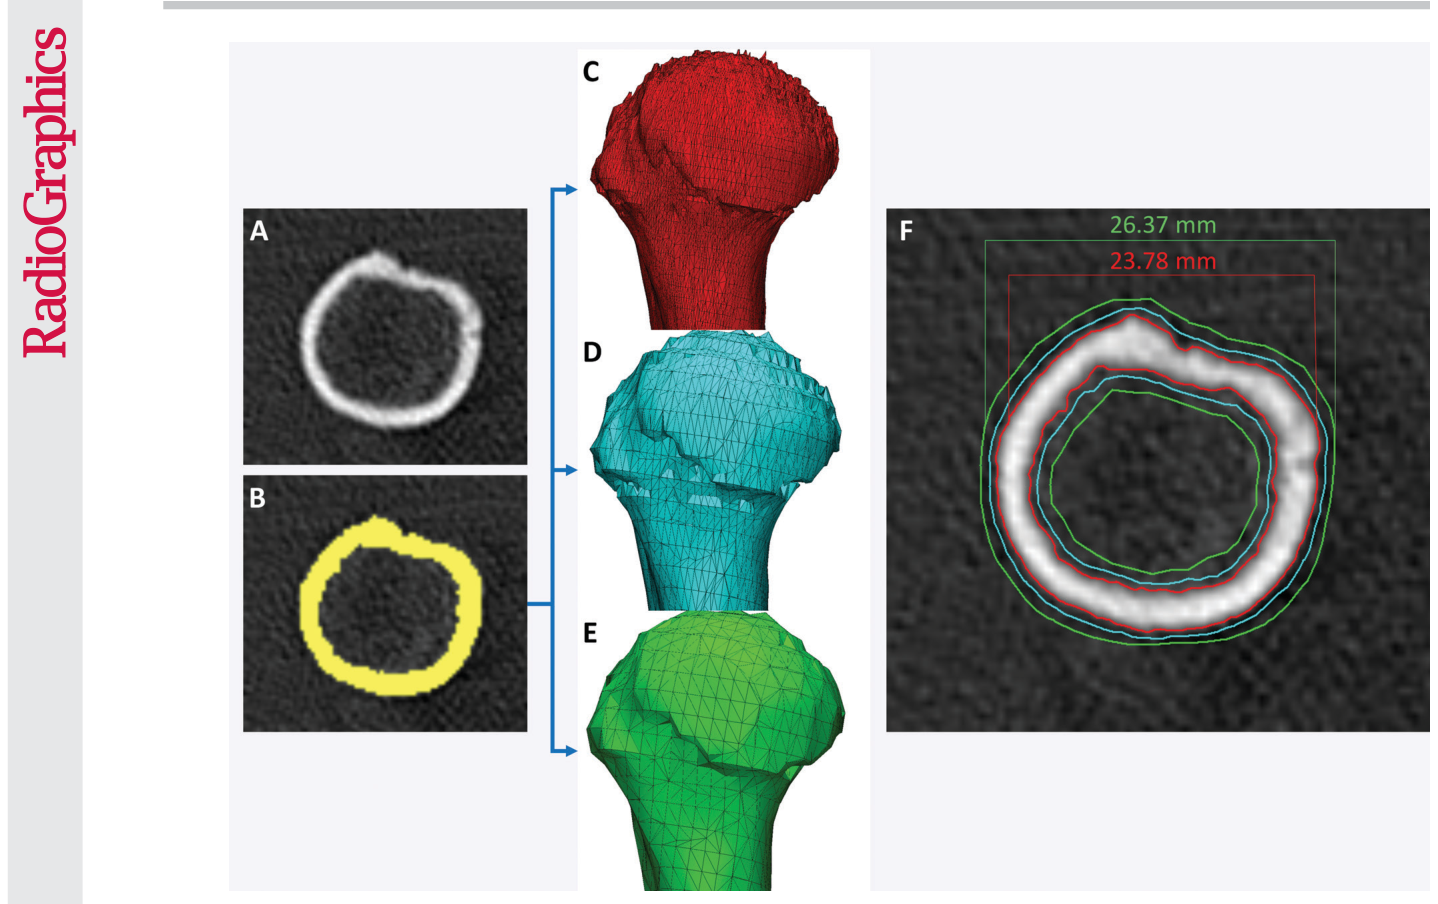
Figure 17. Figure 17. Differences in models based on different parameters used to generate the STL model from a segmentation. A, B, Axial CT image of a humerus, A, segmented with a 400-HU attenuation threshold, B, yields three STL models created by using different setting options (optimal, C; medium, D; and low, E) with use of one software (Mimics 18.0; Materialise NV). C–F, Differences among the models are seen in terms of triangle counts, C–E, and are nearly 3 mm in size, F.
Figure 18
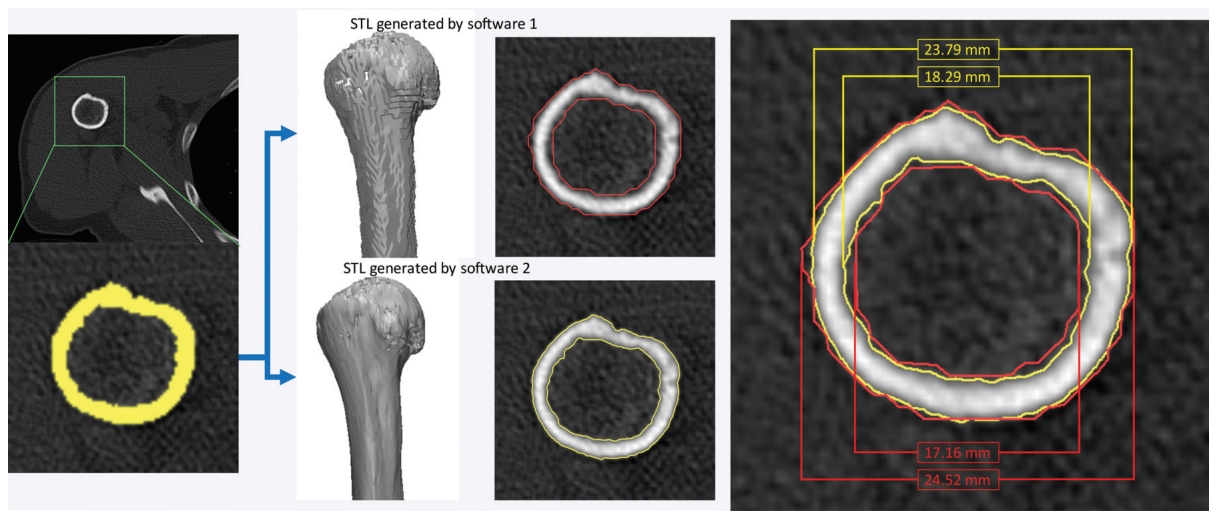
Figure 18. Figure 18. STL model generation algorithms provided in two software products (Mimics 18.0 and OsiriX [Pixmeo SARL, Bernex, Switzerland]). With both software products, axial CT images were loaded and identically segmented (yellow, lower left image) by using an attenuation threshold of 226 HU. The resulting STL models generated by using the default settings for each software differed by 0.73 mm for the external bone surface measurement and by 1.13 mm for the internal surface measurement.
Figure 19
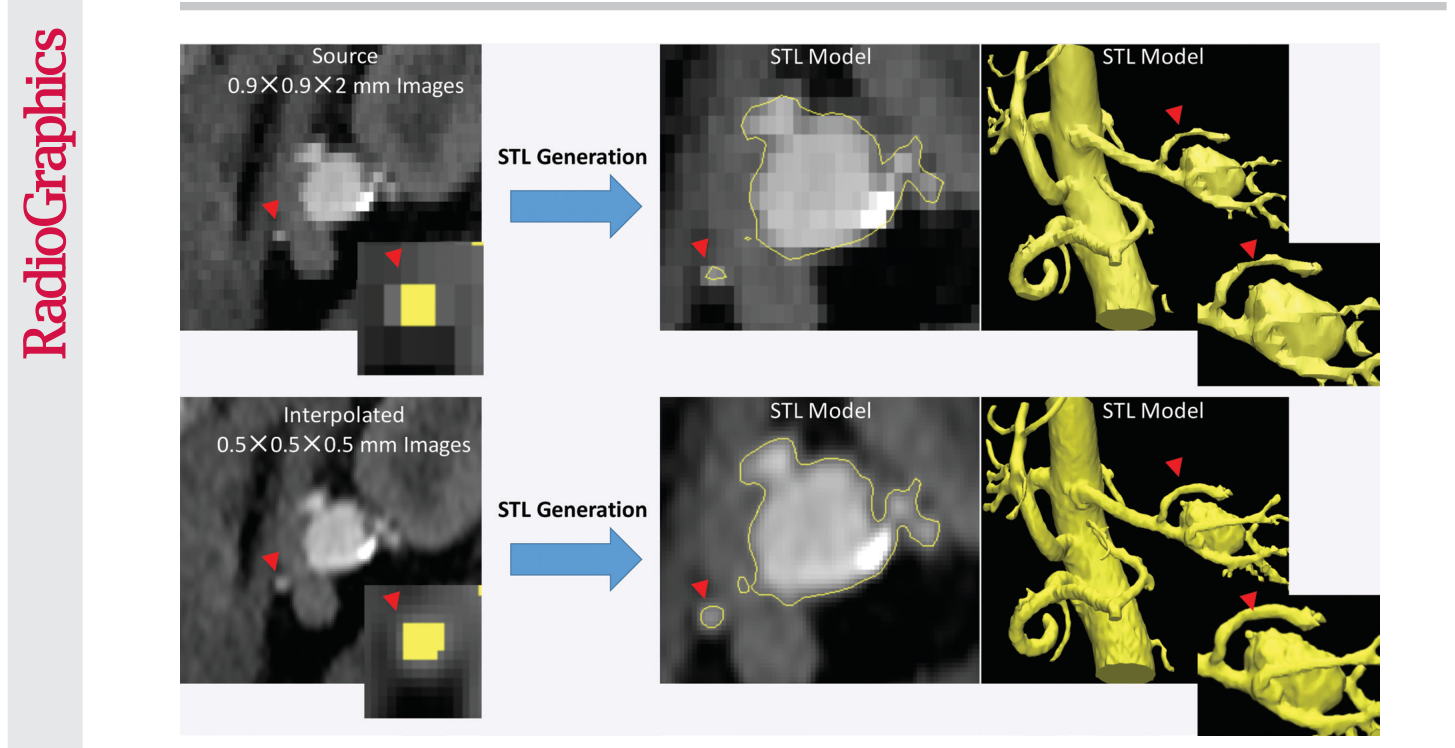
Figure 19. Figure 19. STL models of a renal aneurysm derived from a CT angiogram. Top: The lumen on the STL model generated from a low–spatial-resolution CT angiogram is blocky and flattened for a small renal artery (arrowheads at top and bottom). The inset (far left) shows the segmented voxels for the artery in the yellow overlay. Bottom: The same CT angiogram interpolated to a higher voxel count (0.5-mm isotropic voxels) without alteration of the image information enables the STL generation algorithm to operate more optimally with identical thresholding segmentation and thus yields a more appropriate model of small arterial lumens.




コメントを残す