どうも、Beyond the Pixelです。パーキンソン病の対象者は、小刻み歩行や歩行の不安定さといった症状に悩まされることが多く、日常生活の質や転倒リスクに大きく影響します。理学療法士による歩行指導は有効ですが、常に専門家がそばにいるわけではありません。そこで、ウェアラブルデバイスを用いた自動フィードバックが注目されています。本記事では、足の裏に装着するセンサー付きインソールが、パーキンソン病の対象者の歩行をどのように改善するかを探った画期的な研究についてご紹介します。
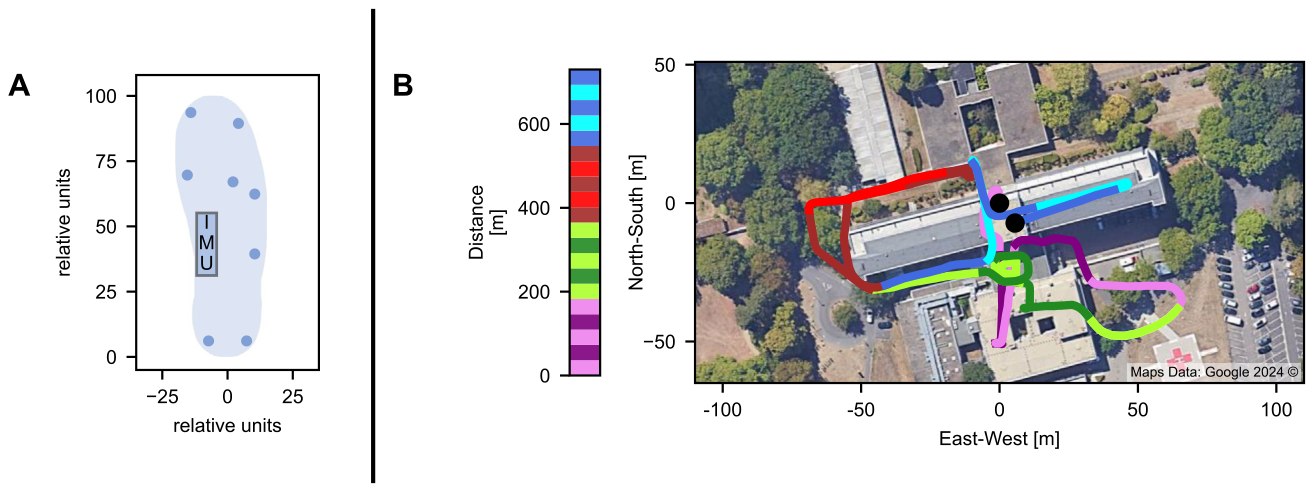
Figure 2. Fig. 2 Set-up of the sensors in the insole and the walking course. A Layout of a right insole with the coordinates of the eight force sensors (blue dots) and the IMU (blue square) B Exemplary coordinates calculated from the IMU-measured acceleration data with start and end (black dots) of the walking course. Color indicates the distance covered解説: Aは、センサー付きインソールのレイアウトを示しており、8つの感圧センサー(青い点)とIMU(青い四角)の位置が示されています。Bは、IMUで測定された加速度データから計算された歩行コースの座標例で、歩行の開始と終了(黒い点)が示されており、色は移動距離を表します。
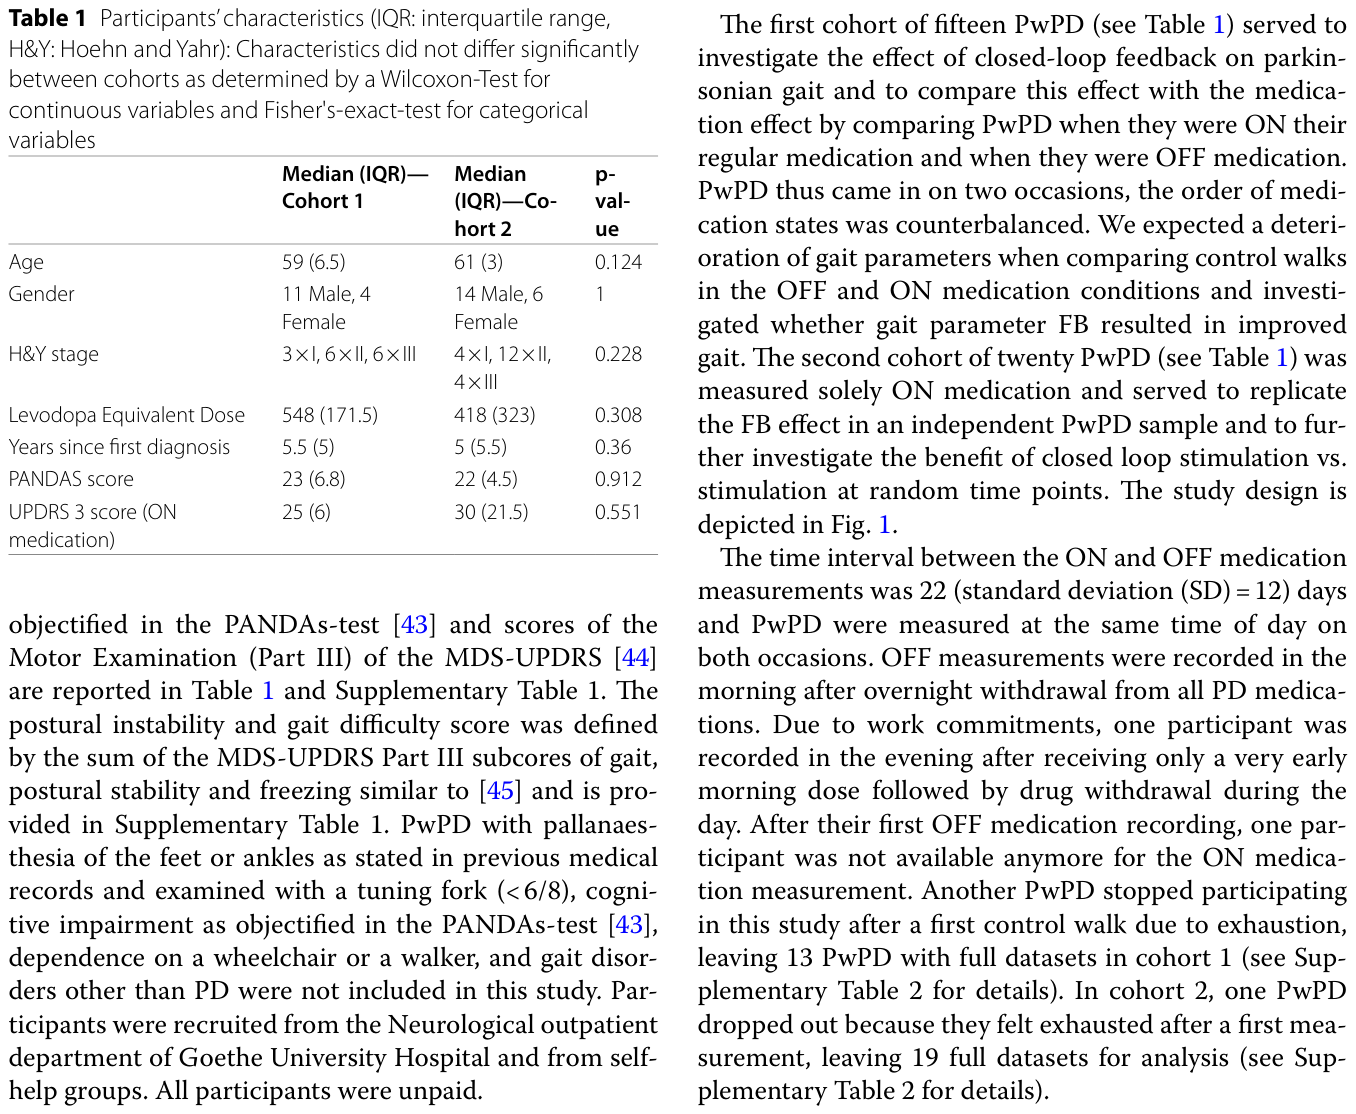
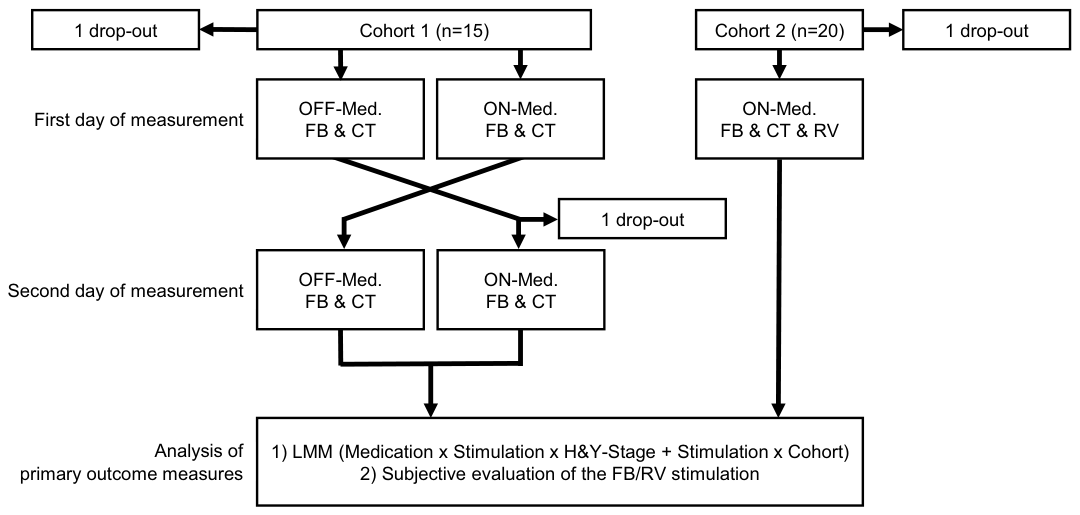
Table 1. Table 1 Participants’ characteristics (IQR: interquartile range, H&Y: Hoehn and Yahr): Characteristics did not differ significantly between cohorts as determined by a Wilcoxon-Test for continuous variables and Fisher's-exact-test for categorical variables解説: 参加者の特性(年齢、性別、Hoehn and Yahrステージ、レボドパ等価用量、診断からの年数、PANDASスコア、UPDRSパート3スコア)をコホート1とコホート2に分けて示しています。両コホート間で特性に統計的に有意な差は認められませんでした。Figure 1. Fig. 1 Study design. Cohort 1 consisted of PwPD participating both ON and OFF medication (Med.) on separate days in a counterbalanced order. Within each day of measurement, PwPD walked once with feedback (FB) and once without feedback (control: CT) in counterbalanced order. PwPD in cohort 2 participated in ON medication state in FB and CT walks as well as walks with vibration at random time points (RV) in a counterbalanced order. Primary outcome measures included average stride length and heel strike angle of both cohorts and were analyzed in linear mixed models (LMM). The subjective evaluation of the FB/RV stimulation by the PwPD was analyzed using T-tests解説: 本研究の実験デザインを示すフローチャートです。コホート1では、ON薬剤状態とOFF薬剤状態の両方でフィードバックと対照条件の歩行が行われ、コホート2ではON薬剤状態でフィードバック、対照、ランダム振動の歩行が行われました。主要な評価項目が分析されたプロセスが示されています。
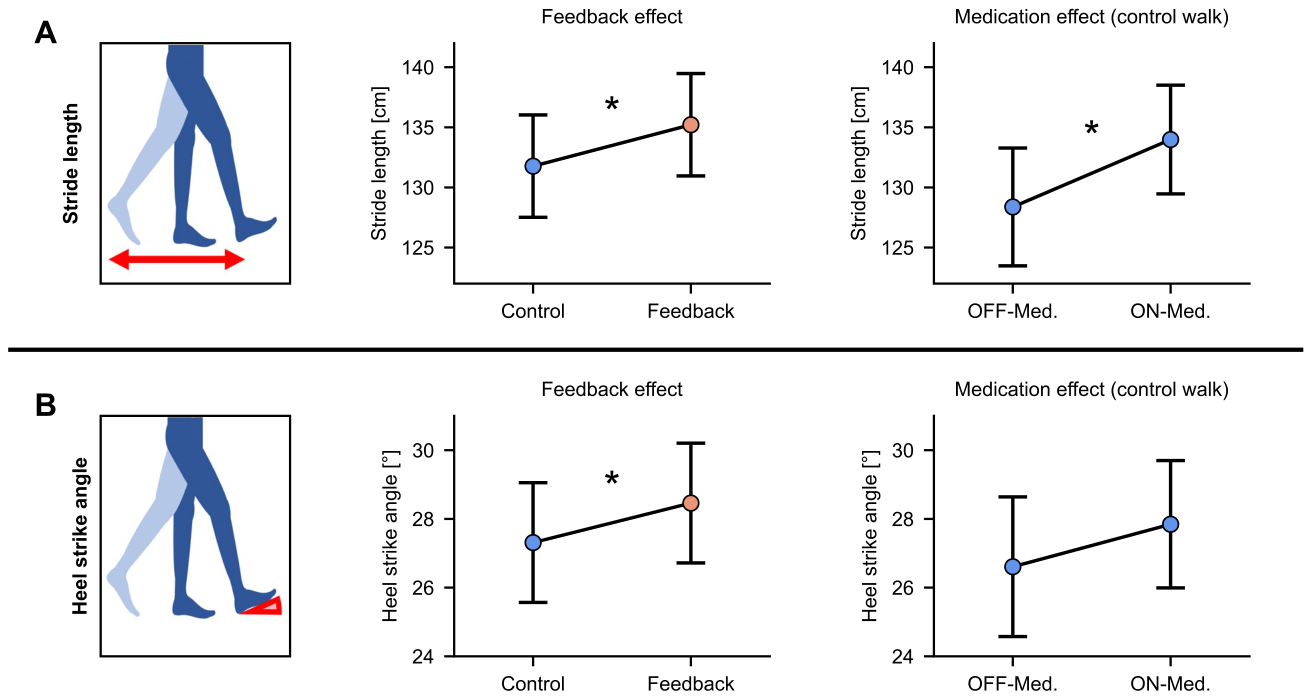
Figure 3. Fig. 3 Feedback and medication improve average stride length (A) and heel strike angle (HSA; B). The middle panels illustrate the estimated means of stride length / heel strike angle in both control (blue) and feedback (orange) condition. The right panels illustrate the estimated means of both param eters in ON and OFF medication during the control walk (blue) for comparison with the FB effect. Estimated means account for between-subject vari ability, the errorbars illustrate 95%-confidence intervals or the estimated means. Increased values indicate improvement, decreased values deterioration of gait parameters. * indicates significance at p < 0.05. For the influence of medication, Hoehn and Yahr stage and cohort on the FB effect, please see Supplementary Fig. 1解説: フィードバックと薬剤が平均歩幅(A)と踵接地角度(HSA; B)をどのように改善したかを示しています。中央のパネルは対照条件(青)とフィードバック条件(オレンジ)における推定平均値を示し、右側のパネルは対照歩行中のON薬剤状態とOFF薬剤状態の推定平均値を示しています。値の増加は歩行パラメータの改善を示します。
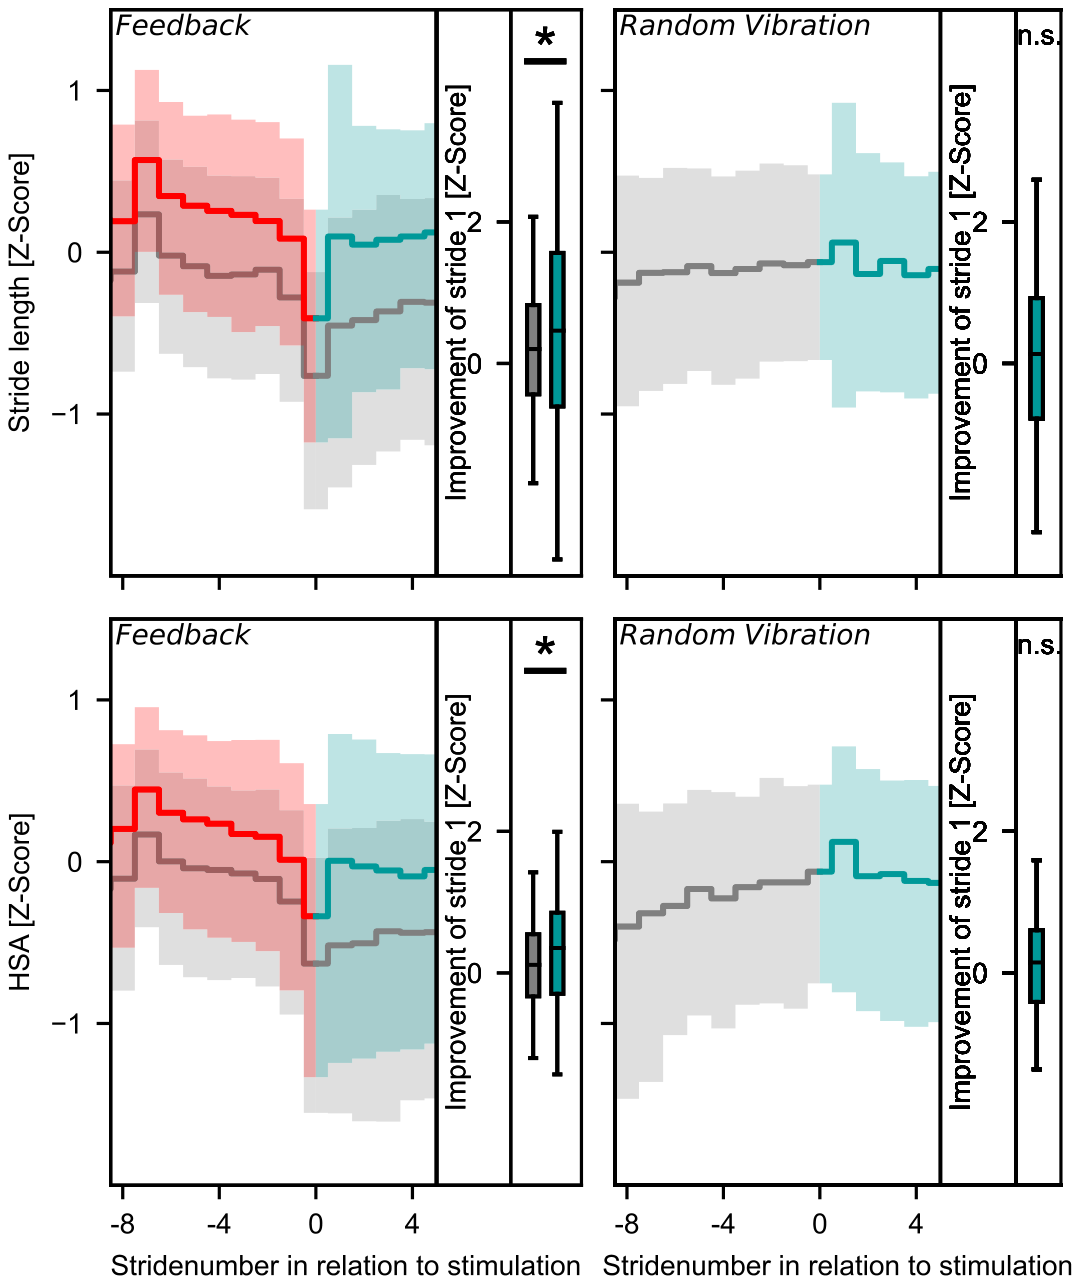
Figure 4. Fig. 4 Feedback instantaneously improves stride length and heel strike angle. Stride-resolved median Z-Score (within each PwPD & medication state) of stride length (upper panels) and heel strike angle (HSA, lower panels) before and up to 5 strides after stimulation. Left panels illustrate reactions to feedback (FB; red: strides before stimulation, green: strides after stimulation) compared to control (CT) walks (grey: strides at which a vibration would have been triggered during a FB walk), right panels illustrate strides before (grey) and after stimulation at random time points (RV; green). Shaded areas depict the interquartile range. On the right of each panel: Improvement (first order difference between stride 0 and stride 1) upon stimulation in the FB walk (green) or at similar strides of CT walks (grey) when FB would have occurred in the FB run. The improvement upon RV (green in right part of the right panels) is tested against 0. * indicates significance at p < 0.05; n.s.: not significant解説: フィードバックが歩幅と踵接地角度を即座に改善することを示しています。左のパネルは、フィードバック(FB)と対照(CT)歩行における、刺激前後の歩幅とHSAのZスコアの変化を示しています。右のパネルは、ランダム振動(RV)の場合の同じ変化を示しており、FBが歩行の悪化後に直接的な改善をもたらすことを示しています。


コメントを残す