どうも、Beyond the Pixelです。
陽子線治療(Proton Therapy)は、がん治療において健康な組織への線量(エネルギー)を最小限に抑えつつ、腫瘍に集中して線量を投与できるという優れた特性を持っています。これは、陽子線が物質中で特定の深さで線量(エネルギー)のピーク(ブラッグピーク)を示すため、治療深度を精密に制御できることに由来します。この利点から、世界中で陽子線治療施設が増加していますが、その普及には大きな課題があります。従来の陽子線治療装置は、サイクロトロンやシンクロトロンといった大型で高価な加速器、そして高エネルギーの陽子線を曲げるための巨大な磁石を必要とするため、設置コストが数千万ドルから数億ドルに及び、物理的な設置面積も非常に大きいのが現状です。
スポットサイズは治療計画の質に影響を与えることが知られています。縦方向スポットサイズは治療時間と密接に関連しており、小さすぎるとエネルギー切り替えの回数が増え、治療時間が大幅に延長される可能性があります。一方、横方向スポットサイズは、一般に小さいほど望ましいとされています。これにより、線量(エネルギー)の急峻な減衰(半影)が実現し、健康な組織の温存が向上します。しかし、非常に小さな横方向スポットサイズは、治療計画の複雑化や最適化時間の増加、そしてスポット数の増加によるデリバリー時間の延長につながる可能性も指摘されています。これまでの研究では、横方向スポットサイズが5mmを超えると線量適合性が低下する一方で、3mmを下回るさらなる縮小は計画の質に顕著な改善をもたらさず、最適化に要するスポット数を大幅に増やすことが示されていました。また、線量加重LET(LETd: Dose-averaged Linear Energy Transfer)もスポットサイズに影響されることがわかっていますが、ターゲットおよびリスク臓器(OAR: Organ-at-Risk)におけるLETとスポットサイズの関係はまだ明確に確立されていません。特に0.6mmといった極めて小さな横方向スポットサイズや、縦方向スポットサイズが治療計画の質に与える影響については、これまで報告された研究はありませんでした。
Table 3. Table 3: Beam parameters at DWA exit from TRANSOPTR simulations. All reported values are 1- RMS. For the subsequent input into TOPAS, an emittance of 3.75·10−6cm·rad was selected and held constant for all energies, representing the maximum reported emittance from TRANSOPTR. The energy spreads reported represent the minimum and maximum energy spreads expected to be achievable by the DWA, not accounting for scatter in air to isocentre. The beam size and divergence at isocentre were controlled with two magnetic quadrupoles.解説: TRANSOPTRシミュレーションから得られたDWA出口でのビームパラメータを示しています。報告されているすべての値は1-RMSであり、その後の入力用です。
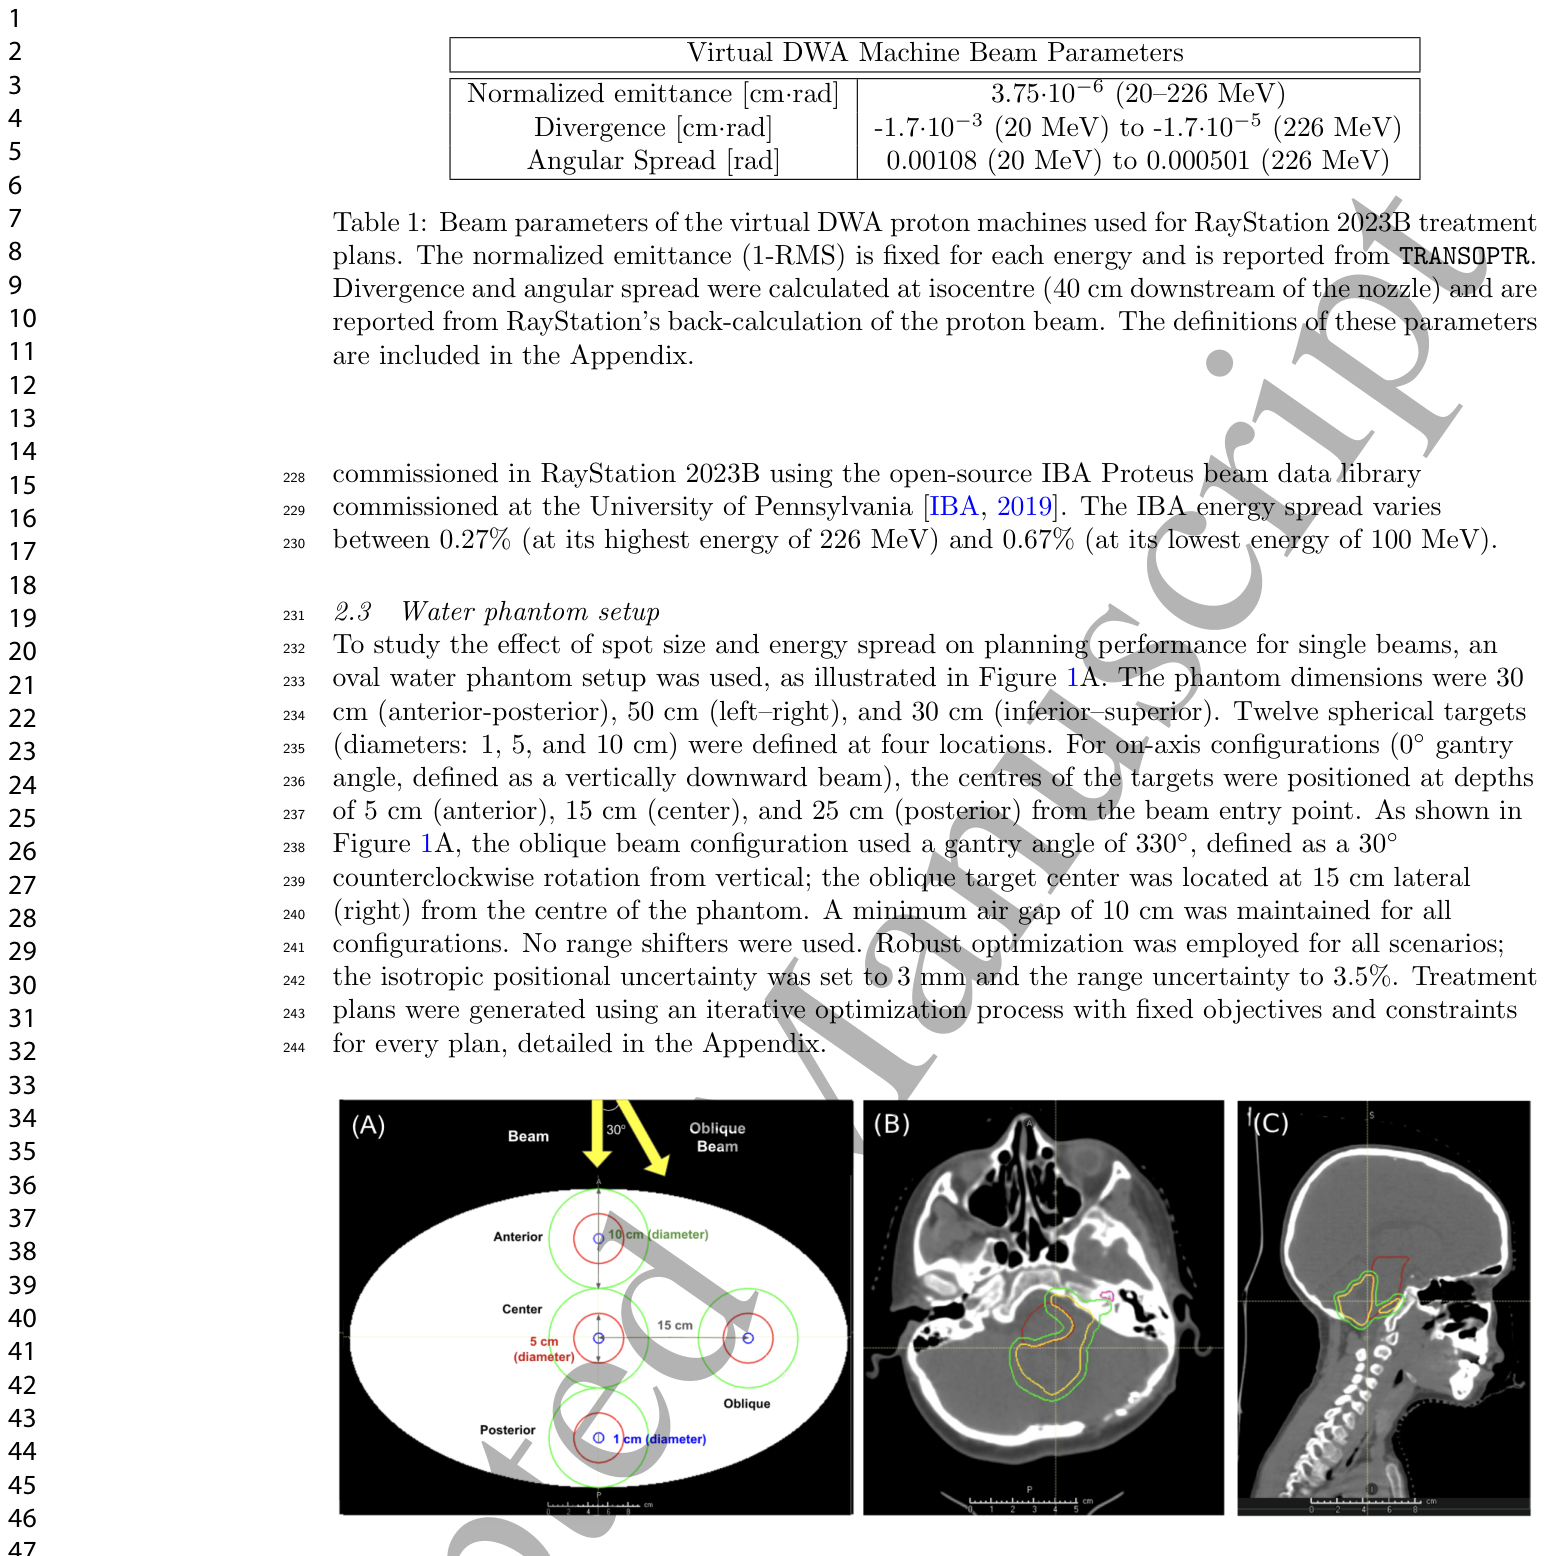
Table 1. Table 1: Beam parameters of the virtual DWA proton machines used for RayStation 2023B treatment plans. The normalized emittance (1-RMS) is fixed for each energy and is reported from TRANSOPTR. Divergence and angular spread were calculated at isocentre (40 cm downstream of the nozzle) and are reported from RayStation’s back-calculation of the proton beam. The definitions of these parameters are included in the Appendix.解説: RayStation 2023Bの治療計画に使用された仮想DWA陽子線装置のビームパラメータを示しています。正規化エミッタンス(1-RMS)は各エネルギーで固定されており、TRANSOPTRから報告されています。ダイバージェンスと角度広がりはアイソセンター(ノズルから40cm下流)で計算され、RayStationの陽子線バック計算から報告されています。
に示されています。比較のため、University of PennsylvaniaでコミッショニングされたオープンソースのIBA Proteusシステムデータライブラリを用いた従来の陽子線システムもRayStationでコミッショニングされました。
Figure 1. Figure 1: Phantom and sample patient setups in RayStation 2023B. In (A), an oval water phantom is shown, along with twelve targets of four different locations and three different sizes. In (B) and (C), the axial and sagittal slices centred at isocentre are shown, respectively, for a sample pediatric CNS patient. The CTV is outlined in yellow, PTV in green, and brainstem in red.解説: RayStation 2023Bを用いたファントムと対象者での設定図です。(A)には楕円形水ファントム、4つの異なる位置と3つの異なるサイズの12個の標的が示されています。(B)と(C)は、小児CNS対象者の代表例について、アイソセンターを中心とした軸方向および矢状方向のスライスがそれぞれ示されています。CTVは黄色、PTVは緑色、脳幹は赤色で輪郭が描かれています。
に示されています。
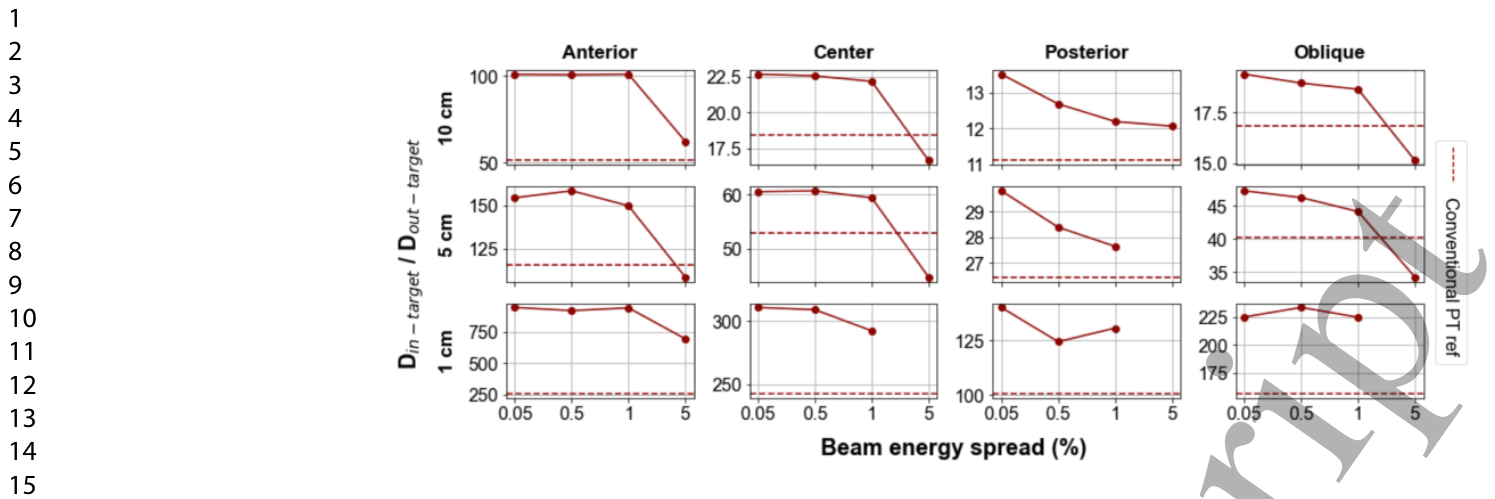
治療計画はRayStationで堅牢に最適化され、位置の不確かさ3mm、範囲の不確かさ3.5%が考慮されました。評価指標として、標的内部の平均線量と標的外部の平均線量の比率(Din-target/Dout-target)、標的内部と標的外部の平均線量加重LET(LETd)の比率(LETin-target/LETout-target)、線量体積ヒストグラム(DVH: Dose-Volume Histogram)、LET体積ヒストグラム(LVH: LET Volume Histogram)、そして半影などが抽出されました。
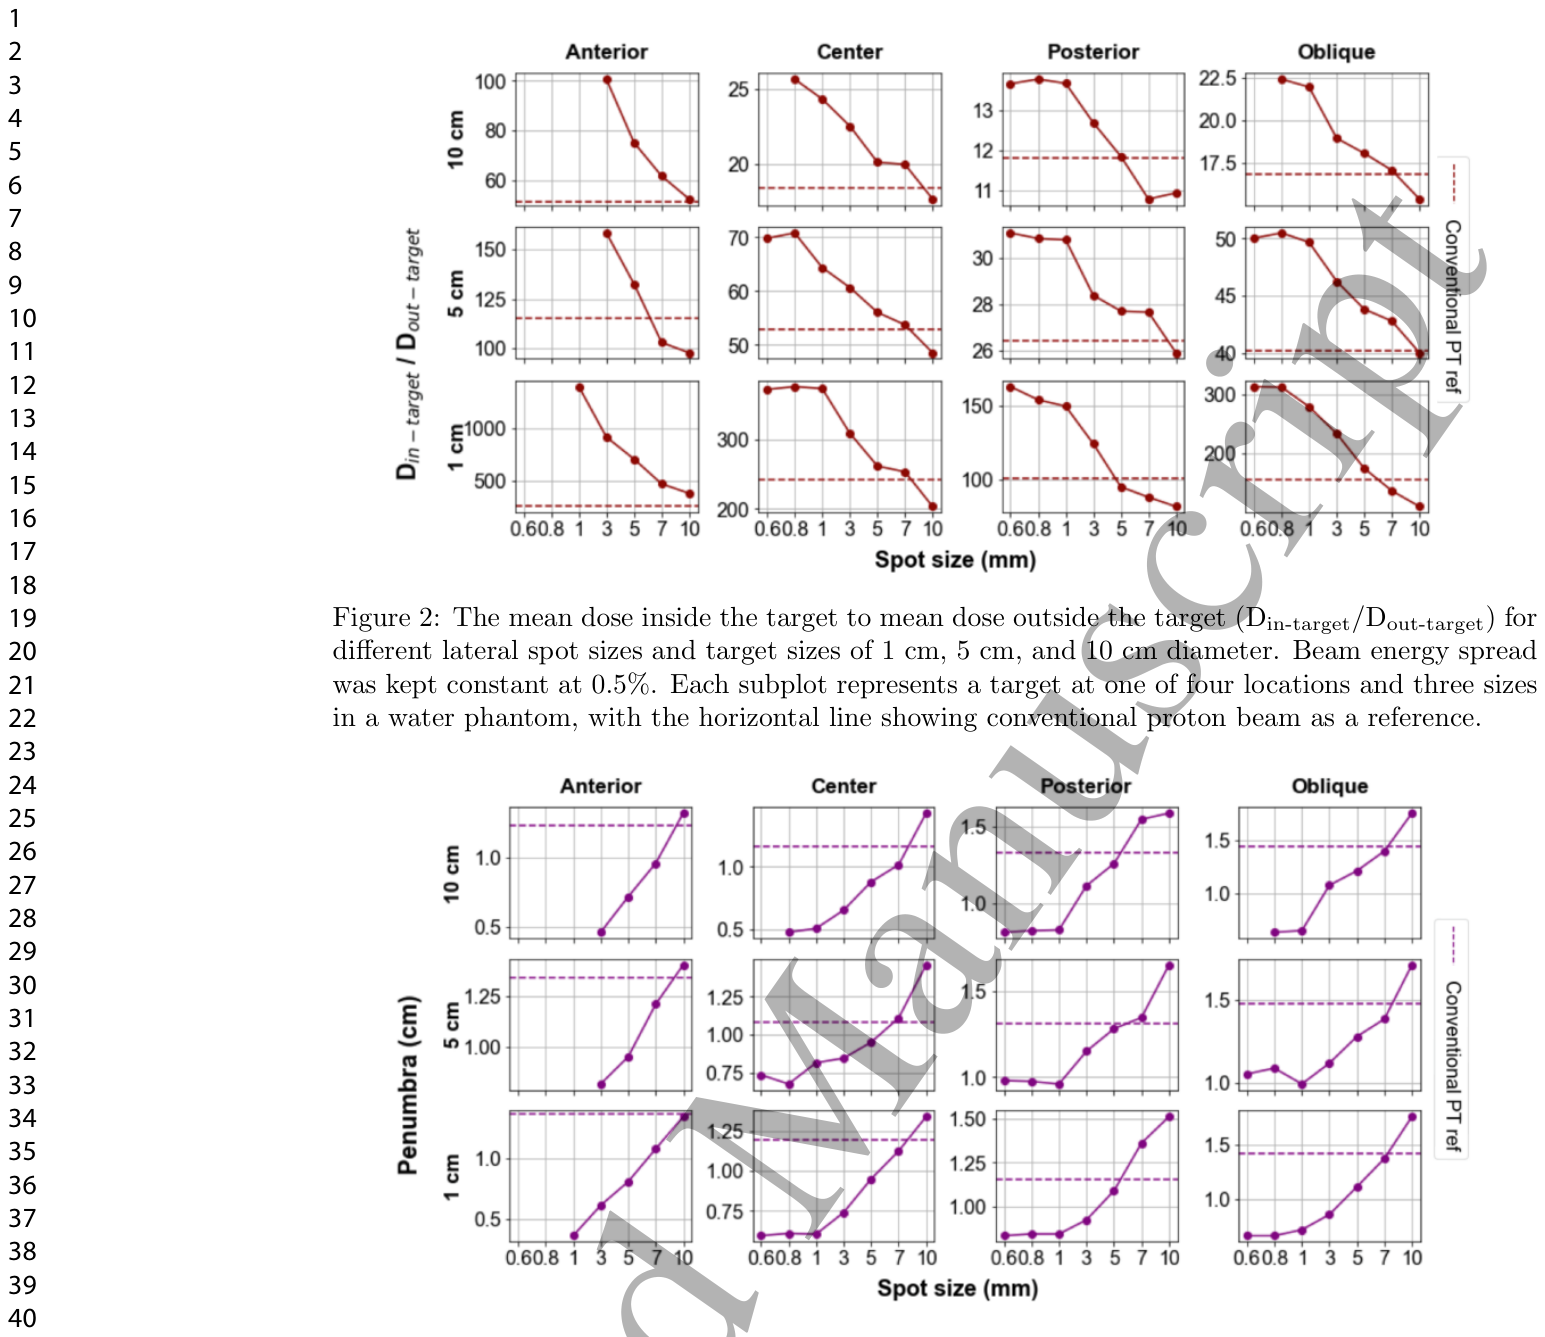
Figure 3. Figure 3: The penumbra for different lateral spot sizes. Beam energy spread was kept constant at 0.5%. Each subplot represents a target at one of four locations and three sizes in a water phantom, with the horizontal line showing the corresponding conventional proton beam result as a reference.解説: さまざまな横方向スポットサイズにおける半影を示しています。ビームエネルギー分散は0.5%に固定されています。各サブプロットは水ファントム内の4つの位置と3つのサイズにおける標的を示しており、横線は対応する従来の陽子線ビームの結果の参照値を示しています。
参照)と一致しています。
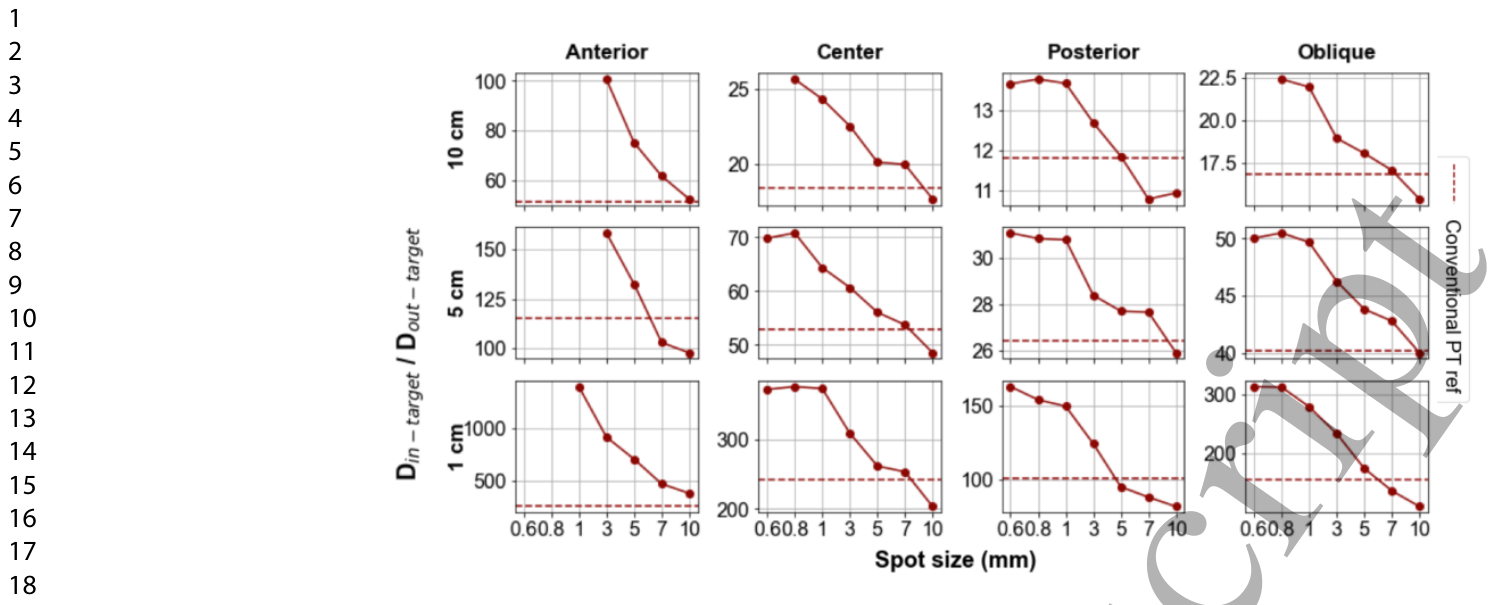
Figure 2. Figure 2: The mean dose inside the target to mean dose outside the target (Din-target/Dout-target) for different lateral spot sizes and target sizes of 1 cm, 5 cm, and 10 cm diameter. Beam energy spread was kept constant at 0.5%. Each subplot represents a target at one of four locations and three sizes in a water phantom, with the horizontal line showing conventional proton beam as a reference.解説: さまざまな横方向スポットサイズと1cm、5cm、10cm径の標的サイズにおける、標的内部の平均線量と標的外部の平均線量の比率(Din-target/Dout-target)を示しています。ビームエネルギー分散は0.5%に固定されています。各サブプロットは水ファントム内の4つの位置と3つのサイズにおける標的を示しており、横線は従来の陽子線ビームの参照値を示しています。
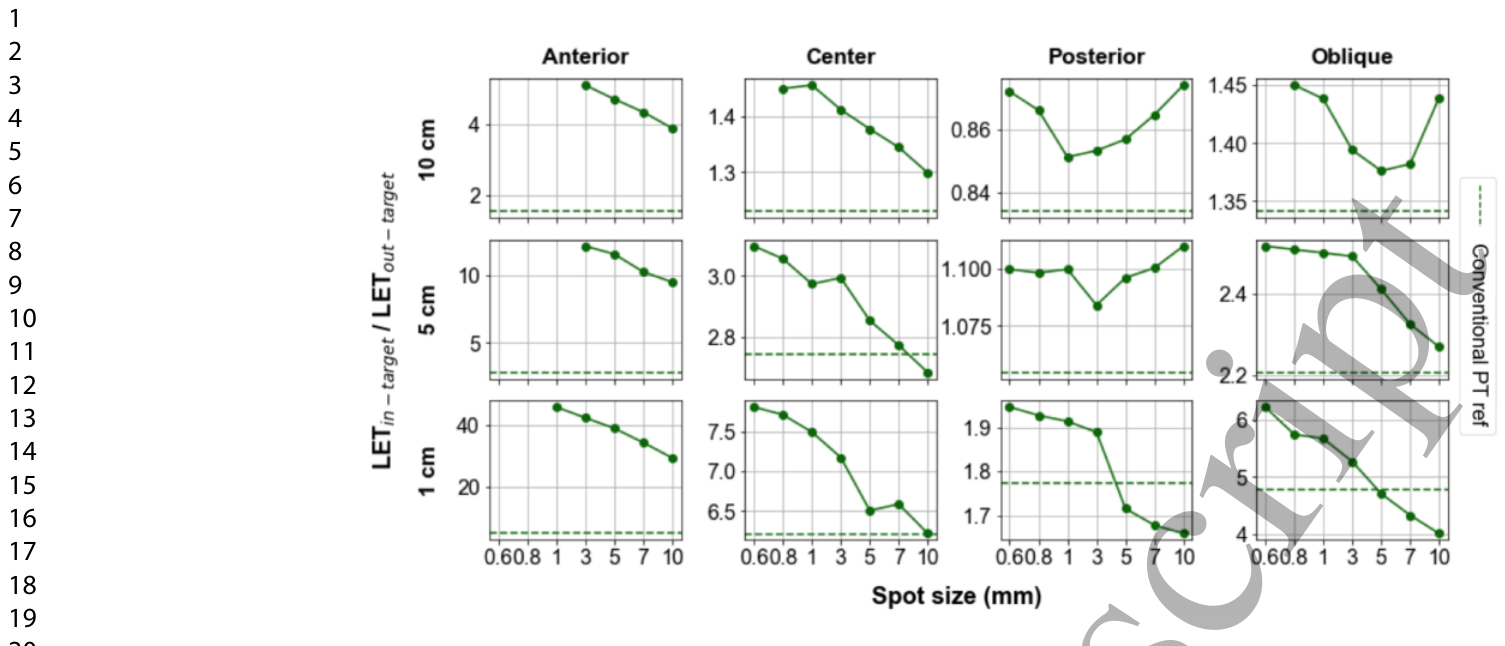
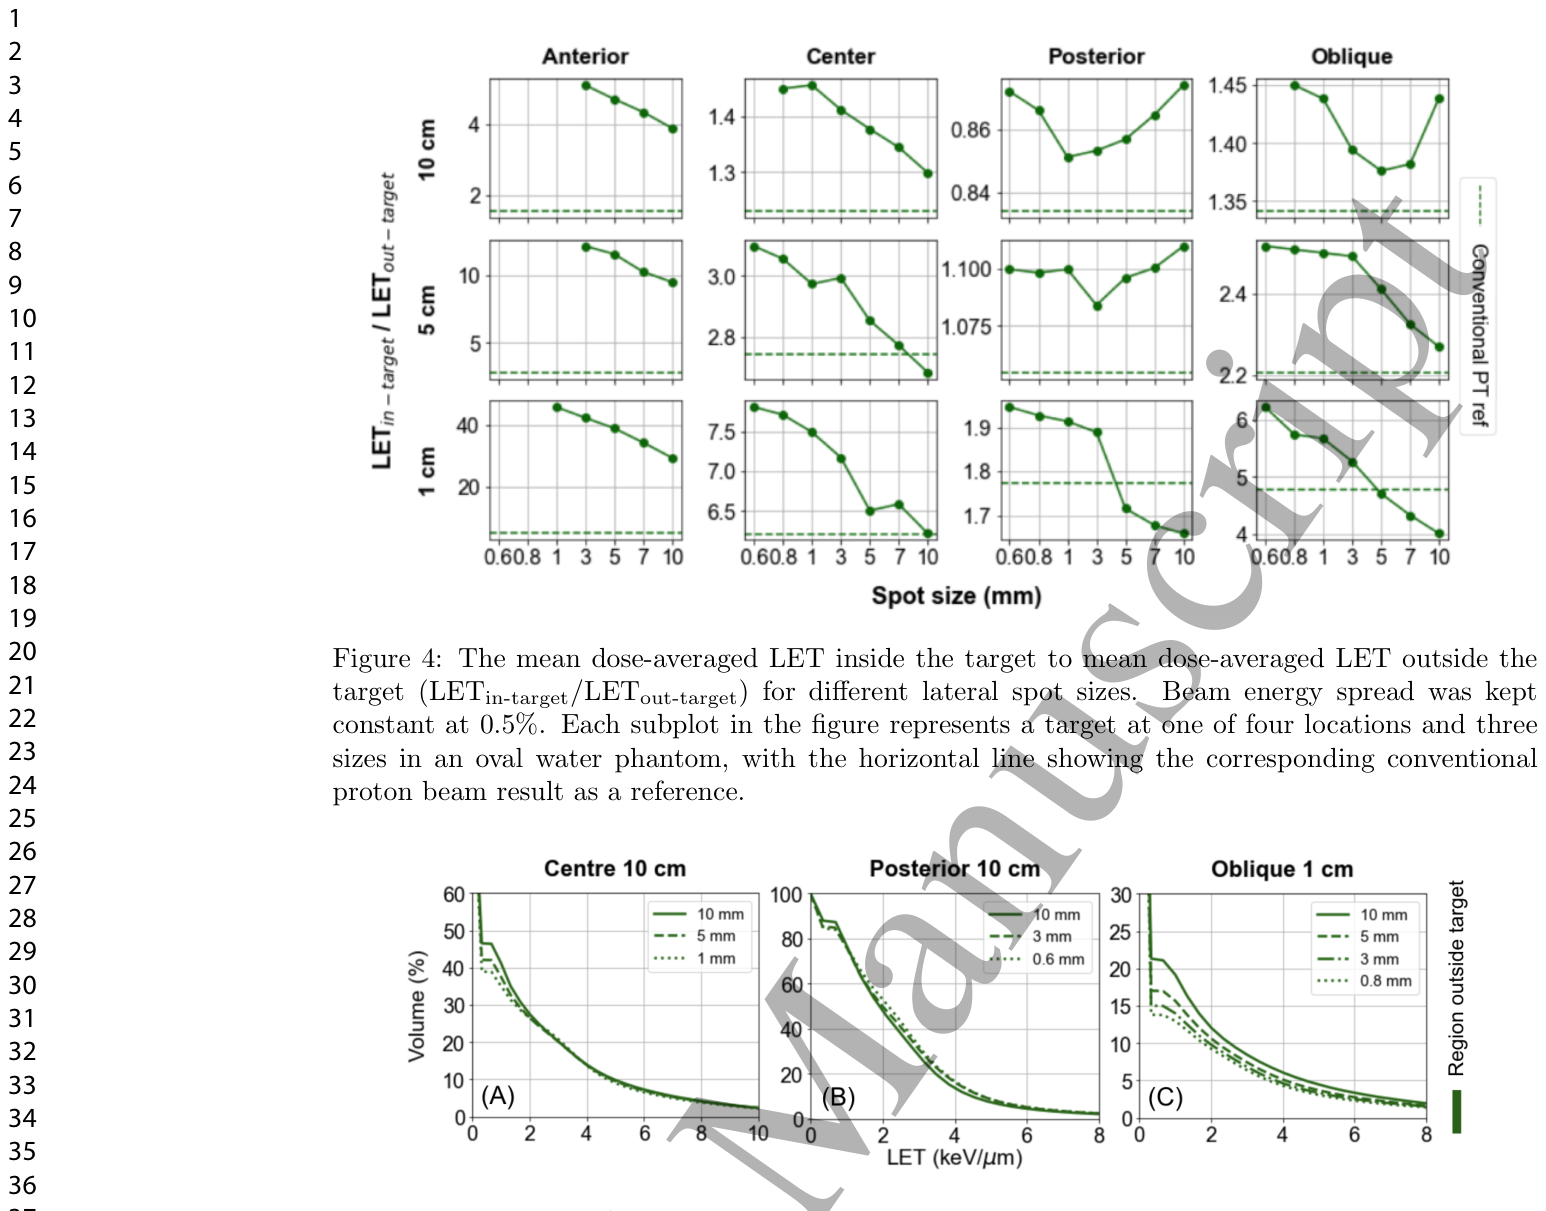
Figure 4. Figure 4: The mean dose-averaged LET inside the target to mean dose-averaged LET outside the target (LETin-target/LETout-target) for different lateral spot sizes. Beam energy spread was kept constant at 0.5%. Each subplot in the figure represents a target at one of four locations and three sizes in an oval water phantom, with the horizontal line showing the corresponding conventional proton beam result as a reference.解説: さまざまな横方向スポットサイズにおける、標的内部の平均線量加重LETと標的外部の平均線量加重LETの比率(LETin-target/LETout-target)を示しています。ビームエネルギー分散は0.5%に固定されています。図中の各サブプロットは楕円形水ファントム内の4つの位置と3つのサイズにおける標的を示しており、横線は対応する従来の陽子線ビームの結果の参照値を示しています。
Figure 5. Figure 5: The LVH of the region outside the target for three targets: (A) centre target with 10 cm diameter, (B) posterior with 10 cm diameter, and (C) oblique with 1 cm diameter. Beam energy spread was kept constant at 0.5%. Three or four lateral spot sizes were included for visual legibility, however the other spot sizes follow a similar trend. The corresponding LVHs for the regions inside the target for these three cases are shown in Figure 17 (see Appendix).解説: 3つの標的((A)直径10cmの中心標的、(B)直径10cmの後方標的、(C)直径1cmの斜め標的)における標的外部領域のLVH(LET体積ヒストグラム)を示しています。ビームエネルギー分散は0.5%に固定されています。視認性のため3つまたは4つの横方向スポットサイズが含まれていますが、他のスポットサイズも同様の傾向を示しています。
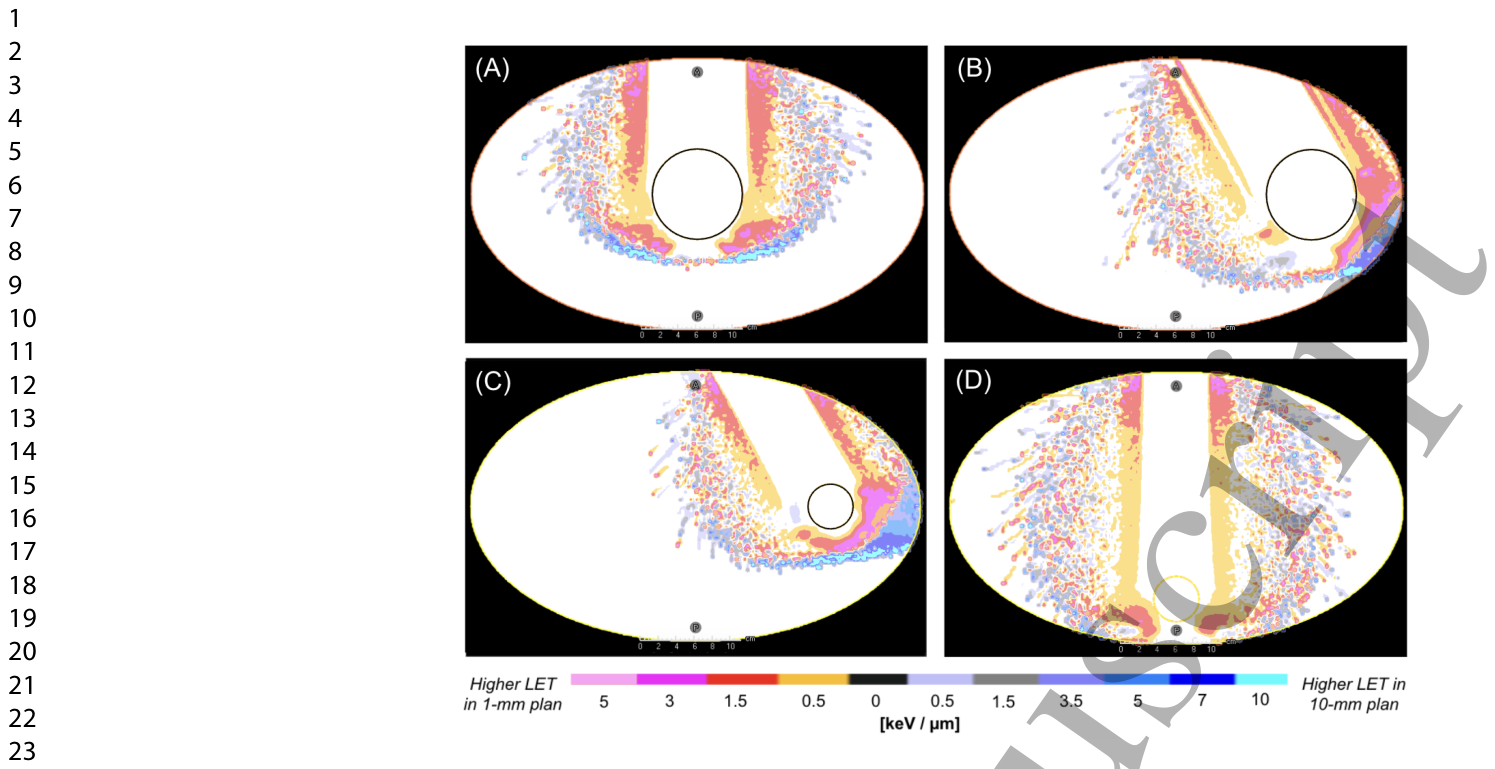
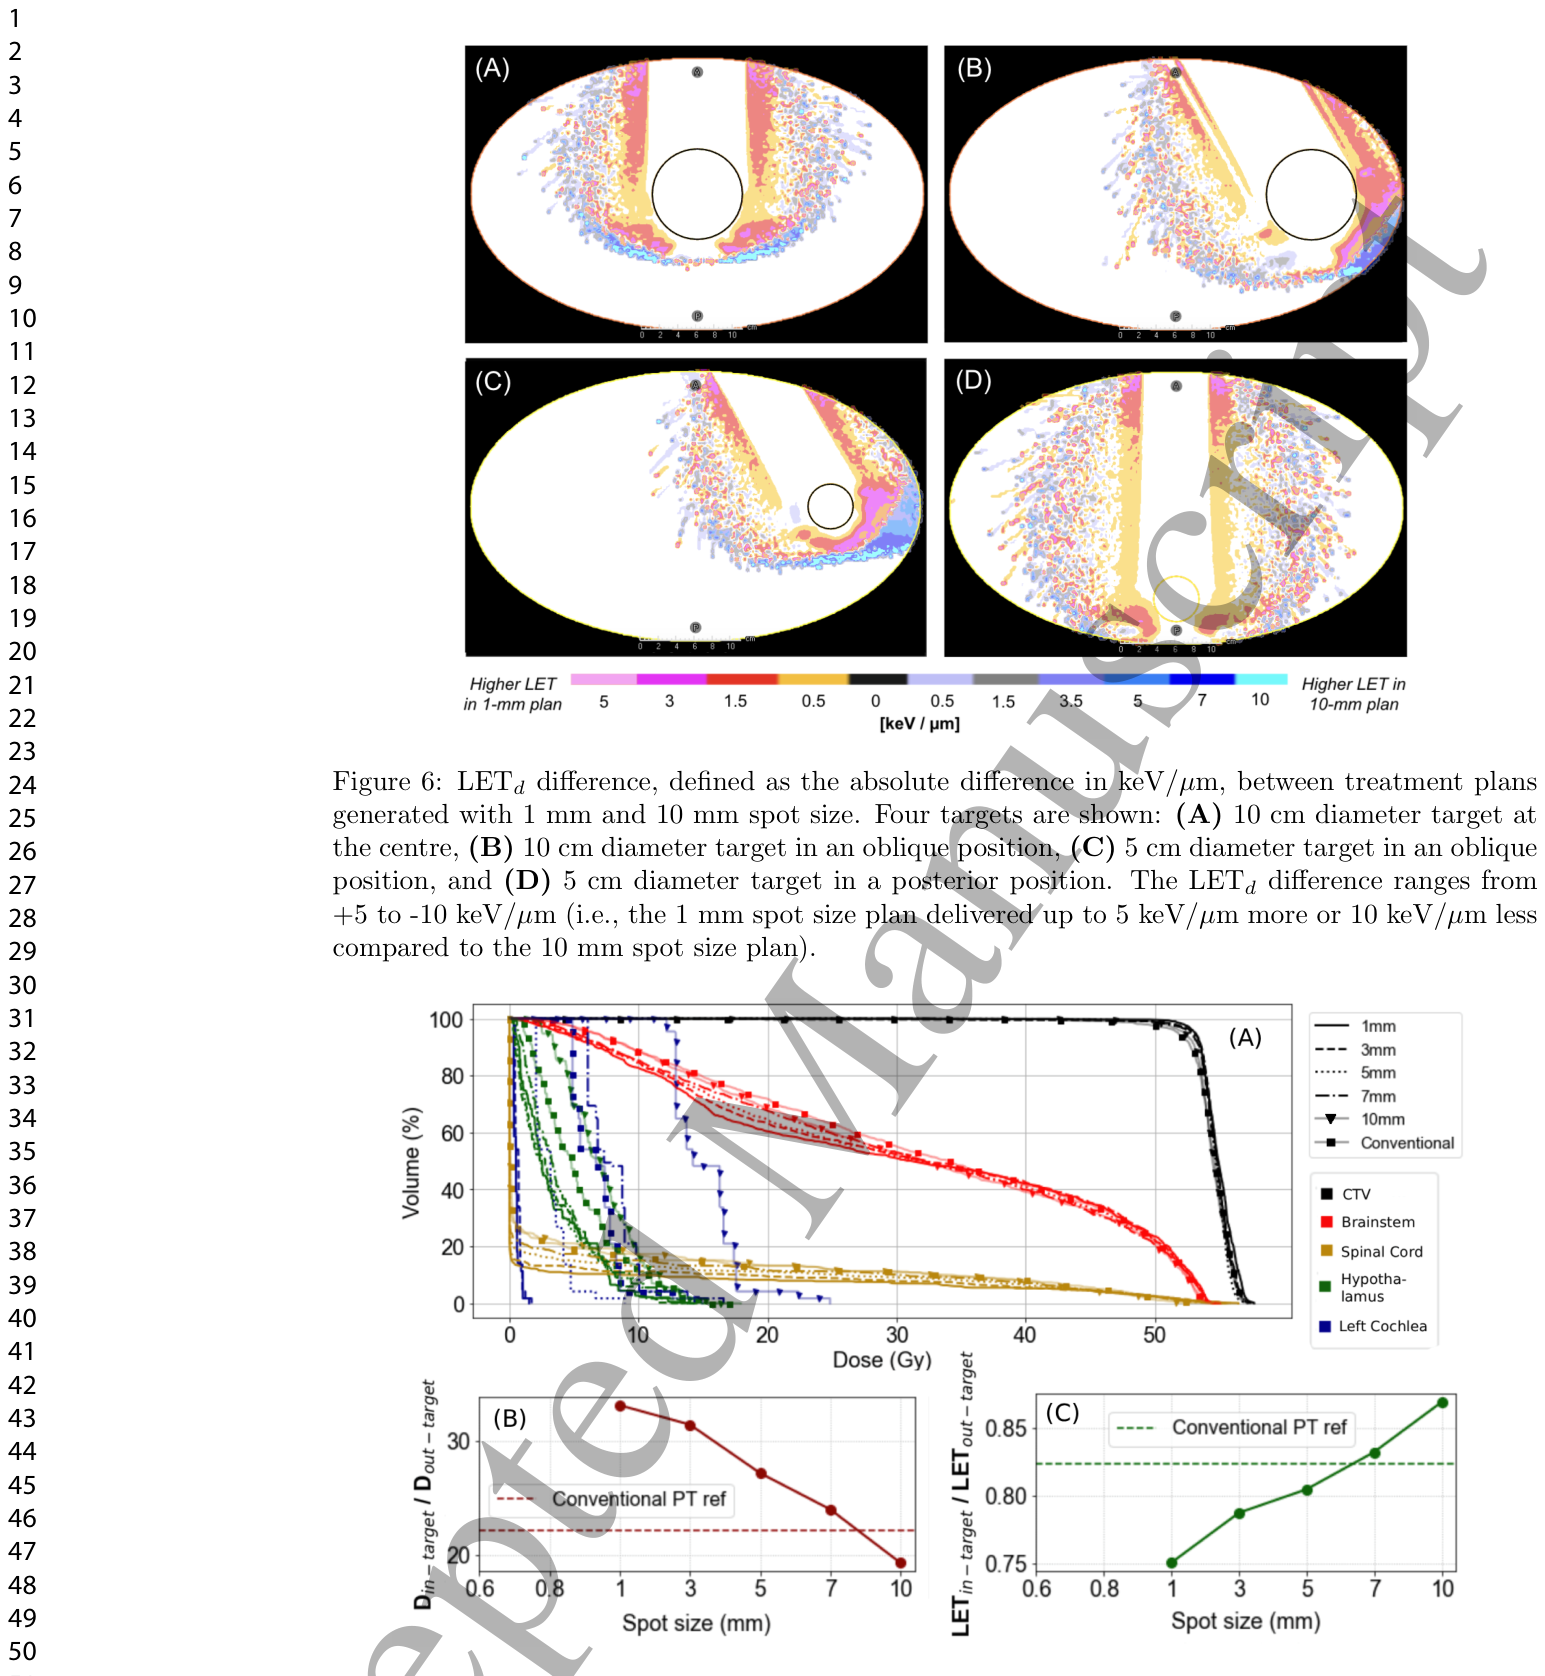
Figure 6. Figure 6: LETd difference, defined as the absolute difference in keV/µm, between treatment plans generated with 1 mm and 10 mm spot size. Four targets are shown: (A) 10 cm diameter target at the centre, (B) 10 cm diameter target in an oblique position, (C) 5 cm diameter target in an oblique position, and (D) 5 cm diameter target in a posterior position. The LETd difference ranges from +5 to -10 keV/µm (i.e., the 1 mm spot size plan delivered up to 5 keV/µm more or 10 keV/µm less compared to the 10 mm spot size plan).解説: 1mmと10mmのスポットサイズで作成された治療計画間のLETd差(keV/µmの絶対差として定義)を示しています。中心に直径10cmの標的(A)、斜めに直径10cmの標的(B)、斜めに直径5cmの標的(C)、後方に直径5cmの標的(D)の4つの標的が示されています。LETd差は+5から-10 keV/µmの範囲です。
Figure 7. Figure 7: For a sample pediatric CNS patient (infratentorial ependymoma), the following parameters are shown for spot sizes from 1 to 10 mm: (A) the DVH for the CTV and four OARs, (B) the ratio of dose inside versus outside the CTV (i.e., target), and (C) the ratio of LET inside versus outside the CTV. Conventional proton beam results are included as reference. Beam energy spread was kept constant at 0.5%.解説: 小児CNS(テント下髄芽腫)対象者の代表例について、1mmから10mmのスポットサイズに対する(A)CTVと4つのリスク臓器(OAR)のDVH(線量体積ヒストグラム)、(B)CTV内部対外部の線量比、(C)CTV内部対外部のLET比が示されています。従来の陽子線ビームの結果が参照として含まれており、ビームエネルギー分散は0.5%に固定されています。
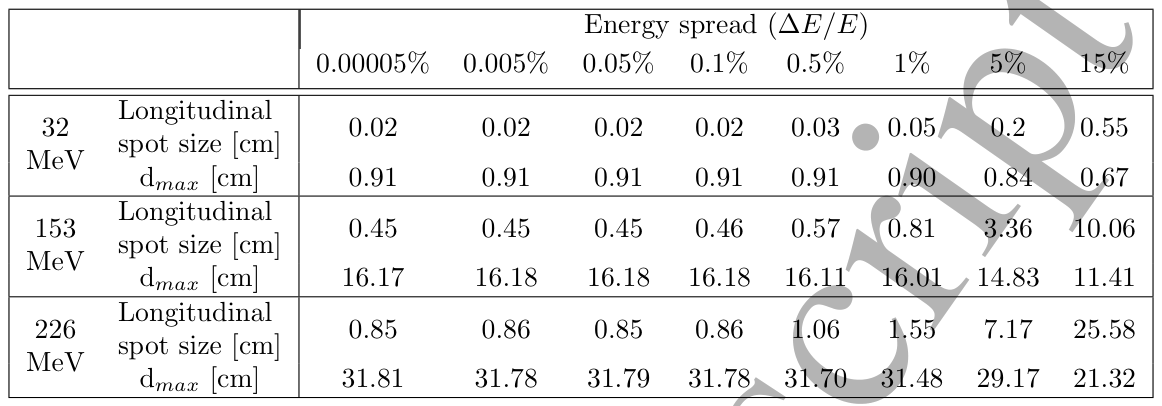
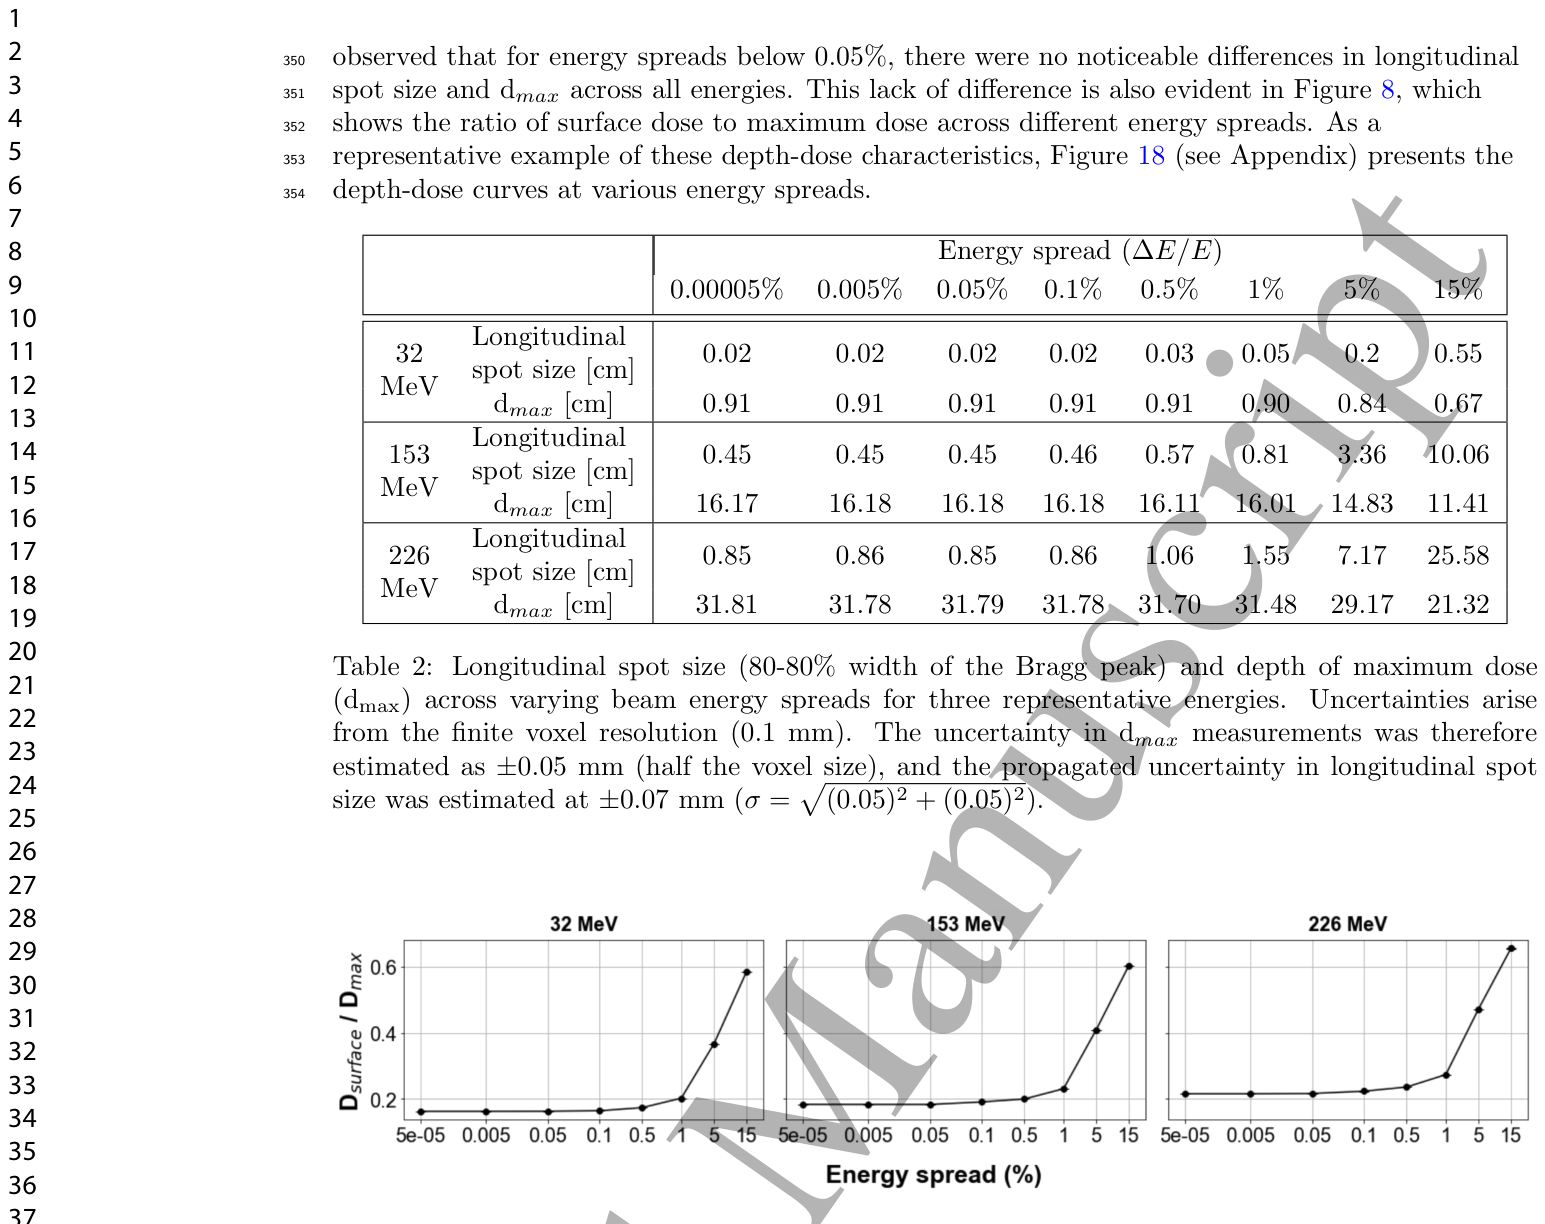
Table 2. Table 2: Longitudinal spot size (80-80% width of the Bragg peak) and depth of maximum dose (dmax) across varying beam energy spreads for three representative energies. Uncertainties arise from the finite voxel resolution (0.1 mm). The uncertainty in dmax measurements was therefore estimated as ±0.05 mm (half the voxel size), and the propagated uncertainty in longitudinal spot size was estimated at ±0.07 mm (σ =解説: 3つの代表的なエネルギーにおける、さまざまなビームエネルギー分散に対する縦方向スポットサイズ(ブラッグピークの80-80%幅)と最大線量深度(dmax)を示しています。不確かさは有限なボクセル分解能(0.1mm)に起因し、dmax測定の不確かさは±0.05mm、縦方向スポットサイズの伝播不確かさは±0.07mmと推定されています。
Figure 8. Figure 8: The ratio of surface dose to maximum dose (Dsurface / Dmax) across varying beam energy spreads for three representative energies. Uncertainties are too small to be visually discernible, but they were estimated from ten iterations of the simulations.解説: 3つの代表的なエネルギーにおいて、さまざまなビームエネルギー分散に対する表面線量と最大線量の比率(Dsurface / Dmax)を示しています。不確かさは小さすぎて視覚的に識別できませんが、シミュレーションの10回の繰り返しから推定されました。
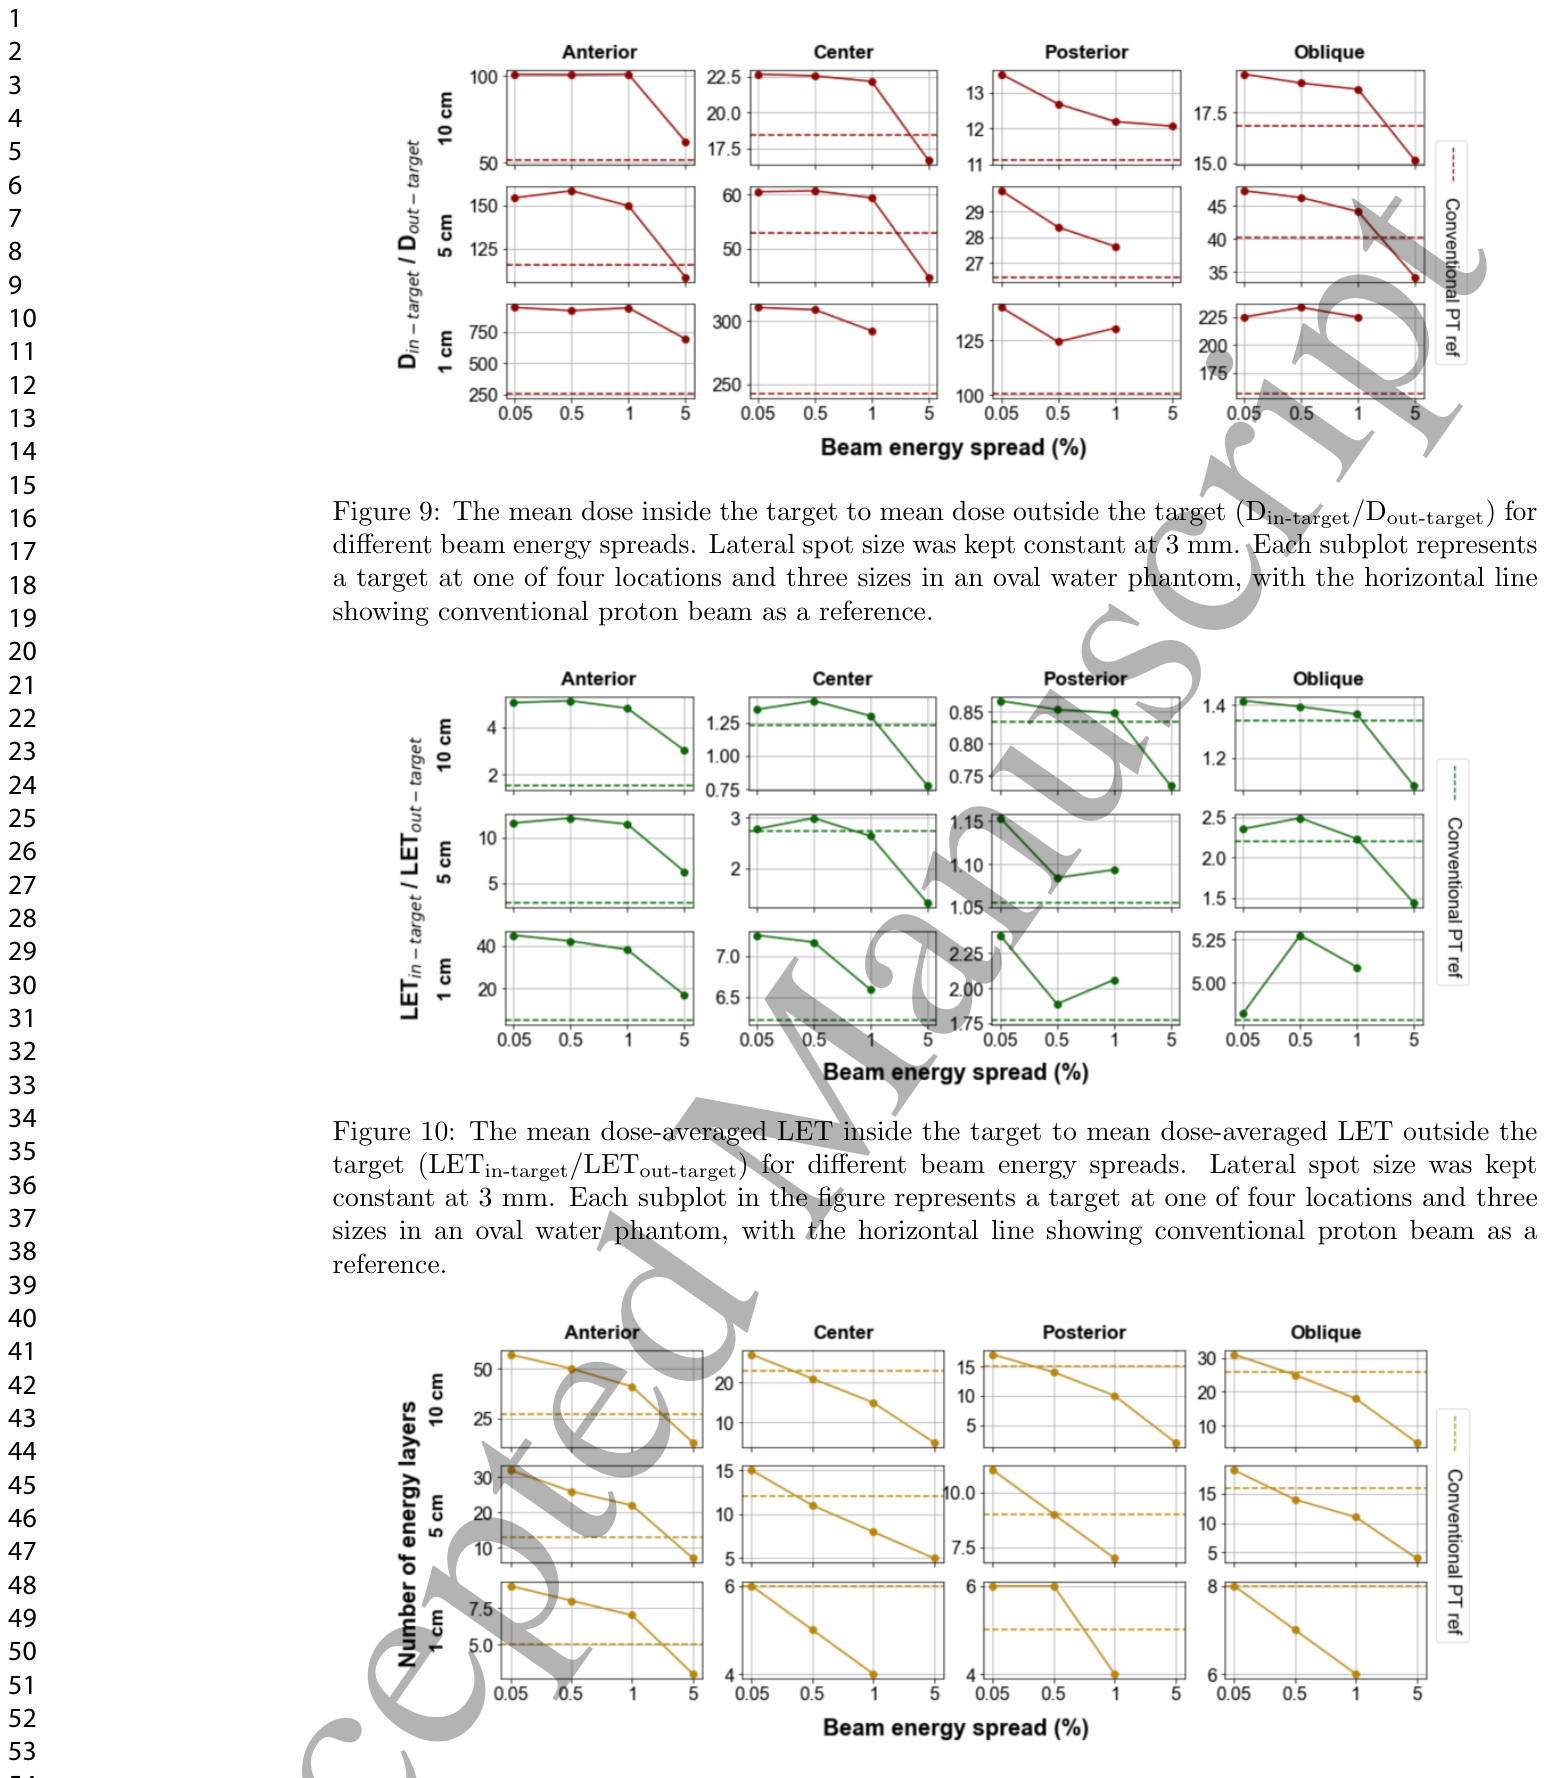
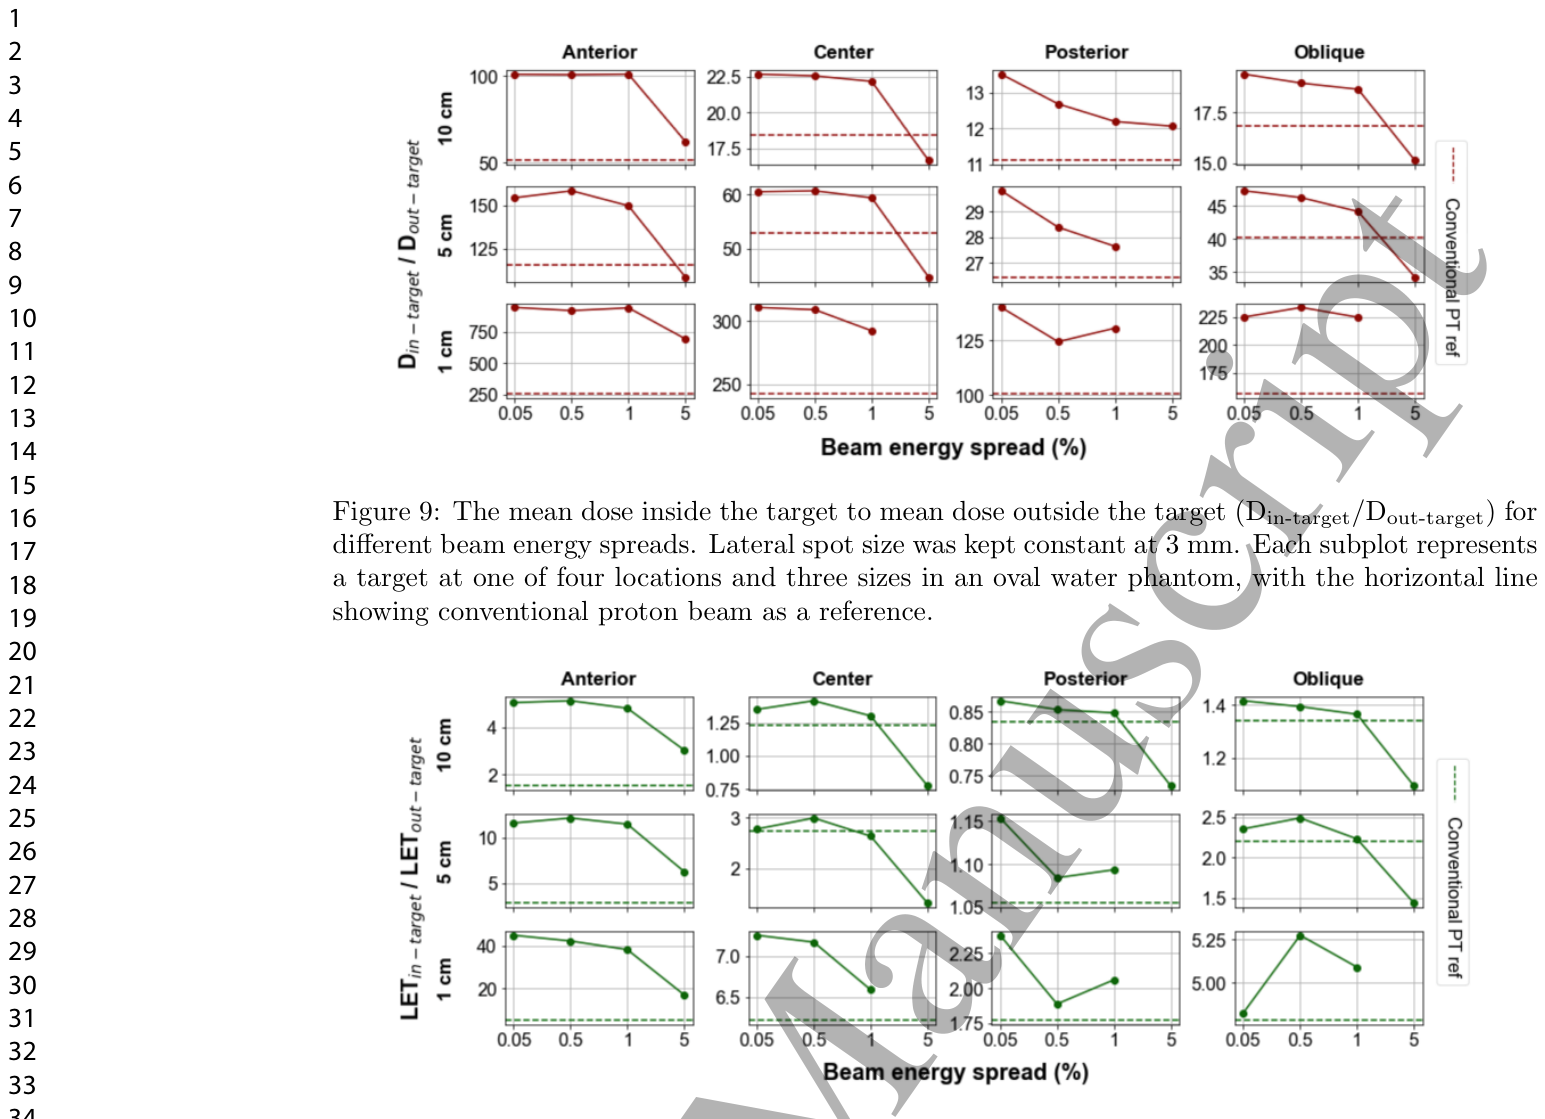
Figure 9. Figure 9: The mean dose inside the target to mean dose outside the target (Din-target/Dout-target) for different beam energy spreads. Lateral spot size was kept constant at 3 mm. Each subplot represents a target at one of four locations and three sizes in an oval water phantom, with the horizontal line showing conventional proton beam as a reference.解説: さまざまなビームエネルギー分散における、標的内部の平均線量と標的外部の平均線量の比率(Din-target/Dout-target)を示しています。横方向スポットサイズは3mmに固定されています。各サブプロットは楕円形水ファントム内の4つの位置と3つのサイズにおける標的を示しており、横線は従来の陽子線ビームの参照値を示しています。
Figure 11. Figure 11: The number of energy layers for different beam energy spreads. Lateral spot size was kept constant at 3 mm. Each subplot in the figure represents a target at one of four locations and three sizes in an oval water phantom, with the horizontal line showing conventional proton beam as a reference.
Figure 10. Figure 10: The mean dose-averaged LET inside the target to mean dose-averaged LET outside the target (LETin-target/LETout-target) for different beam energy spreads. Lateral spot size was kept constant at 3 mm. Each subplot in the figure represents a target at one of four locations and three sizes in an oval water phantom, with the horizontal line showing conventional proton beam as a reference.
Figure 12
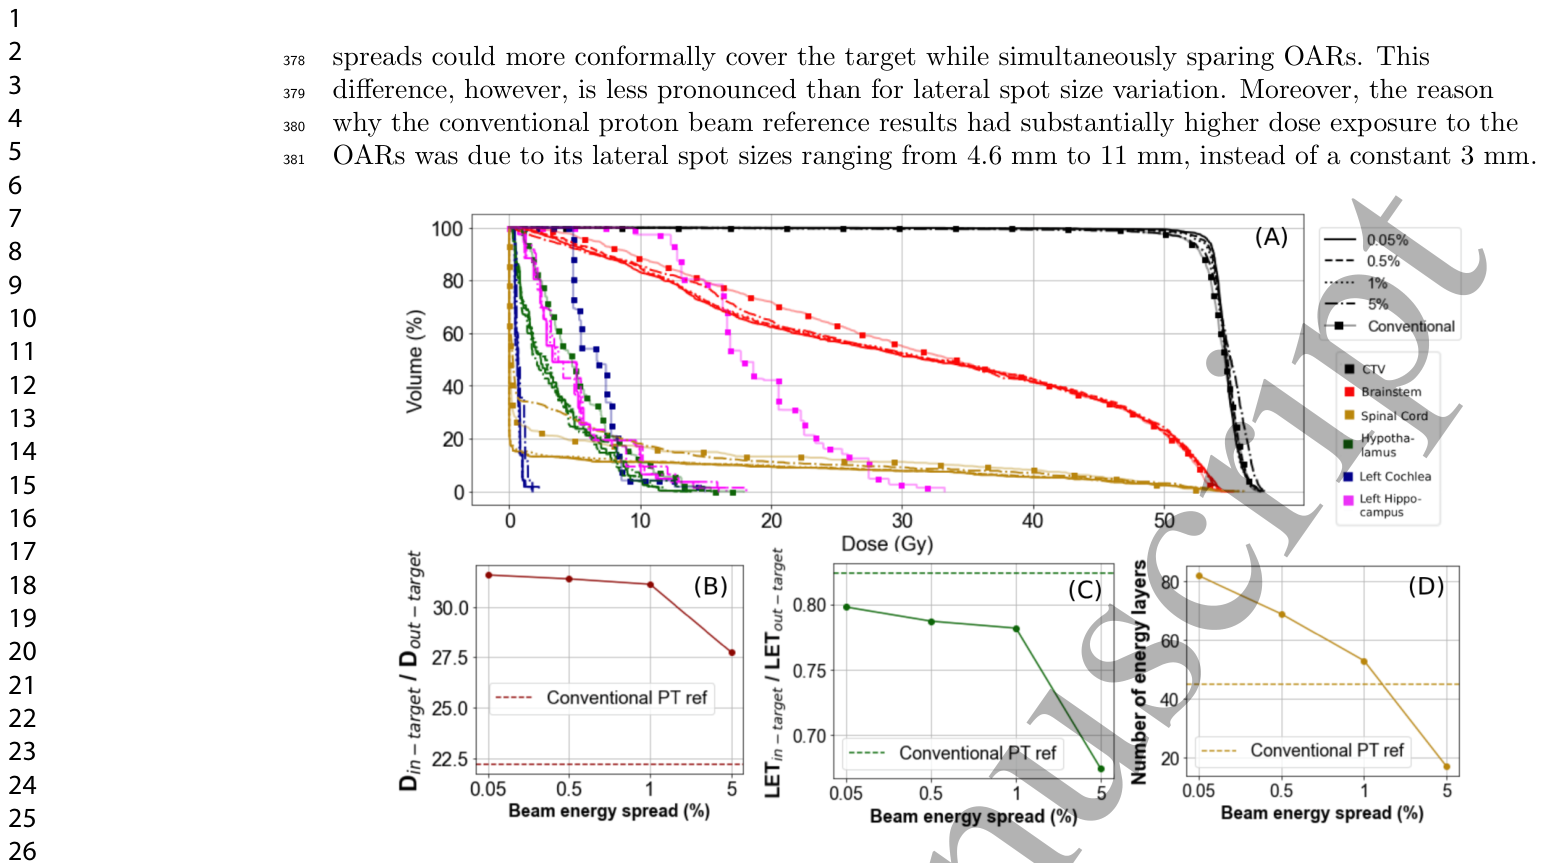
Figure 12. Figure 12: For a sample pediatric CNS patient (infratentorial ependymoma), the following param- eters are shown for beam energy spreads from 0.05% to 5%: (A) the DVH for the CTV and five OARs, (B) the ratio of dose inside versus outside the CTV, (C) the ratio of LET inside versus outside the CTV, and (D) the total number of energy layers across three fields. IBA results are included as reference. Lateral spot size was kept constant at 3 mm.
Figure 13
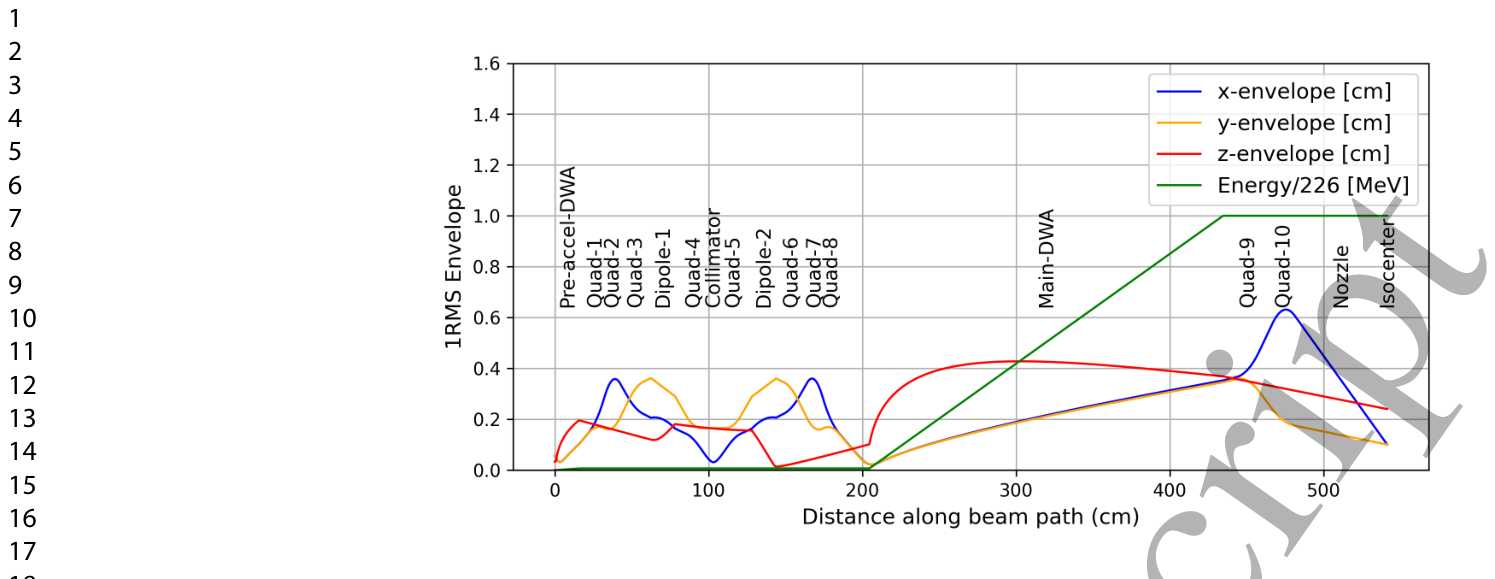
Figure 13. Figure 13: TRANSOPTR beam envelope of the DWA beamline at 226 MeV (in vacuum). The spot size was minimized to 1.0 mm with the use of two magnetic quadrupoles (Quad-9 and Quad-10). In reality, scattering in air will increase this spot size.
Figure 14
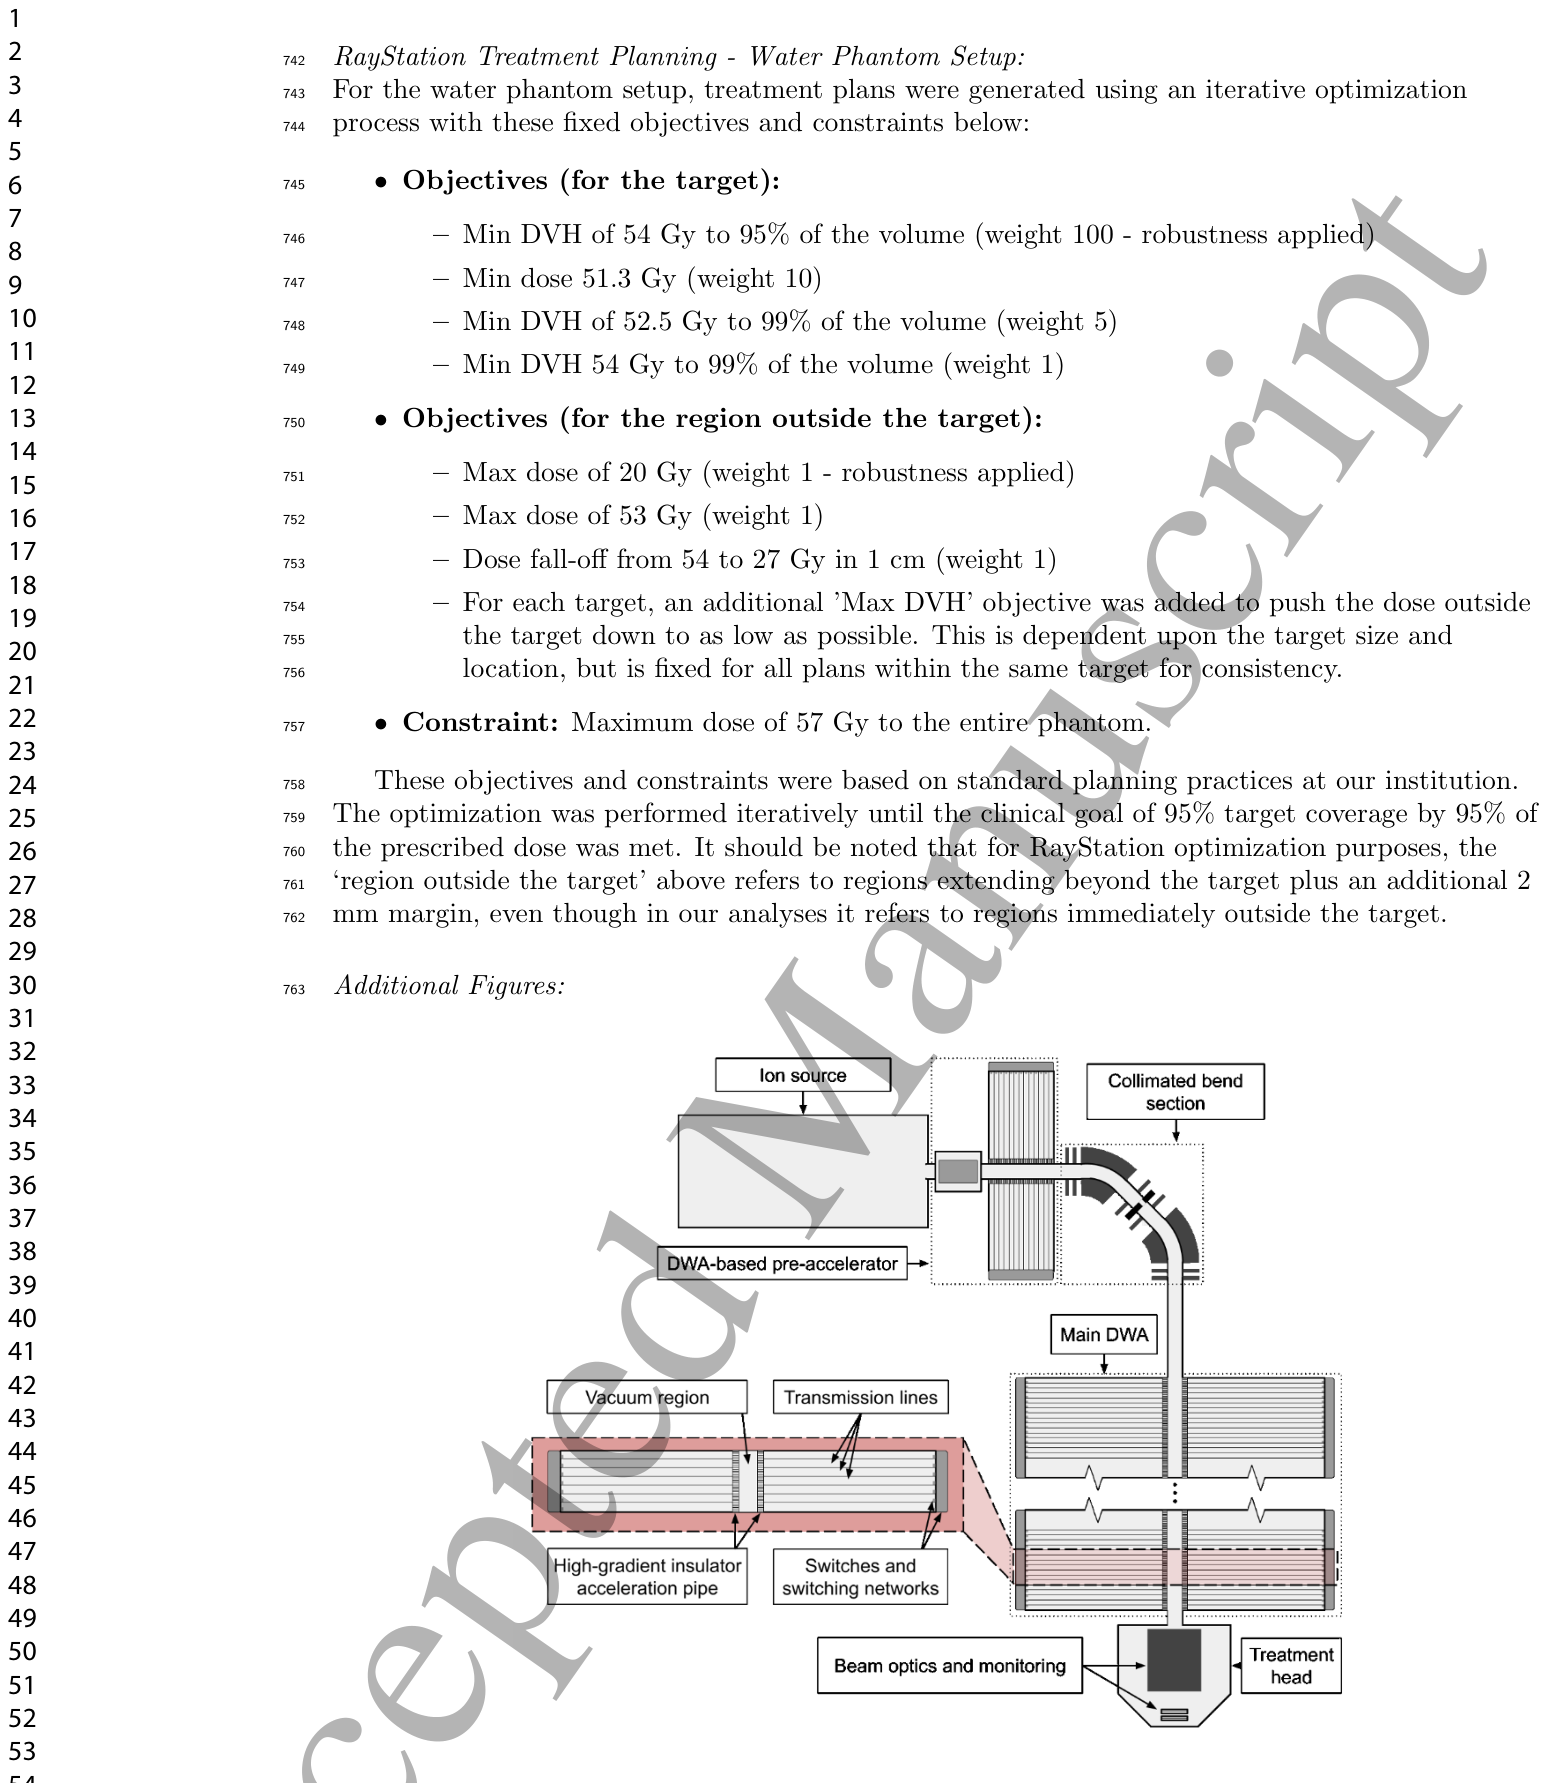
Figure 14. Figure 14: Schematic of our DWA-based PT system. Protons exit from the ion source and travel through a DWA-based pre-accelerator, where they are accelerated to 1.5 MeV. The collimated bend section contains an energy selection slit and directs particles towards the main DWA, where switching network-triggered waveguides propagate high-voltage pulses to generate electric field gradients of up to 100 MeV/m inside the vacuum region. The high-gradient insulator is to prevent breakdown from surface flashover effects. Protons subsequently traverse the treatment head, including beam optics and monitoring components, before reaching the patient.
Figure 15
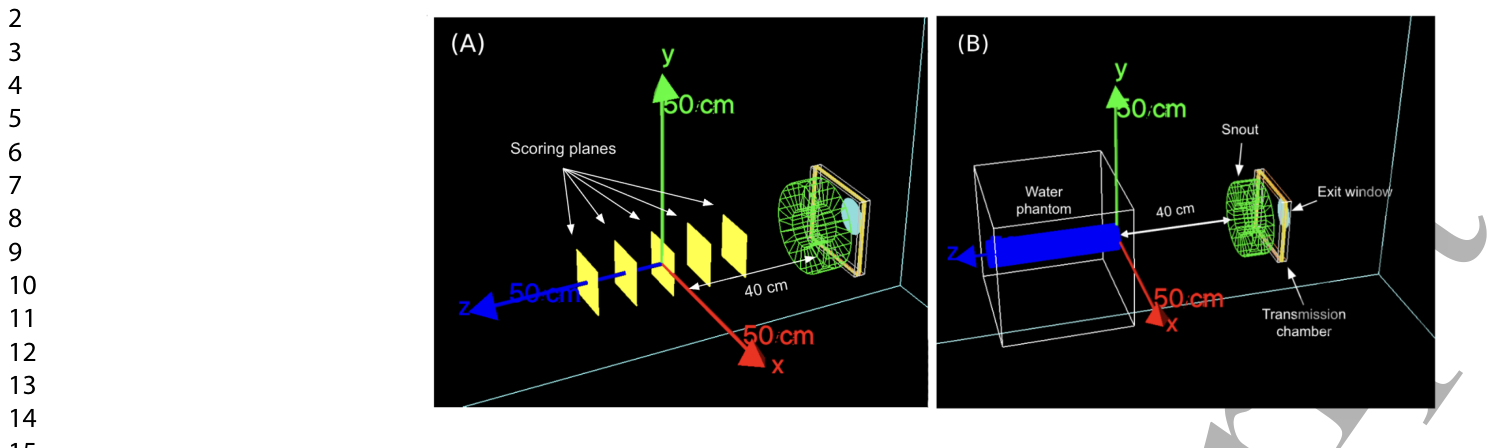
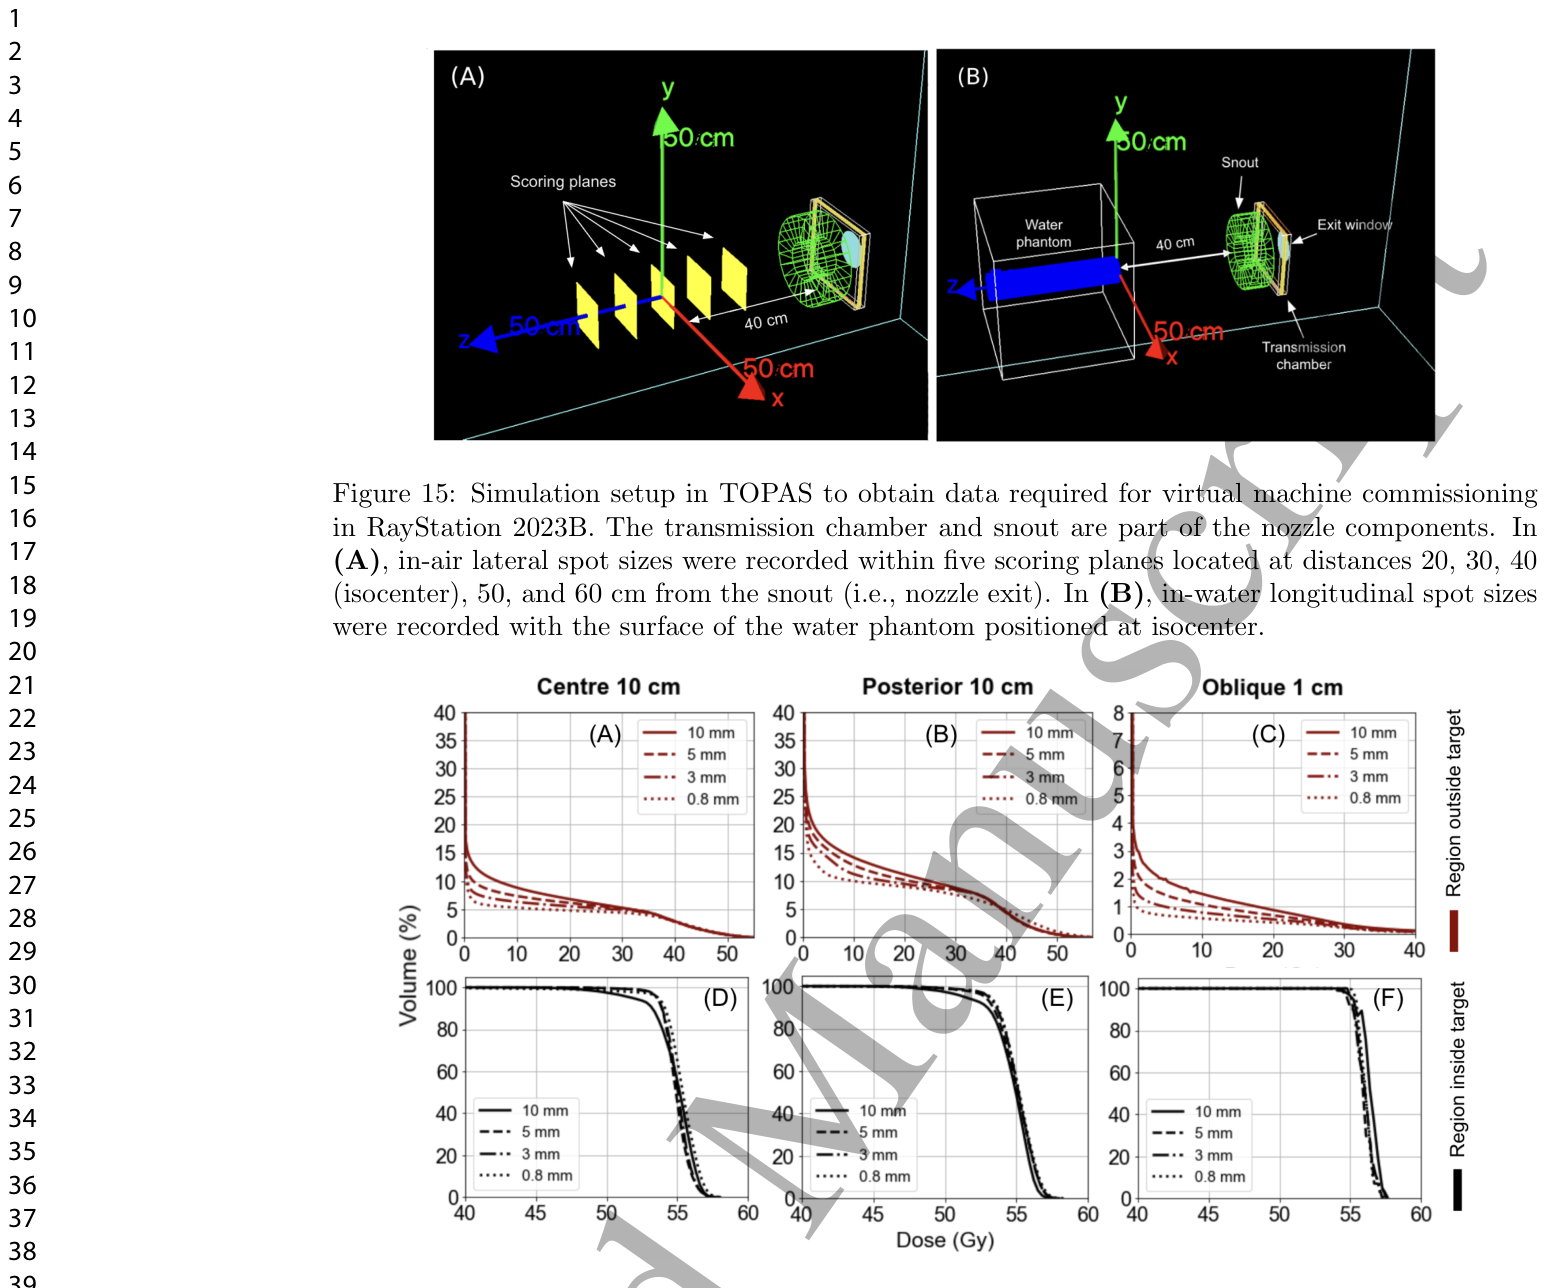
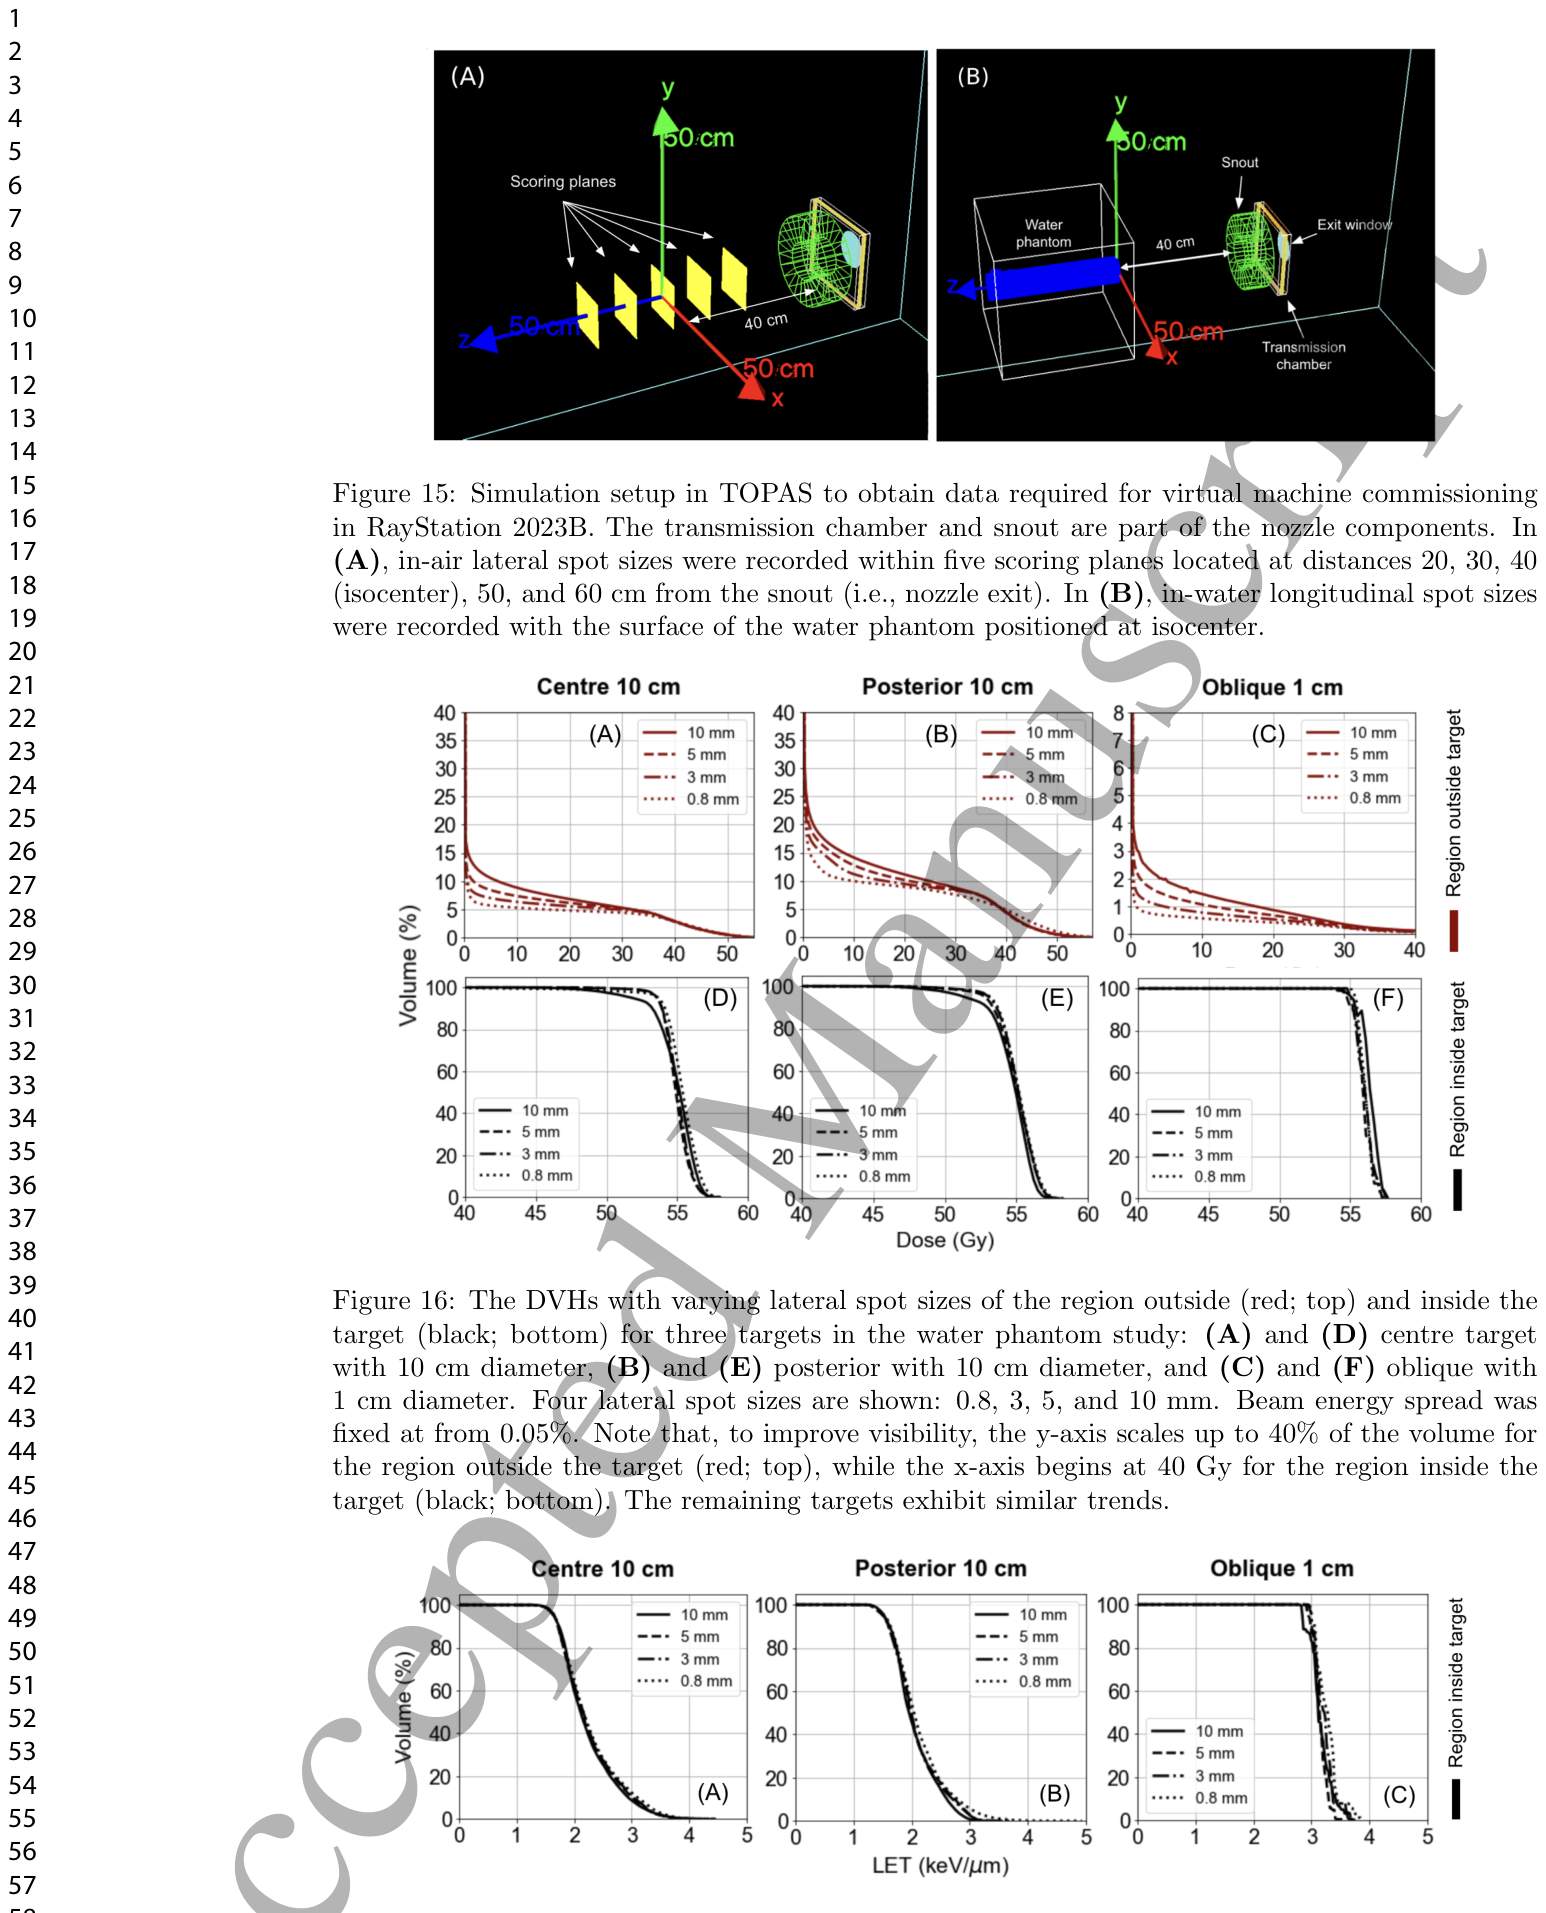
Figure 15. Figure 15: Simulation setup in TOPAS to obtain data required for virtual machine commissioning in RayStation 2023B. The transmission chamber and snout are part of the nozzle components. In (A), in-air lateral spot sizes were recorded within five scoring planes located at distances 20, 30, 40 (isocenter), 50, and 60 cm from the snout (i.e., nozzle exit). In (B), in-water longitudinal spot sizes were recorded with the surface of the water phantom positioned at isocenter.
Figure 16
Figure 16. Figure 16: The DVHs with varying lateral spot sizes of the region outside (red; top) and inside the target (black; bottom) for three targets in the water phantom study: (A) and (D) centre target with 10 cm diameter, (B) and (E) posterior with 10 cm diameter, and (C) and (F) oblique with 1 cm diameter. Four lateral spot sizes are shown: 0.8, 3, 5, and 10 mm. Beam energy spread was fixed at from 0.05%. Note that, to improve visibility, the y-axis scales up to 40% of the volume for the region outside the target (red; top), while the x-axis begins at 40 Gy for the region inside the target (black; bottom). The remaining targets exhibit similar trends.
Figure 17
Figure 17. Figure 17: The LVHs with varying lateral spot sizes of the region inside the target for three targets: (A) centre target with 10 cm diameter, (B) posterior with 10 cm diameter, and (C) oblique with 1 cm diameter. Four lateral spot sizes are shown: 0.8, 3, 5, and 10 mm. Beam energy spread was fixed at 0.05% to 5%.
Figure 18
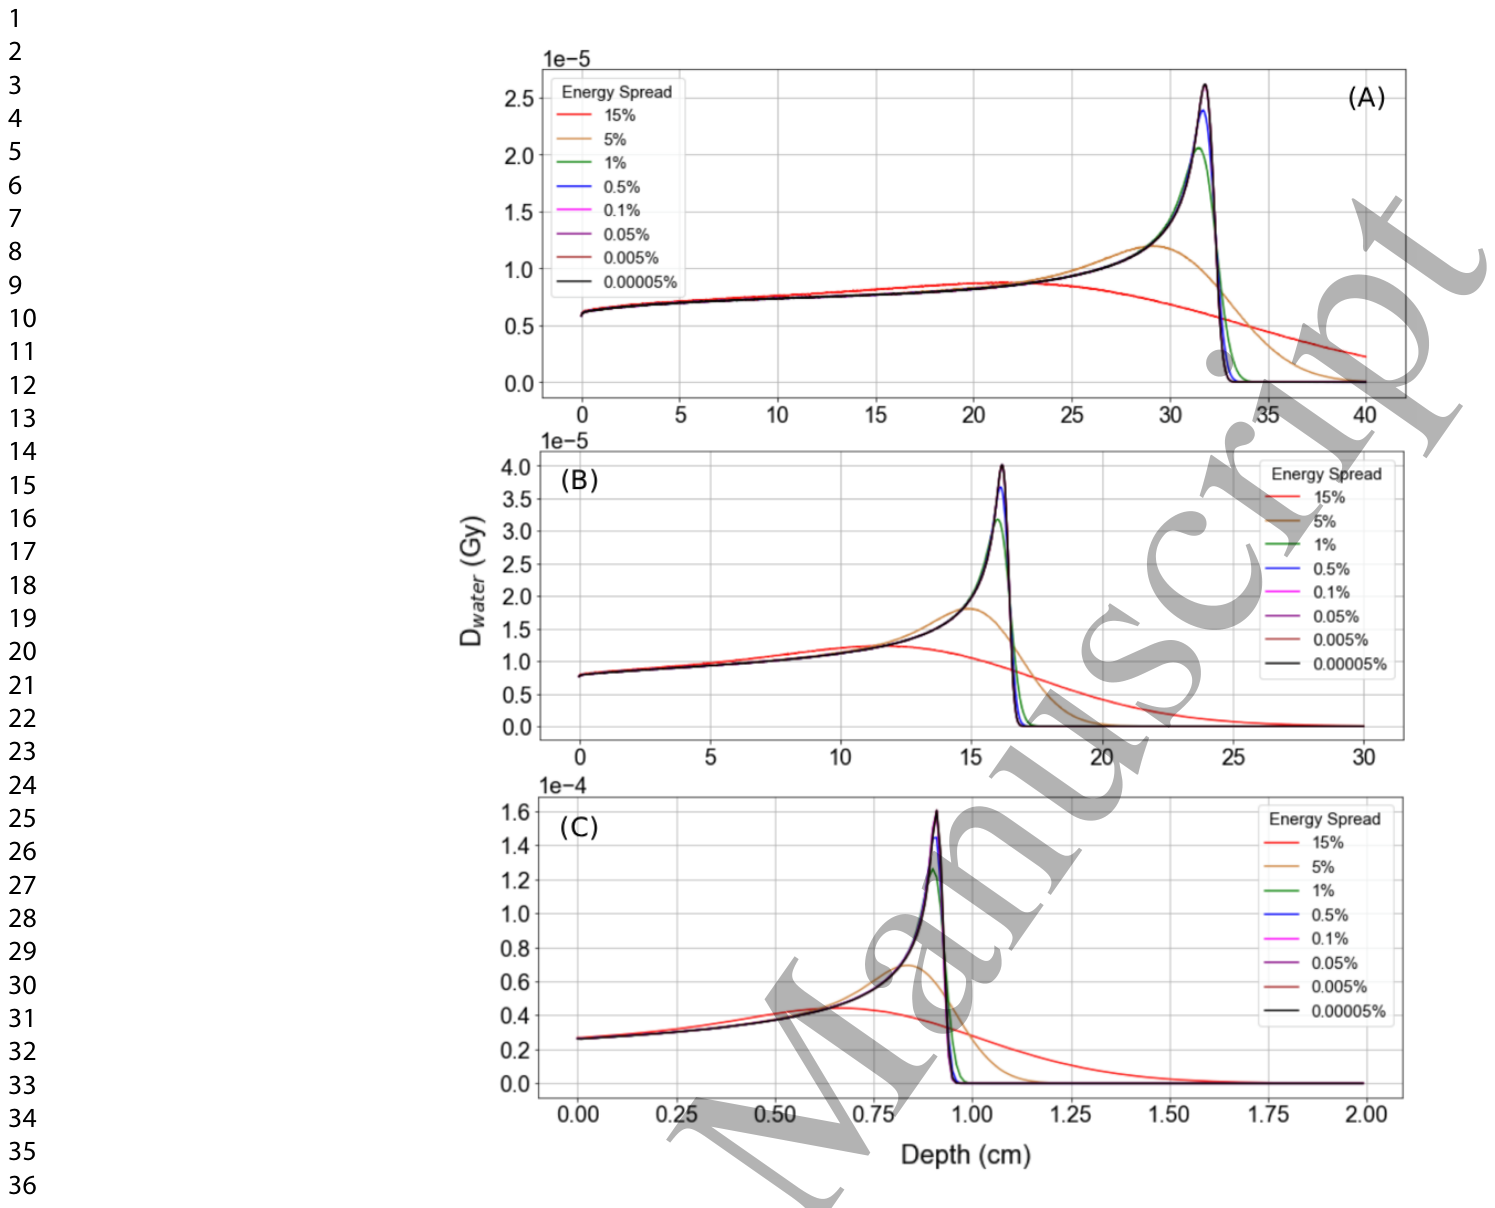
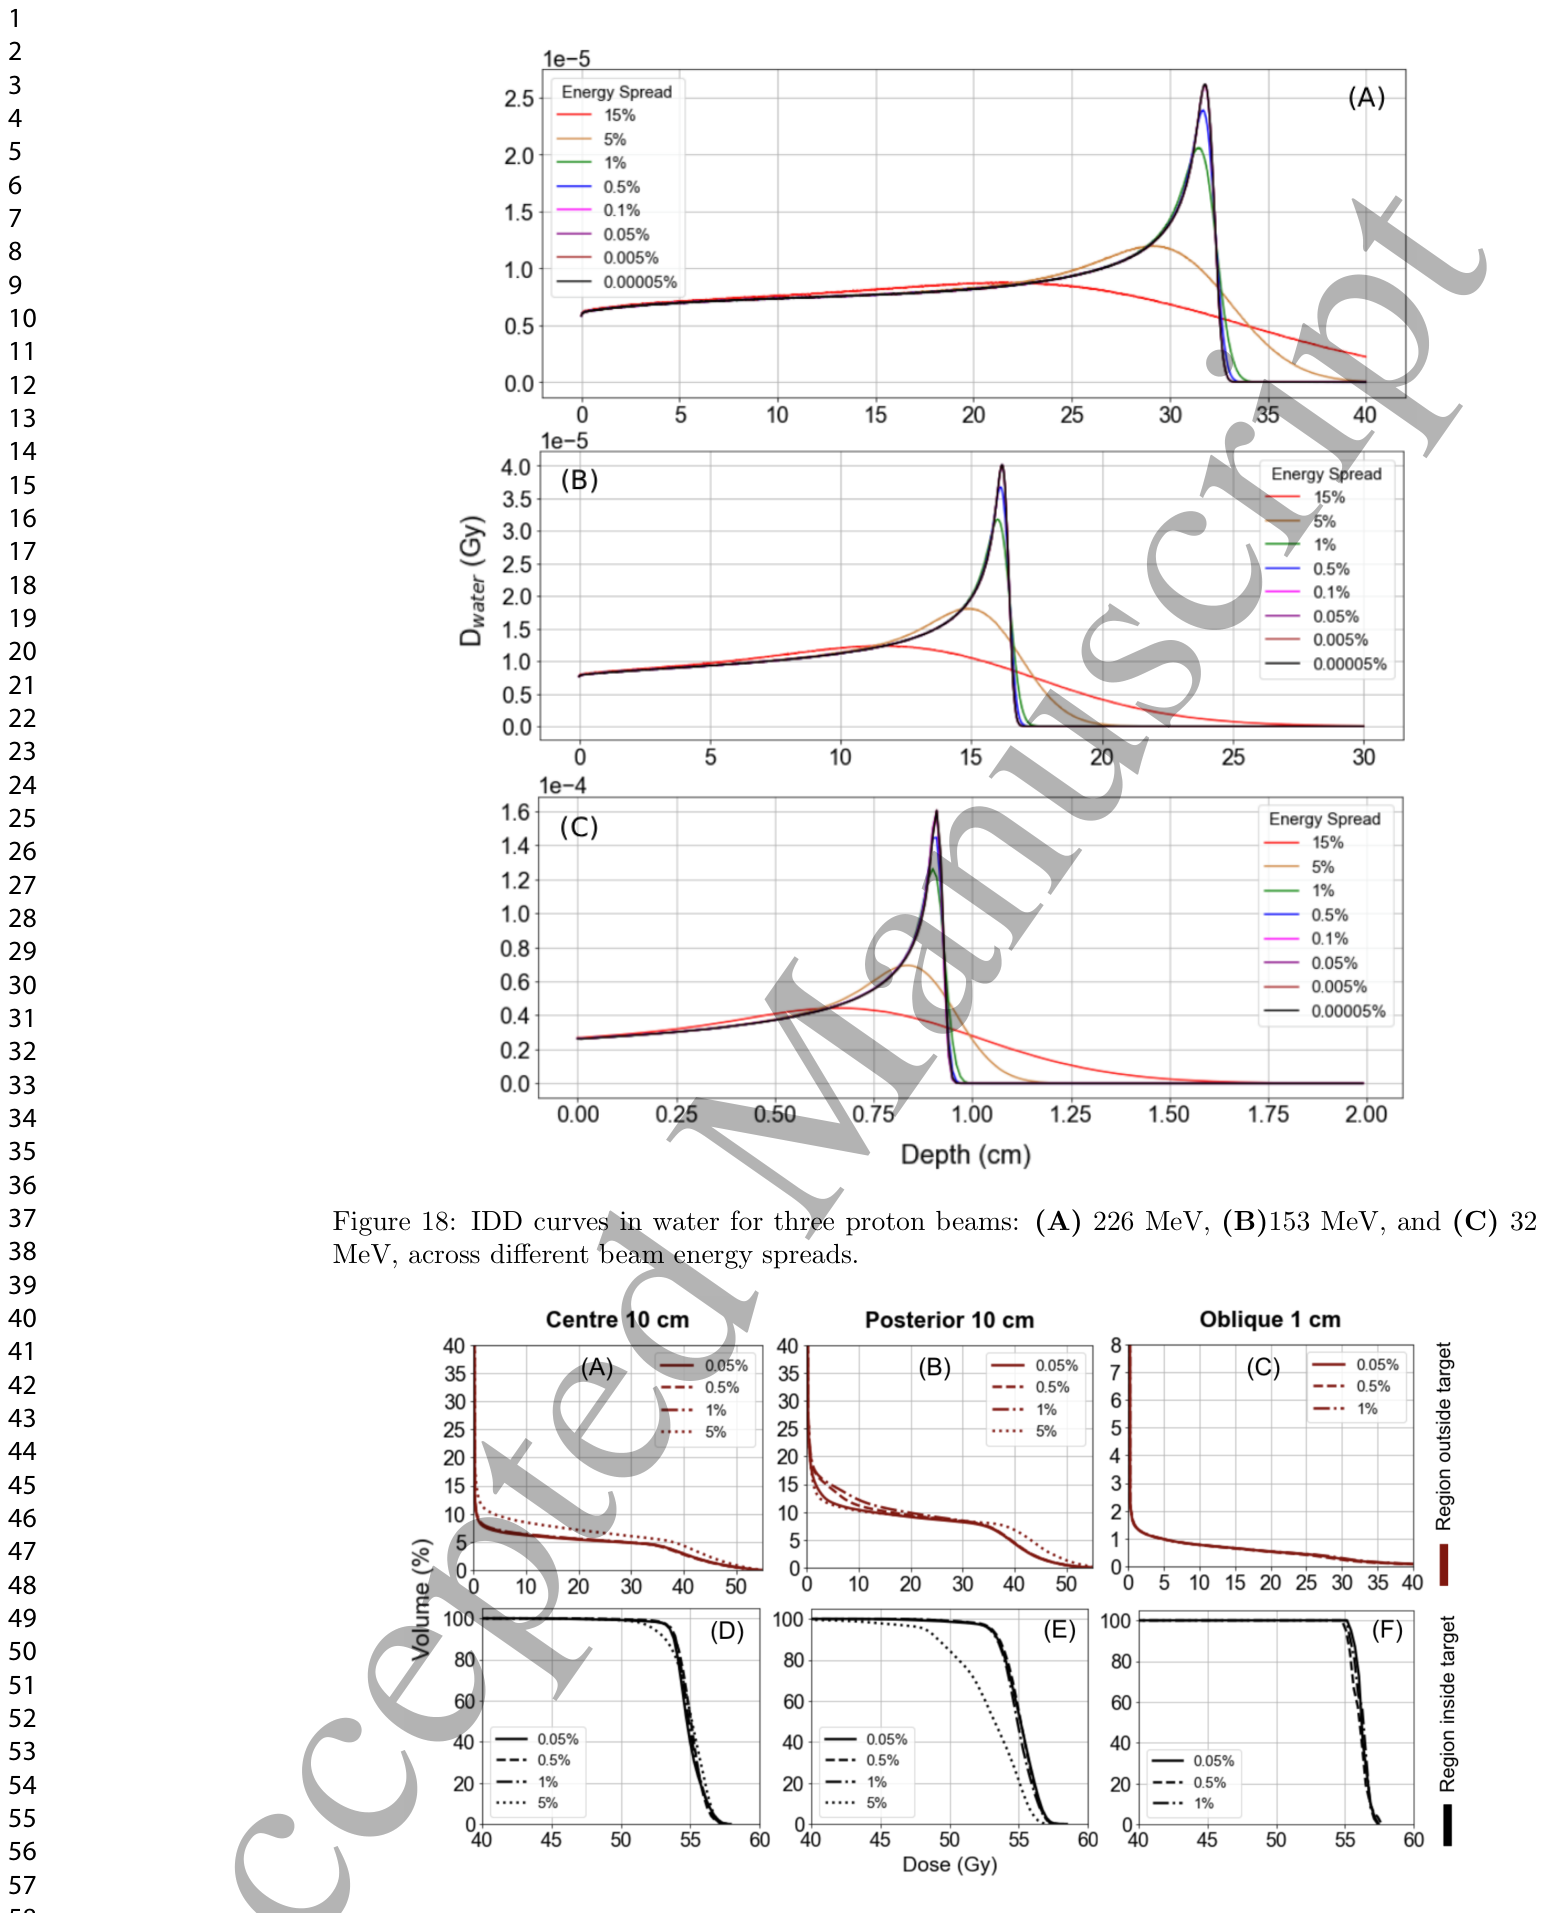
Figure 18. Figure 18: IDD curves in water for three proton beams: (A) 226 MeV, (B)153 MeV, and (C) 32 MeV, across different beam energy spreads.
Figure 19
Figure 19. Figure 19: The DVHs with varying energy spreads of the region outside (red; top) and inside the target (black; bottom) for three targets: (A) and (D) centre target with 10 cm diameter, (B) and (E) posterior with 10 cm diameter, and (C) and (F) oblique with 1 cm diameter. Beam energy spread varied from 0.05% to 5%. Lateral spot size was fixed at 3 mm.
Figure 20
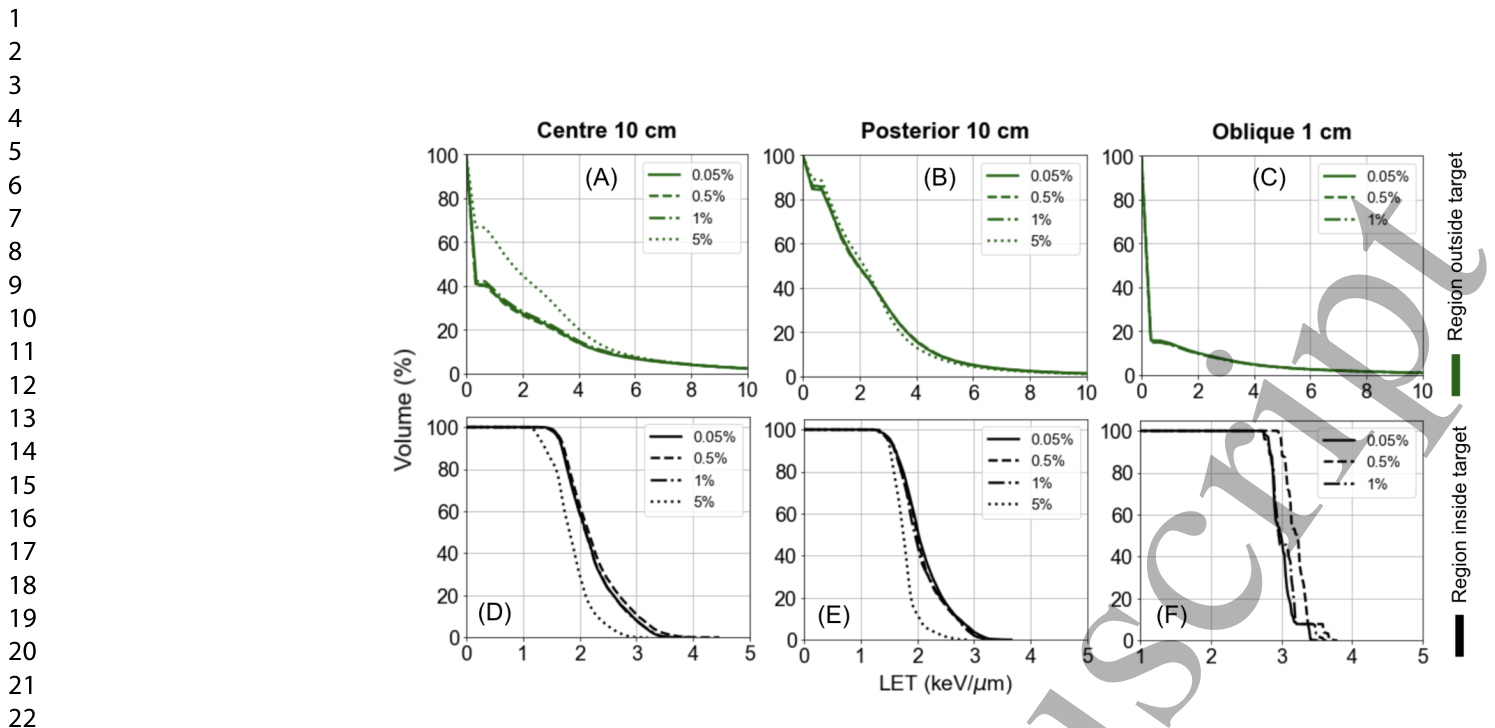
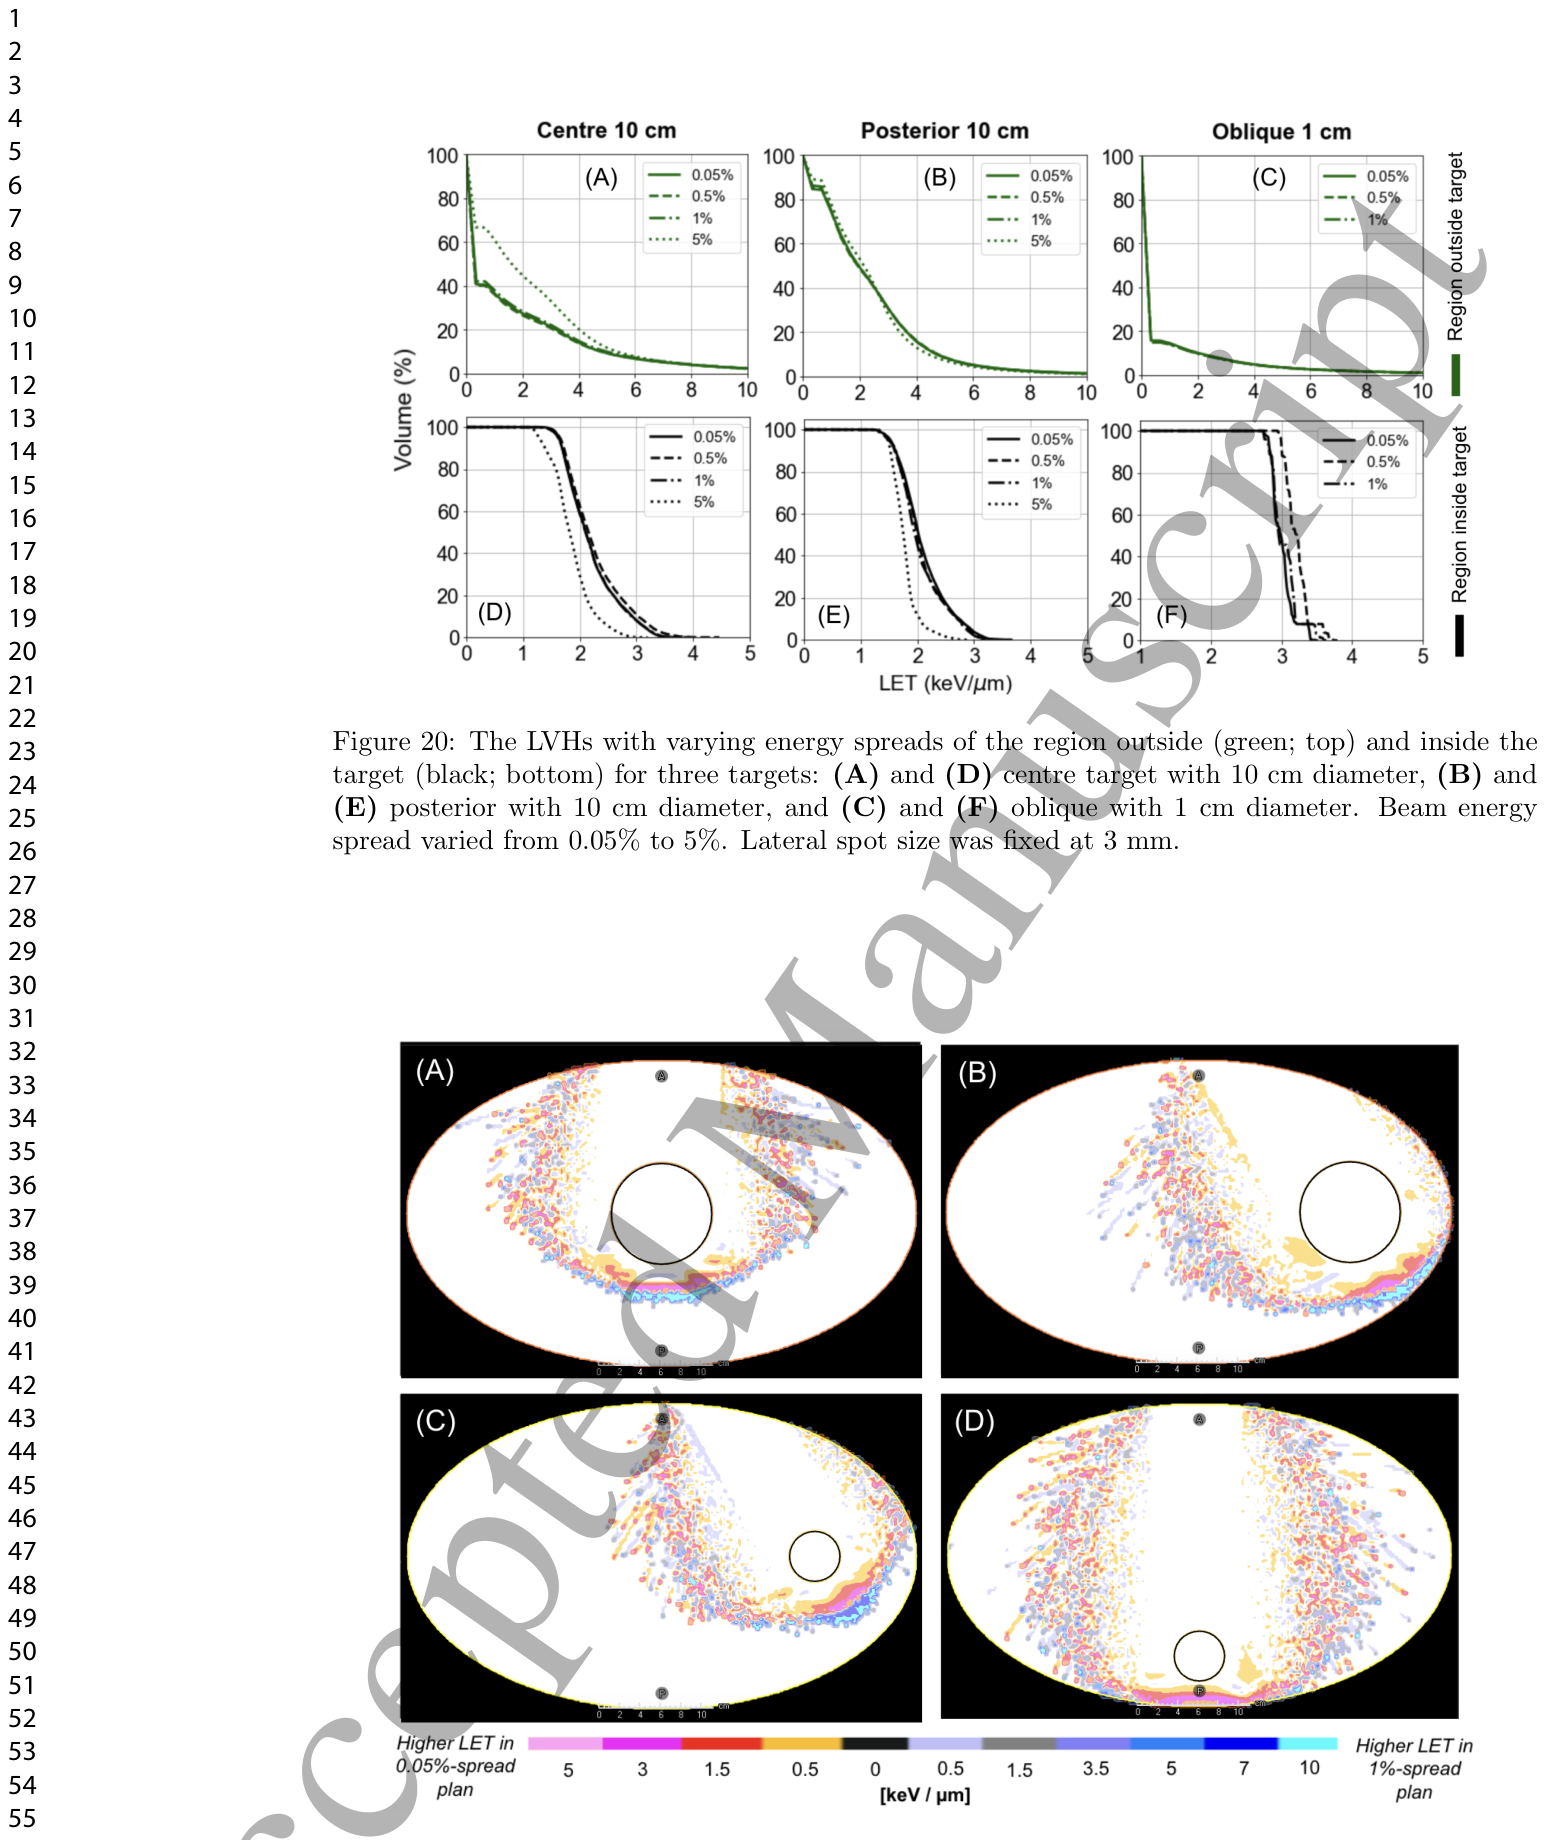
Figure 20. Figure 20: The LVHs with varying energy spreads of the region outside (green; top) and inside the target (black; bottom) for three targets: (A) and (D) centre target with 10 cm diameter, (B) and (E) posterior with 10 cm diameter, and (C) and (F) oblique with 1 cm diameter. Beam energy spread varied from 0.05% to 5%. Lateral spot size was fixed at 3 mm.
Figure 21
Figure 21. Figure 21: LET difference between treatment plans generated with beam energy spreads of 0.05% and 1%. Four targets are shown: (A) 10-cm diameter target at the centre, (B) 10-cm diameter target in an oblique position, (C) 5-cm diameter target in an oblique position, and (D) 5-cm diameter target in a posterior position. LET difference ranges from +5 to -10 keV/µm.




コメントを残す