どうも、Beyond the Pixelです。神経変性疾患は、正確な診断が難しく、その進行が対象者の生活に甚大な影響を与える破壊的な疾患群です。現時点での治療選択肢は限られていますが、早期かつ正確な診断は、症状の管理や病気の進行段階への対応において非常に重要となります。今回ご紹介する論文「Multimodality Imaging of Dementia: Clinical Importance and Role of Integrated Anatomic and Molecular Imaging」では、解剖学的構造画像と生理学的分子画像の両方が進化し、これらの神経変性プロセスを高精度かつ比較的早期に特定できるようになった現状がレビューされています。病気の根底にあるメカニズムを特定するためには、放射線専門家が異なる病気の分布と病態生理学的プロセスを理解することが不可欠です。高空間分解能MRIは微妙な形態学的変化、潜在的な合併症、および代替診断を検出することを可能にし、一方、分子画像は機能の変化や疾患特異的マーカーの異常な濃度変化を可視化します。これらの手法は互いに補完的であり、適切な検査と診断研究の解釈には、統合された多角的かつ多分野にわたるアプローチが求められます。
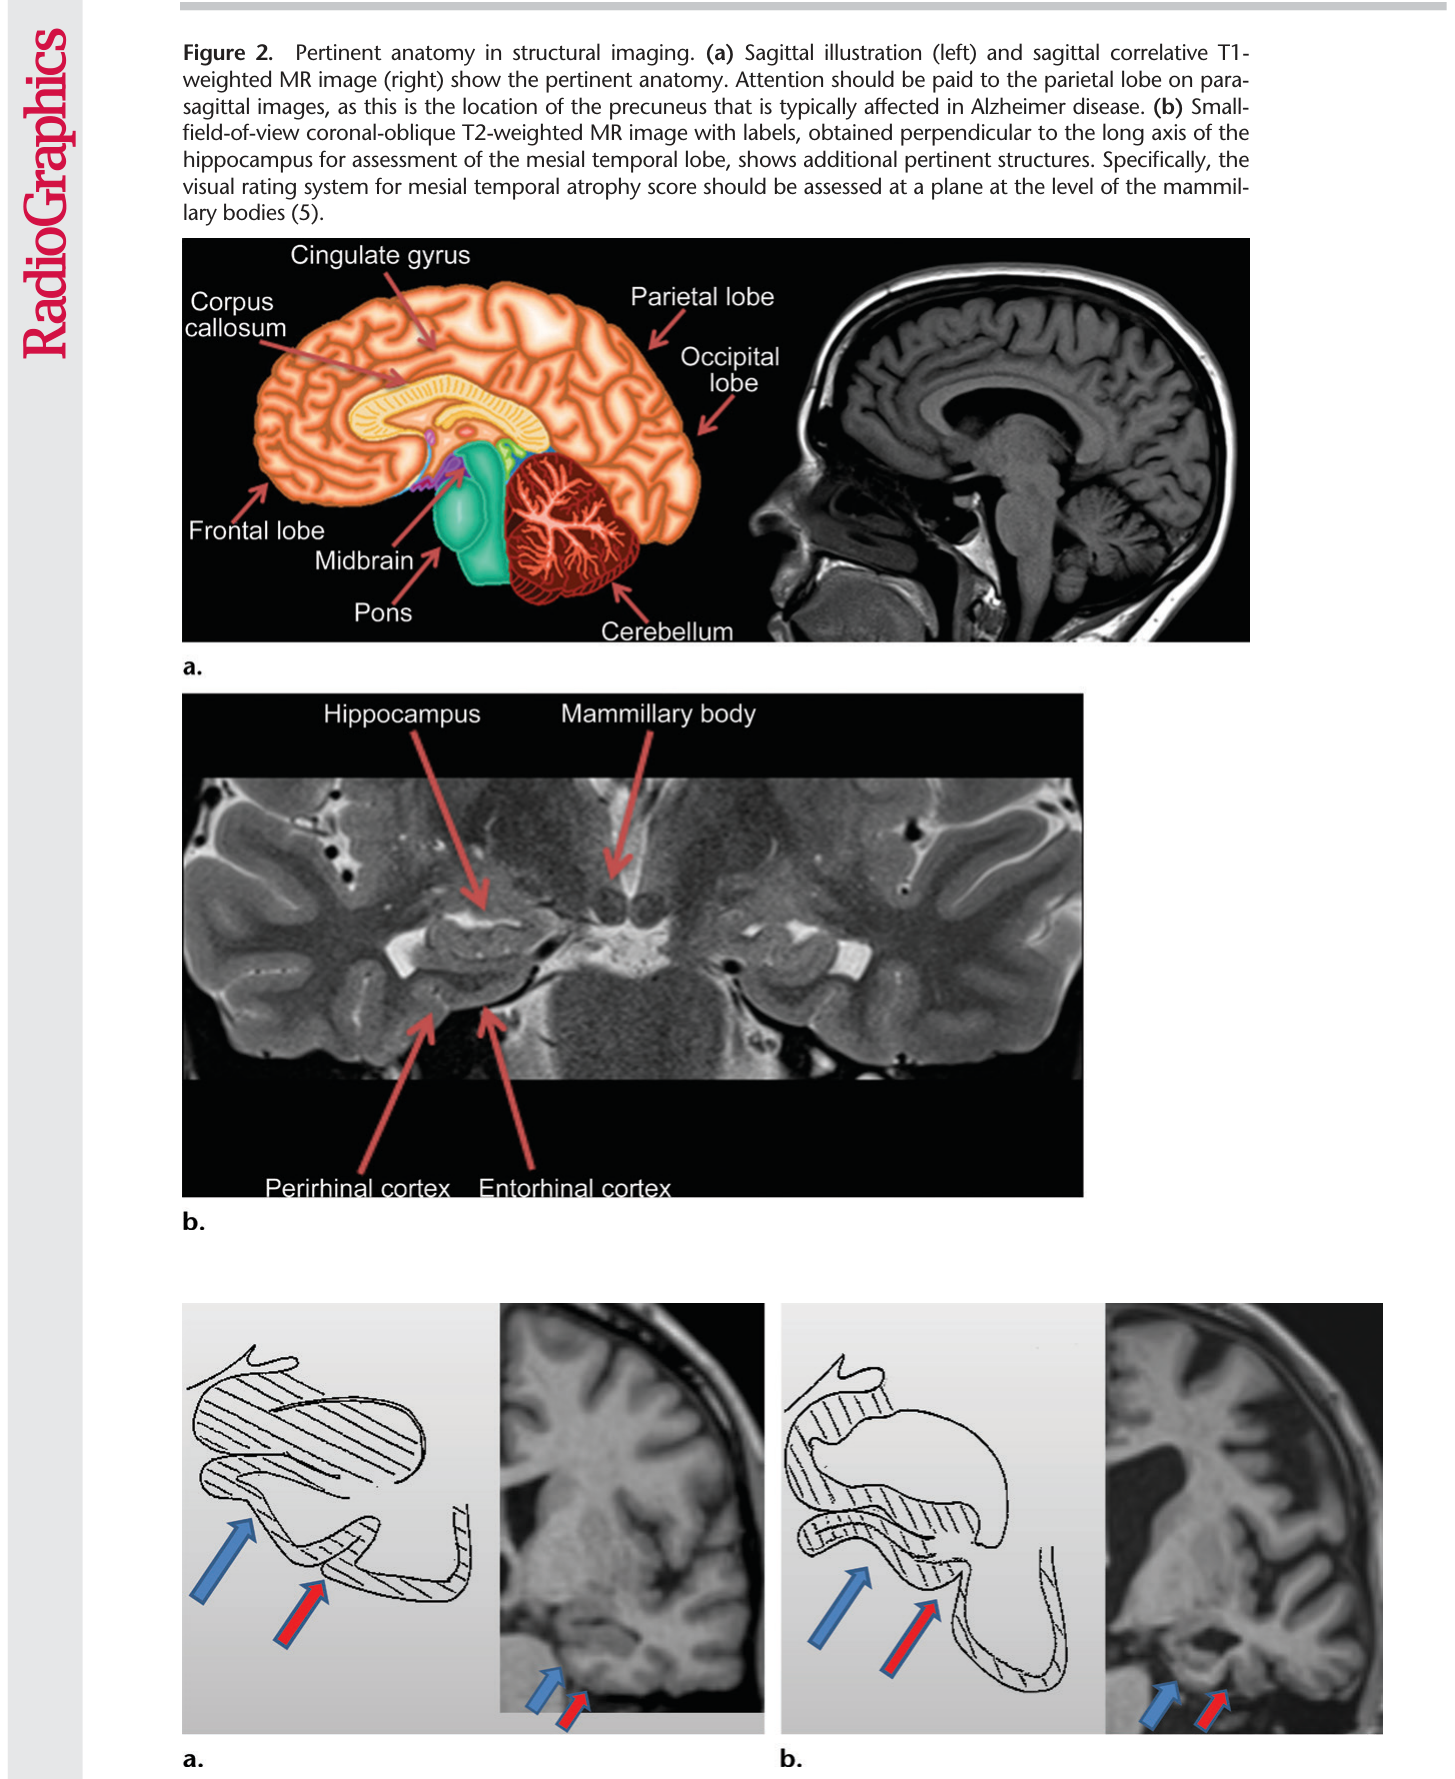
Figure 3. Figure 3. Mesial temporal lobe assessment. Diagonal lines = gray matter of the cortex. (a) Illustration (left) and coned-down coronal T1-weighted MR image (right) obtained for the assessment of mesial temporal atrophy show normal entorhinal cortex (blue arrows), hippocampus, and perirhinal cortex (red arrows) volumes. (b) Corresponding illustration (left) and MR image (right) in a patient with clinical mild cognitive impairment shows moderate to severe atrophy of the entorhinal cortex (blue arrows) and hippocampus and moderate atrophy of the perirhinal cortex (red arrows).解説: 海馬傍回、海馬、嗅内皮質の萎縮度を視覚的に評価するための図とMR画像を示しています。正常な状態と、軽度認知障害の対象者の画像が比較されており、後者ではこれらの領域に中等度から重度の萎縮が見られます。
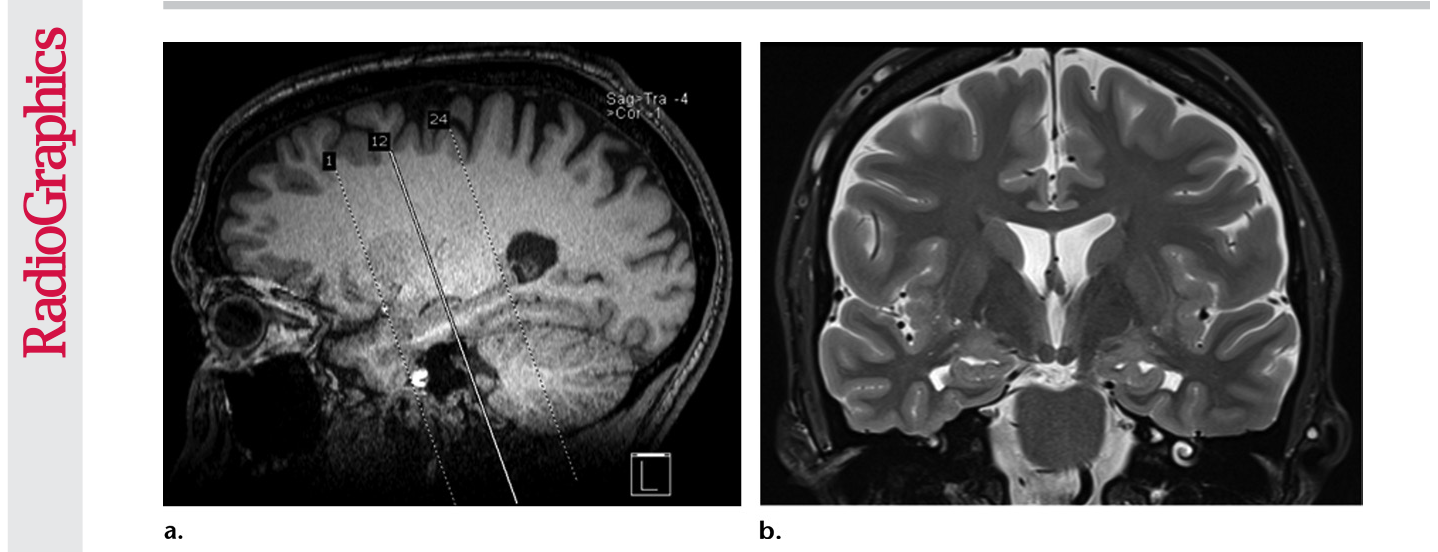
Figure 4. Figure 4. Recommended imaging sequences and acquisition. Sagittal high-spatial-resolution T1-weighted MR image (a) shows the appropriate prescription (dotted lines), perpendicular to the long axis of the hippocampus, for obtaining the coronal-oblique T2-weighted MR image (b), which is recommended for the assessment of the mesial temporal lobe (10). Solid line in a = section from which image b was prescribed.解説: 海馬の長軸に垂直な冠状斜位T2強調MR画像を取得するための高空間分解能T1強調MR画像上での撮像位置を示しています。これは中側頭葉の評価に推奨されるシーケンスです。
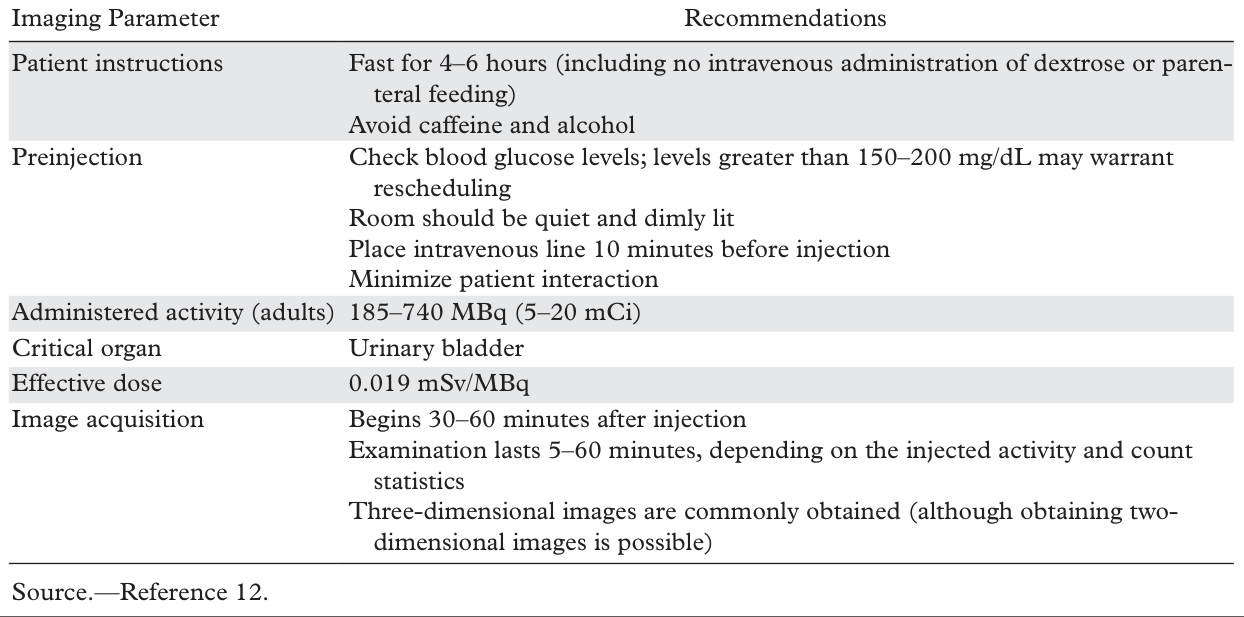
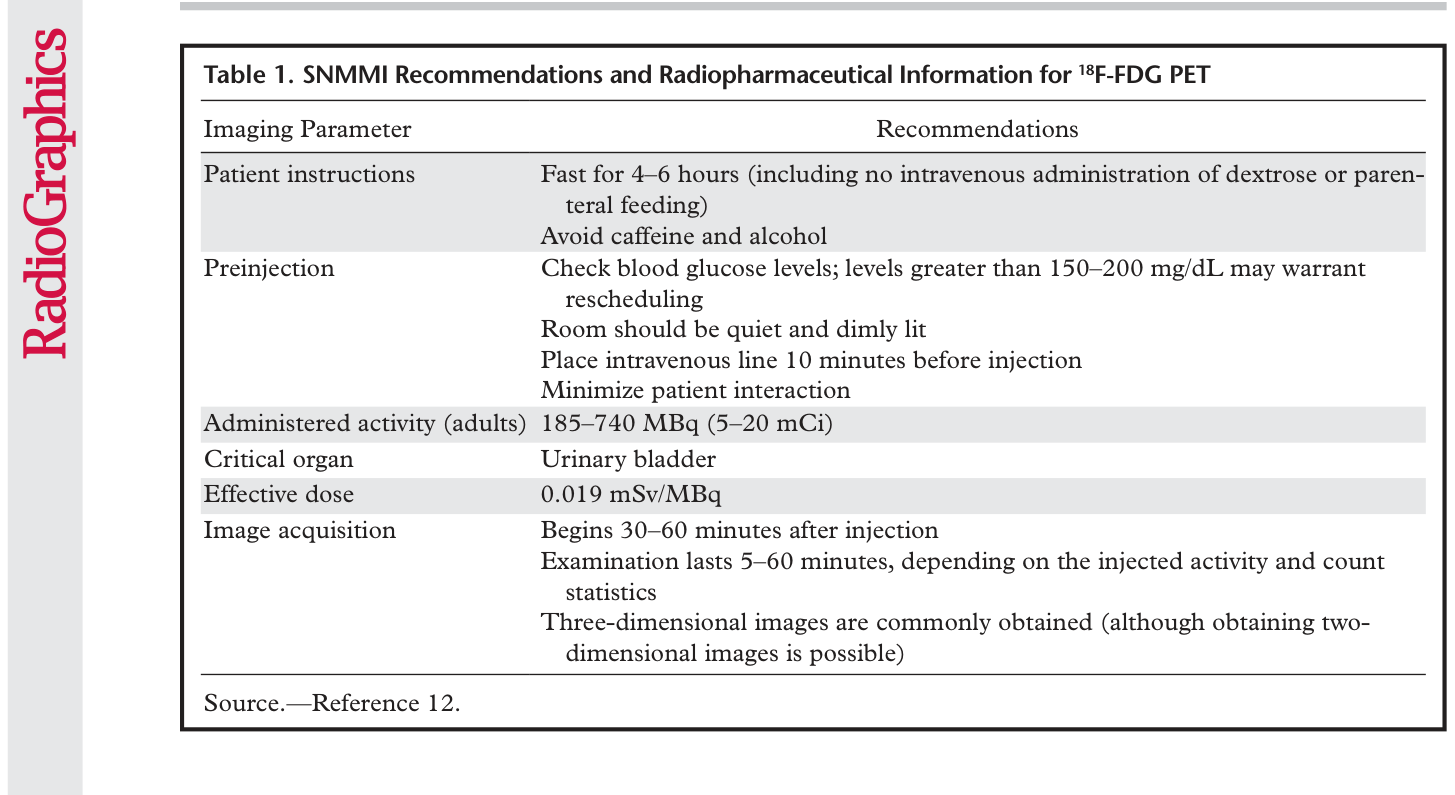
FDGは、現代のPETで最も一般的に使用される造影剤です。陽電子放出性の18Fが通常のグルコースのヒドロキシル基と置換され、標準的なグルコース輸送体によって取り込まれる分子となります。この分子は細胞内でリン酸化されて閉じ込められ、代謝が活発な細胞に蓄積します。これにより、腫瘍学PETで最も一般的に使用される代謝マップが作成されます。さらに、脳はほぼ完全にグルコースに依存しており、代謝が活発であるため、機能している大脳皮質を可視化できます。機能低下は非特異的ではありますが、代謝障害の分布を示すことができ、構造MRIと同様に疾患プロセスの鑑別を可能にします。FDG PETとMRIは、所見を確認し、構造変化としてまだ現れていない早期の異常を特定するために併用すると有用です。FDG PETの撮像プロトコルは従来の腫瘍学PETといくつかの類似点があり、Society of Nuclear Medicine and Molecular Imaging (SNMMI) の手技基準から採用されたガイドラインが
Table 1. Table 1. SNMMI Recommendations and Radiopharmaceutical Information for 18F-FDG PET解説: 18F-FDG PET検査に関するSNMMIの推奨事項と放射性医薬品情報を示しています。対象者の指示(絶食時間、カフェイン・アルコール回避など)、前処置(血糖値チェック、静かで薄暗い環境など)、投与量、主要臓器、実効線量、および画像取得に関する情報が記載されています。
Figure 6. Figure 6. Normal amyloid uptake. (a) Axial 18F-florbetaben-amyloid PET image shows nor- mal uptake throughout the white matter, with sparing of the cortical gray matter. (b) Axial 18F- florbetaben-amyloid PET image shows spared cerebellar gray matter. Gray-white differentia- tion should be determined by internal control using the axial imaging plane at the level of the cerebellum, as cerebellar gray matter is almost always spared from amyloid deposition, even in advanced cases of dementia.解説: 正常なアミロイドPET画像におけるアミロイド取り込みパターンを示しています。皮質灰白質が温存され、白質全体に正常な取り込みが見られます。小脳灰白質はアミロイド沈着をほとんど示さないため、内部対照として用いられます。⚠ 自動抽出画像の検証で一致を確認できませんでした。正確な内容は元論文のFigure 6をご参照ください。
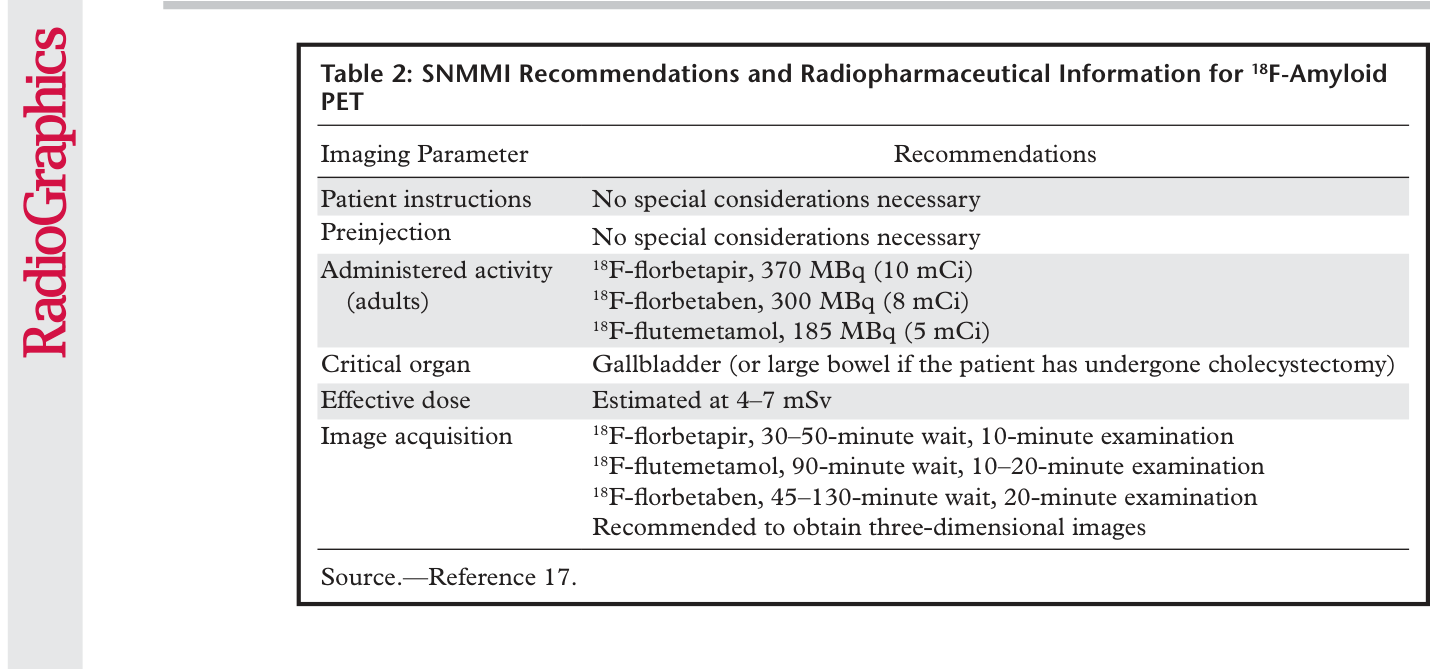
Table 2. Table 2: SNMMI Recommendations and Radiopharmaceutical Information for 18F-Amyloid PET解説: 18F-アミロイドPET検査に関するSNMMIの推奨事項と放射性医薬品情報を示しています。対象者の指示や前処置に特別な考慮事項は不要であり、投与される放射能、主要臓器、実効線量、および画像取得時間に関する情報が含まれています。
Figure 7. Figure 7. Illustration shows a synapse at a dopaminergic neu- ron. The green terminal is the pre- synaptic terminal, and the orange terminal is the postsynaptic termi- nal. Dopamine molecules are cre- ated in the presynaptic neuron and transported into vesicles by vesicu- lar monoamine transporters. These vesicles release the dopamine mol- ecules into the synapse, where the dopamine can then interact with dopamine receptors (D1 and D2 receptors). The dopamine can then either be degraded by catechol-O- methyltransferase (not shown) or taken back up into the presynaptic neuron and recycled through the dopamine transporter. The dopa- mine transporter is the target of binding, allowing identification of dopaminergic neurons.解説: ドーパミン作動性ニューロンにおけるシナプスを示したイラストです。ドーパミンは前シナプス終末で生成され、シナプスに放出された後、ドーパミン受容体と作用します。その後、ドーパミン輸送体によって前シナプスニューロンに回収されます。このドーパミン輸送体が123I-イオフルパンの結合標的となります。⚠ 自動抽出画像の検証で一致を確認できませんでした。正確な内容は元論文のFigure 7をご参照ください。
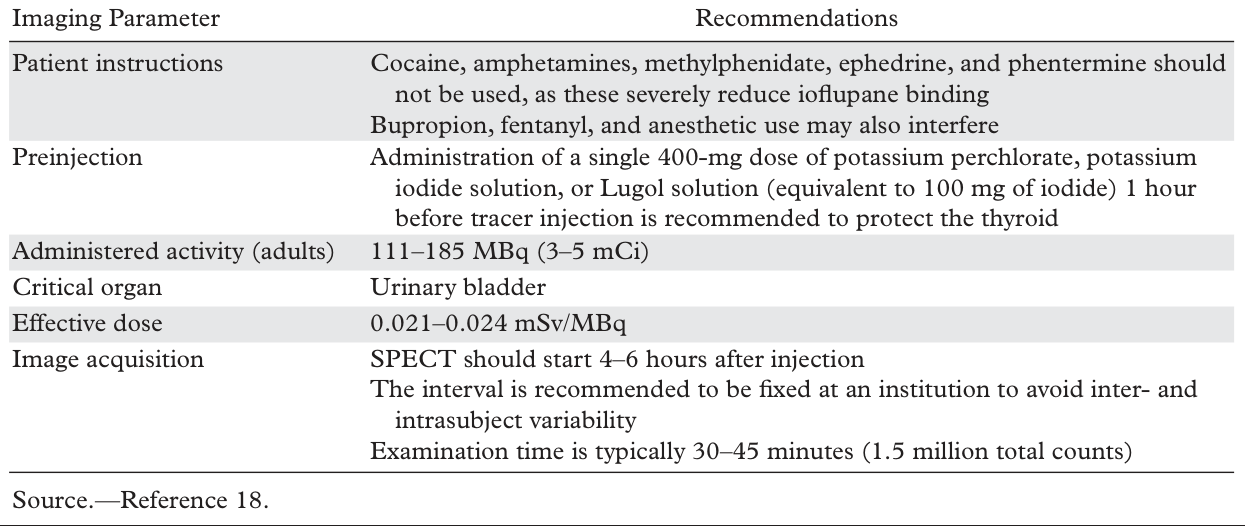
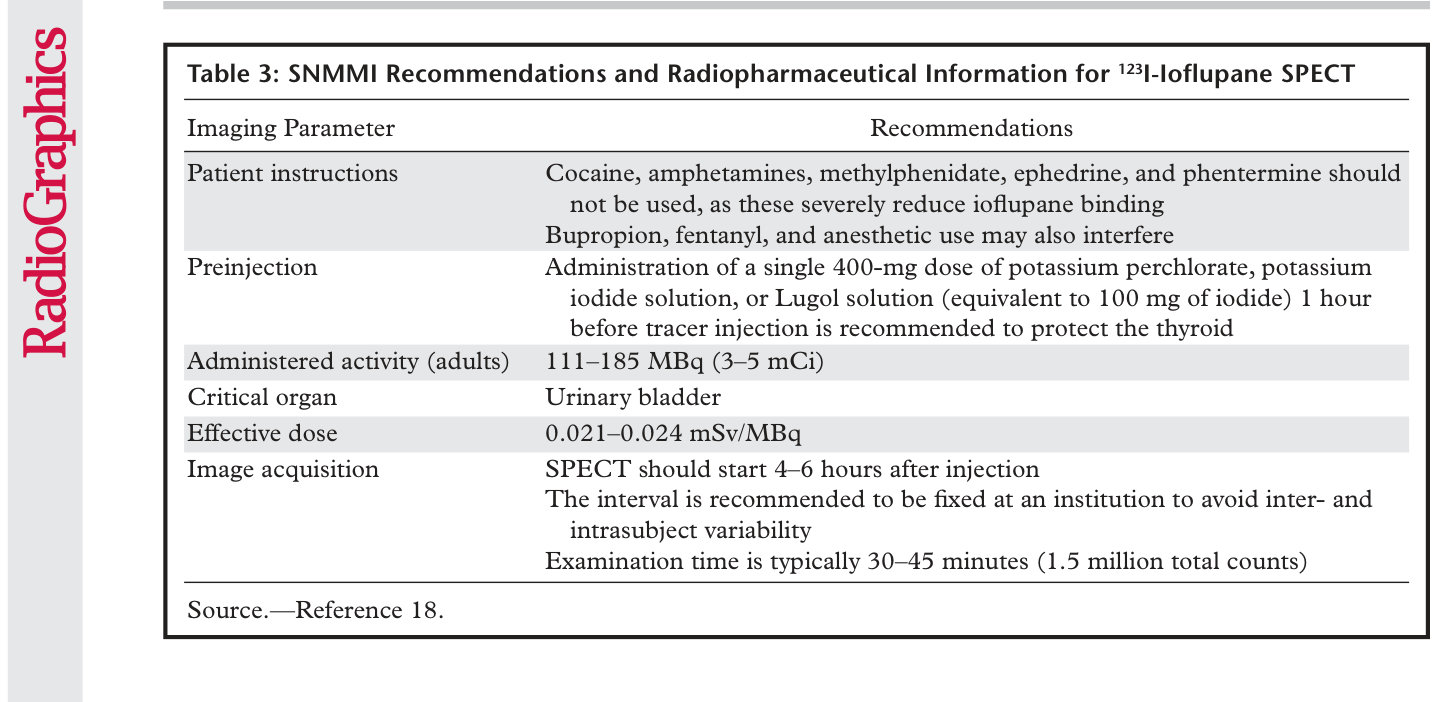
Table 3. Table 3: SNMMI Recommendations and Radiopharmaceutical Information for 123I-Ioflupane SPECT解説: 123I-イオフルパンSPECT検査に関するSNMMIの推奨事項と放射性医薬品情報を示しています。イオフルパン結合を著しく阻害する薬剤(コカイン、アンフェタミンなど)の回避、甲状腺保護のためのヨウ素摂取、投与される放射能、主要臓器、実効線量、および画像取得に関する詳細が記載されています。
Figure 9. Figure 9. Normal and abnormal findings on τ-PET images. (a) Axial 18F-AV-1451 τ-PET image obtained at the convexities shows minimal radiotracer uptake. Additional imaging throughout the brain (not shown) did not show signifi- cant focal uptake at any location. (b) Axial τ-PET image of a patient with cognitive impairment shows discrete abnormal radiotracer ac- cumulation (arrow) in the right parietal lobe.解説: タウPET画像における正常および異常な所見を示しています。(a) 脳の表面でのトレーサー取り込みが最小限の正常なタウPET画像。(b) 認知機能障害のある対象者のタウPET画像で、右頭頂葉に局所的な異常トレーサー蓄積が見られます。⚠ 自動抽出画像の検証で一致を確認できませんでした。正確な内容は元論文のFigure 9をご参照ください。
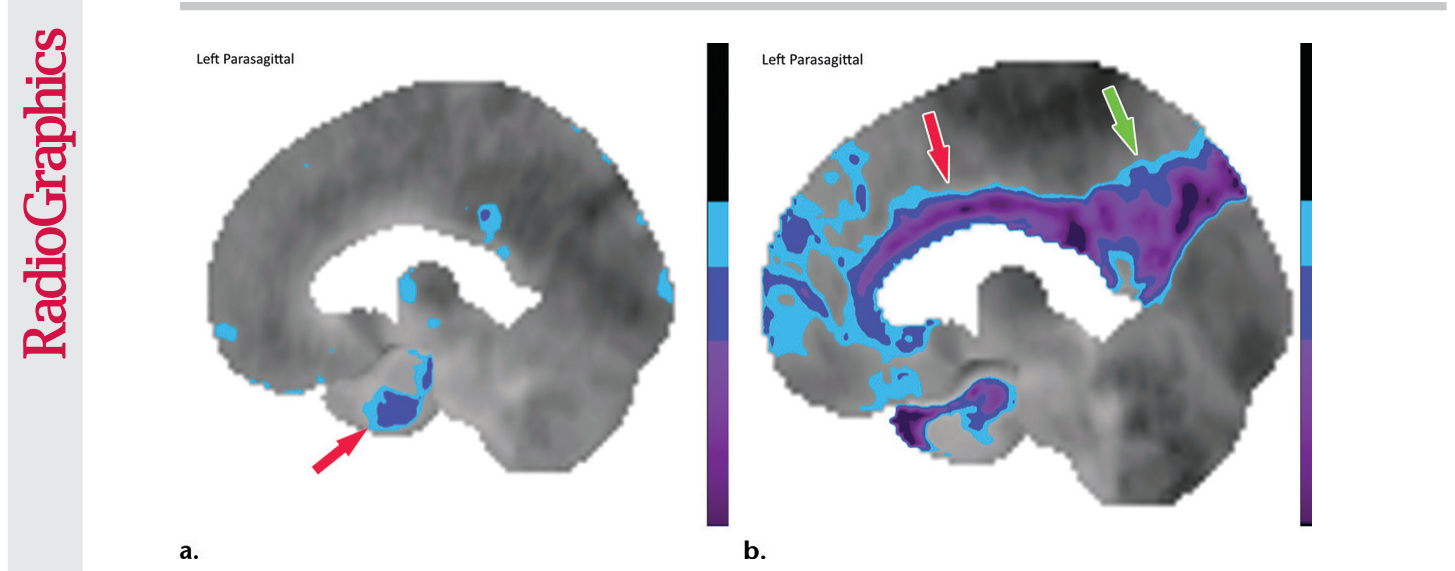
Figure 10. Figure 10. Computer-aided quantitation in FDG PET. (a) Sagittal color map of the z score of FDG uptake in a normal subject shows only minimal decreased uptake at the left mesial temporal lobe (arrow). (b) Sagittal color map in a patient with Alzheimer disease shows characteristic markedly decreased uptake along the cingulate gyrus (red arrow) and left precuneus region (green arrow). In these examples, light blue areas represent a z score between 1.6 and 2.3解説: FDG PETにおけるコンピューター支援定量化を示しています。(a) 正常な対象者のFDG取り込みZスコアの矢状カラーマップで、左中側頭葉にわずかな取り込み低下が見られます。(b) アルツハイマー病の対象者の矢状カラーマップで、帯状回と左楔前部領域に著しい取り込み低下が見られます。
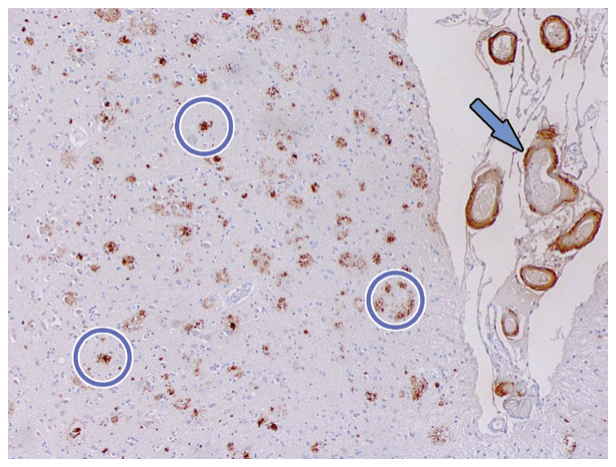
Figure 11. Figure 11. β-amyloid staining. Photomicrograph of the mid- frontal cortex with amyloid-β-5 staining in a patient with de- mentia shows numerous aggregates of extracellular amyloid plaque (circles). Amyloid deposition is also depicted along adjacent vascular walls (arrow). These aggregates are the site of binding of amyloid PET radiotracers. Although the pres- ence of amyloid aggregates is sensitive for the detection of Al- zheimer disease, it is not highly specific and can be visualized in Alzheimer disease and certain cases of dementia with Lewy bodies (DLB). The significance of these plaques is still not well understood, and they may be either primary or secondary find- ings to the underlying disease process.解説: 認知症の対象者における、中前頭皮質のアミロイドベータ染色顕微鏡写真です。細胞外アミロイドプラークの多数の凝集体(円)と、隣接する血管壁に沿ったアミロイド沈着(矢印)が示されています。これらはアミロイドPET放射性トレーサーの結合部位です。
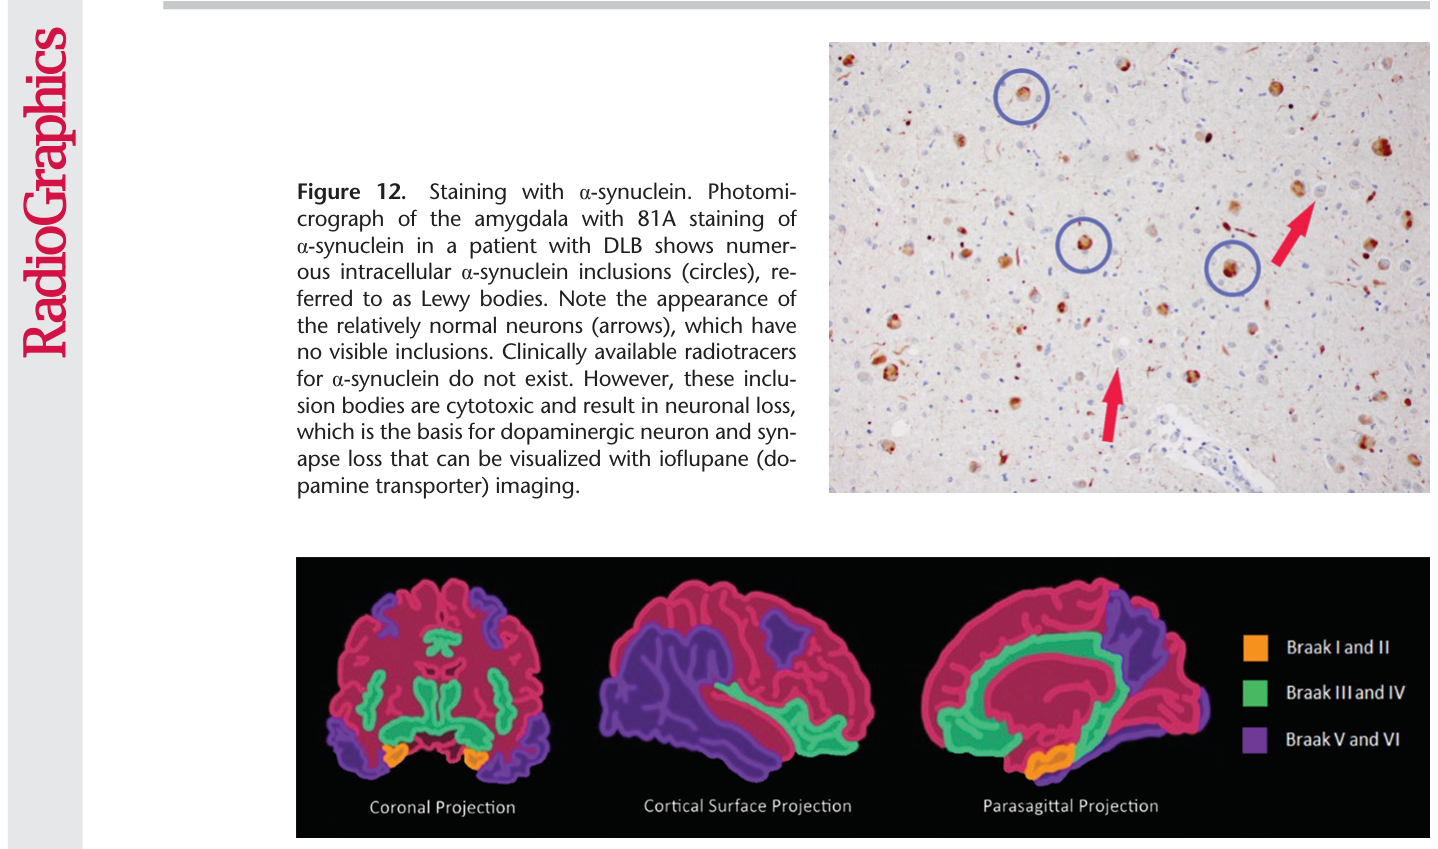
Figure 13. Figure 13. Illustrations show the Braak τ staging system in Alzheimer disease in three different imaging planes. Braak stages I and II (orange areas) are characterized by abnormal τ aggregation at the entorhinal cortex, with early involve- ment at the hippocampus. Braak stages III and IV (green areas) are characterized by more advanced hippocampal aggregation and further involvement of the limbic system. Braak stages V and VI (purple areas) are characterized by extension into the neocortex, specifically involving the precuneus, temporal lobes, and lingual gyrus. This staging pre- dicts the sequence of findings at structural imaging, FDG PET, and τ-based PET.解説: アルツハイマー病におけるBraakタウ病期分類システムを3つの異なる画像平面で示したイラストです。病期IおよびII(オレンジ色)は嗅内皮質と海馬早期病変、病期IIIおよびIV(緑色)は海馬と辺縁系のより進行した病変、病期VおよびVI(紫色)は楔前部、側頭葉、舌状回を含む新皮質への拡大を示します。
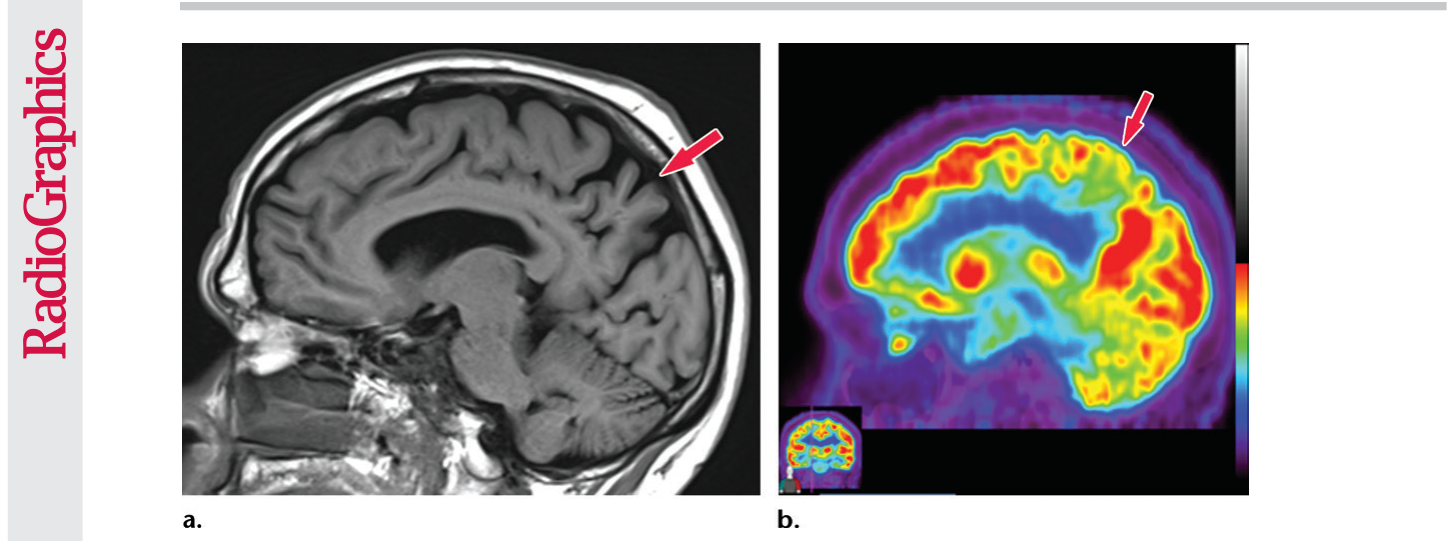
Figure 14. Figure 14. Alzheimer disease. (a) Sagittal T1-weighted MR image in a patient with memory loss shows dis- proportionate moderate volume loss in the precuneus (arrow), a finding suspicious for Alzheimer disease. The remainder of the brain parenchymal volume is relatively preserved. (b) Sagittal 18F-FDG PET image shows cor- responding decreased activity in the precuneus (arrow). Image inset shows a coronal section through the middle of the brain in this particular case to aid in lateralization. Normal uptake is depicted in the frontal and occipital regions, reinforcing the diagnosis of Alzheimer disease.
Figure 15
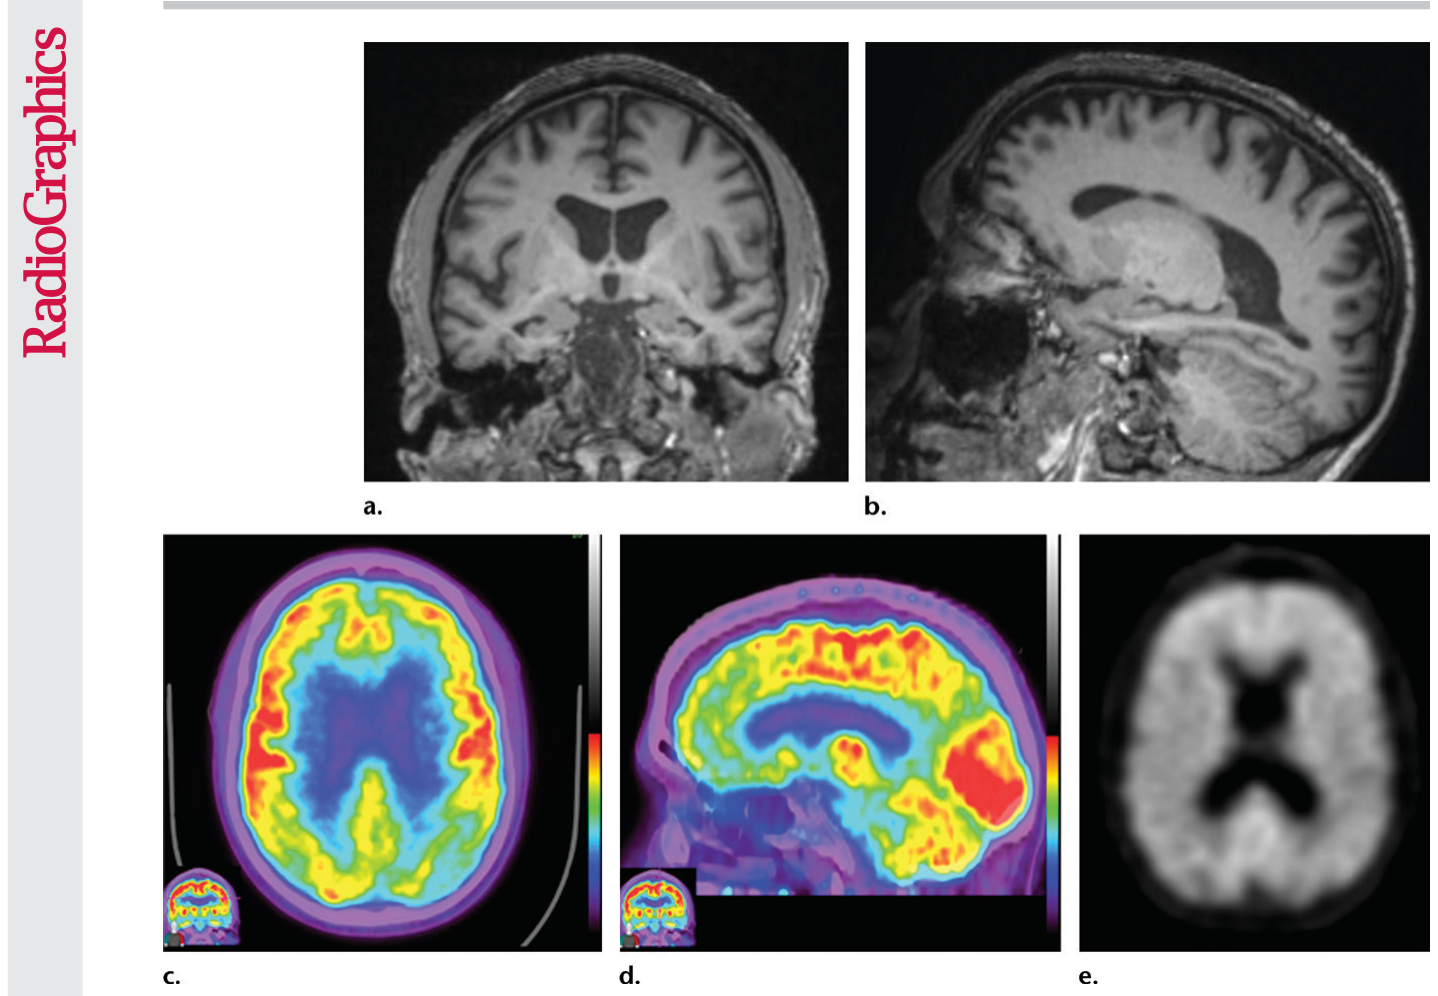
Figure 15. Figure 15. Alzheimer disease. (a, b) Coronal (a) and sagittal (b) T1-weighted MR images in a patient with suspected Alzheimer disease show mild-to-moderate generalized volume loss. (c, d) Axial (c) and sagittal (d) 18F-FDG PET images show markedly decreased activity in the bilateral frontal lobes and precunei. Image insets show a coronal section through the middle of the brain in this particular case to aid in lateralization. (e) Axial 18F-florbetaben image shows diffuse cortical uptake, which is a grossly abnormal finding, confirming amyloid deposition. Corroborative imaging findings are supportive of the clinical diagnosis of Alzheimer disease.
Figure 16
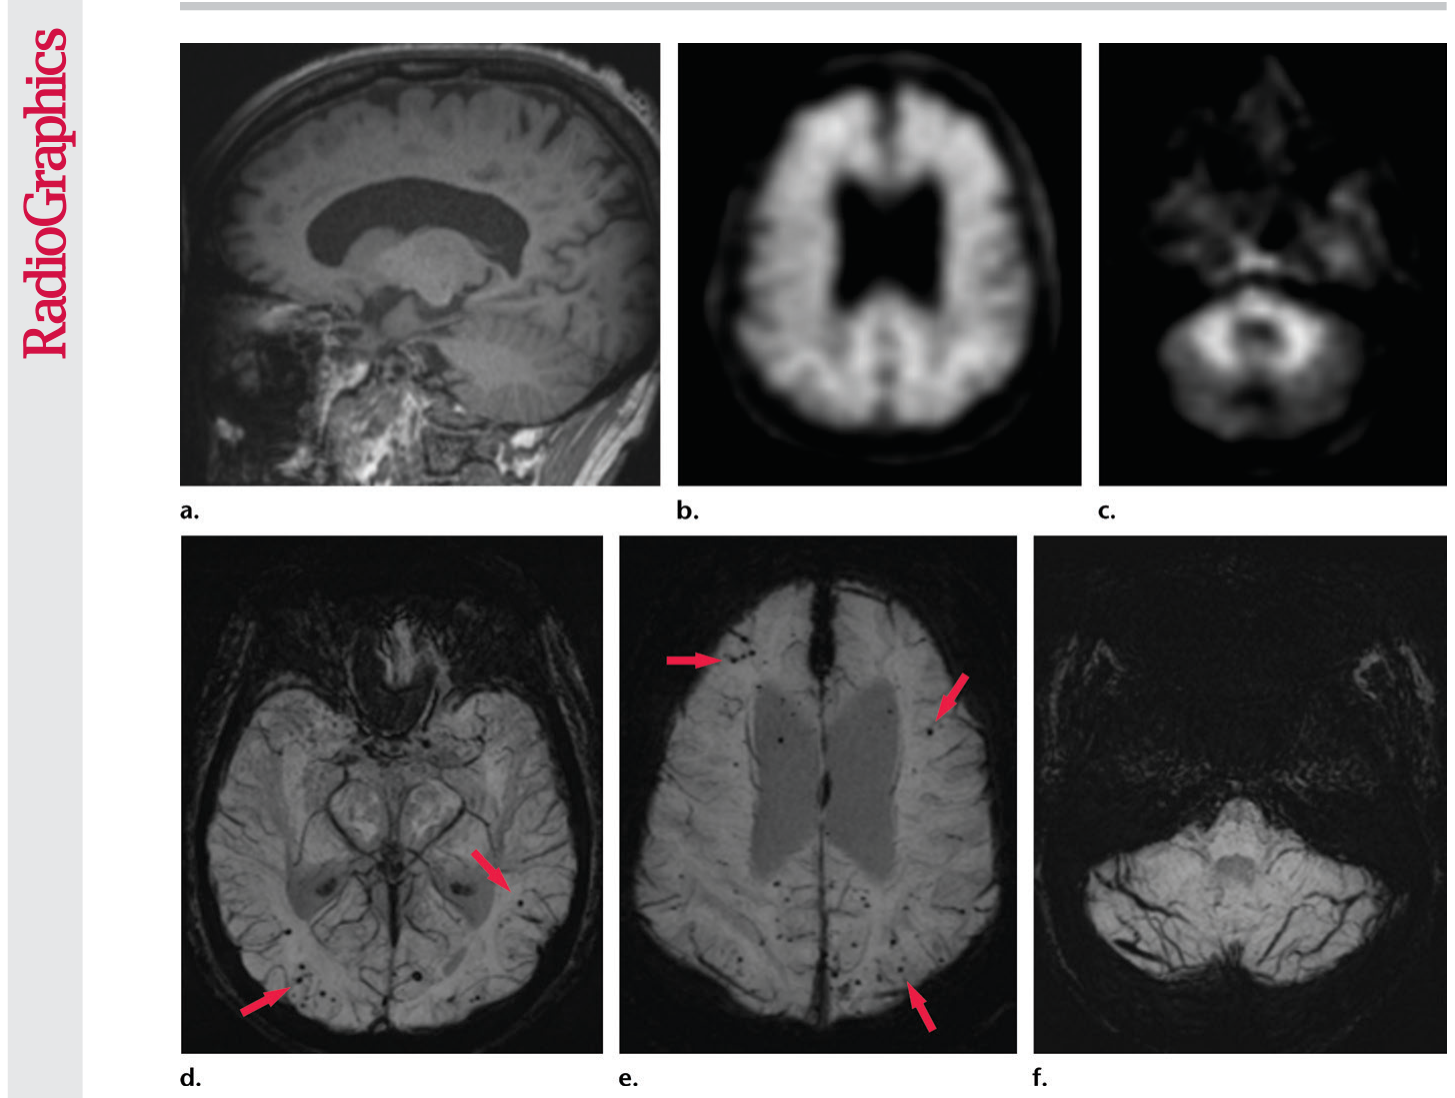
Figure 16. Figure 16. Patient with memory loss. (a) Sagittal T1-weighted MR image in a patient with memory loss shows relatively preserved cortical volume. (b) Axial 18F-florbetaben image at the level of the lateral ventricles shows diffuse abnormal uptake, confirming amyloid deposition. (c) Axial image at the level of the cerebellum shows preserved gray-white differentiation. (d, e) Axial susceptibility-weighted minimum intensity projection images at the level of the atria (d) and body (e) of the lateral ventricles show multiple areas of round signal void (arrows) scattered throughout the periphery of the cortices, compatible with cerebral amyloid angiopathy. (f) Axial susceptibility-weighted minimum intensity projection image at the level of the cerebel- lum shows the lack of abnormal susceptibility in the cerebellum, compatible with the sparing noted at amyloid PET imaging. This case highlights the complementary role of structural and molecular imaging with findings compatible with Alzheimer disease and cerebral amyloid angiopathy.
Figure 18
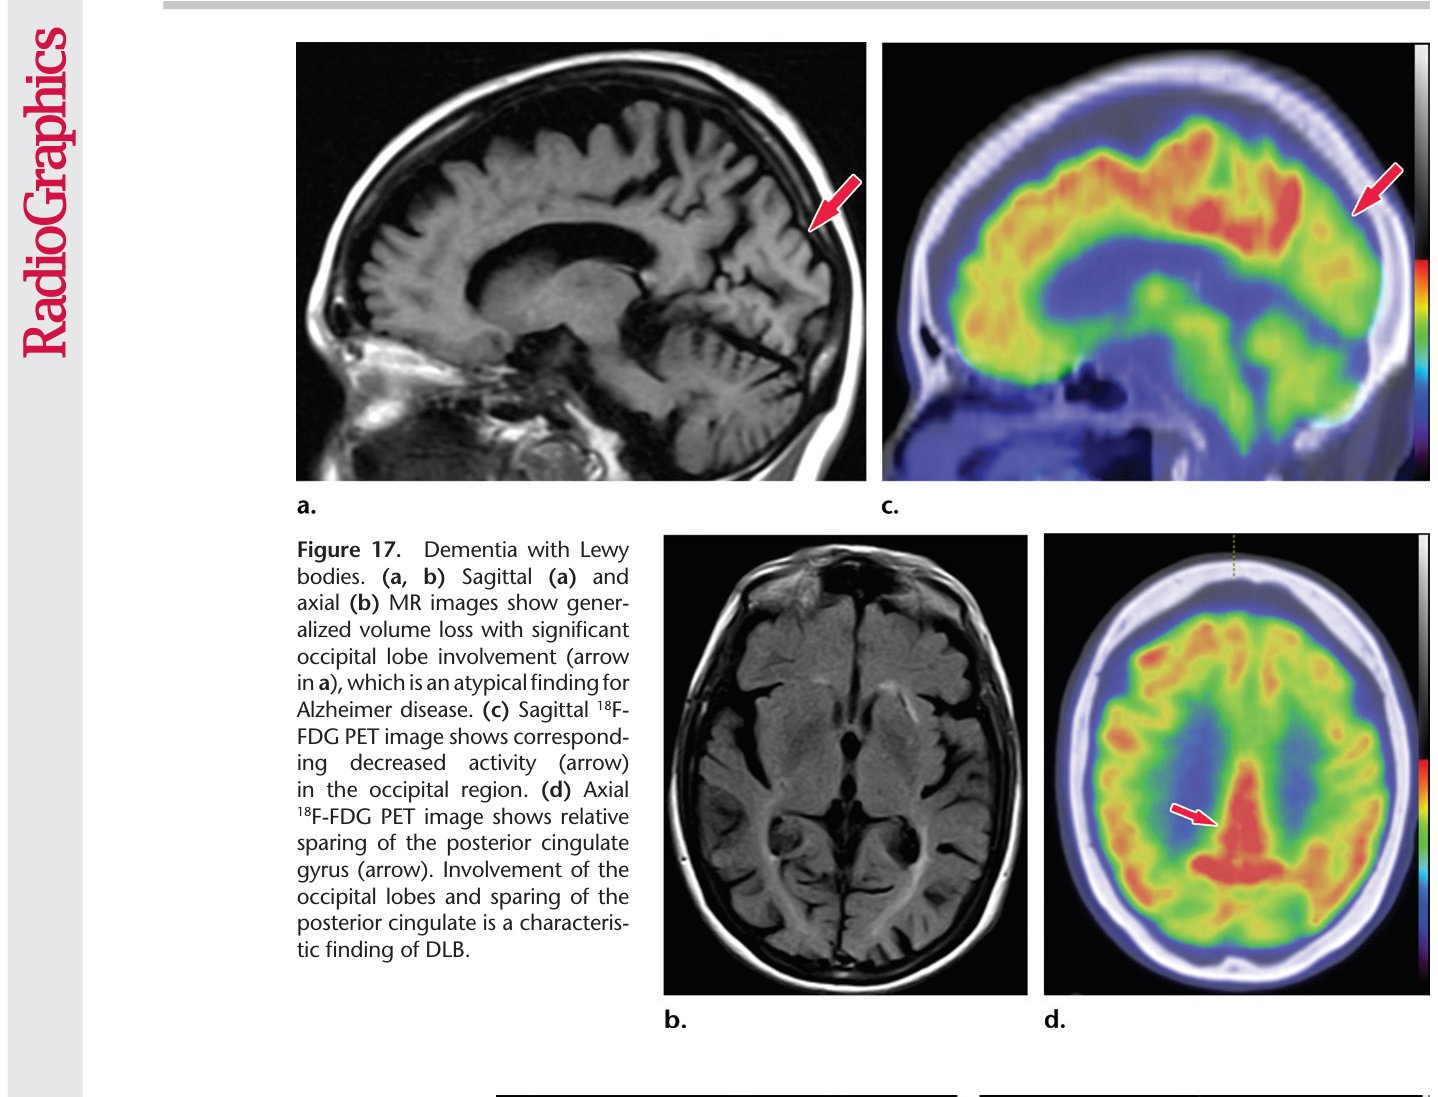
Figure 18. Figure 18. Dementia with Lewy bodies. (a) Axial 123I- ioflupane SPECT image in a patient with memory loss shows decreased left striatal uptake with a period appear- ance (red arrow), confirmatory of a parkinsonian neurode- generative disease. Note the normal right striatal uptake with a comma appearance (green arrow), representing preserved putaminal uptake. (b) Sagittal 18F-FDG PET im- age shows subtle decreased uptake within the occipital region (arrow). (c) Parasagit- tal computer-generated map shows a statistically significant decrease in FDG uptake in the precuneus and occipital lobe
Figure 19
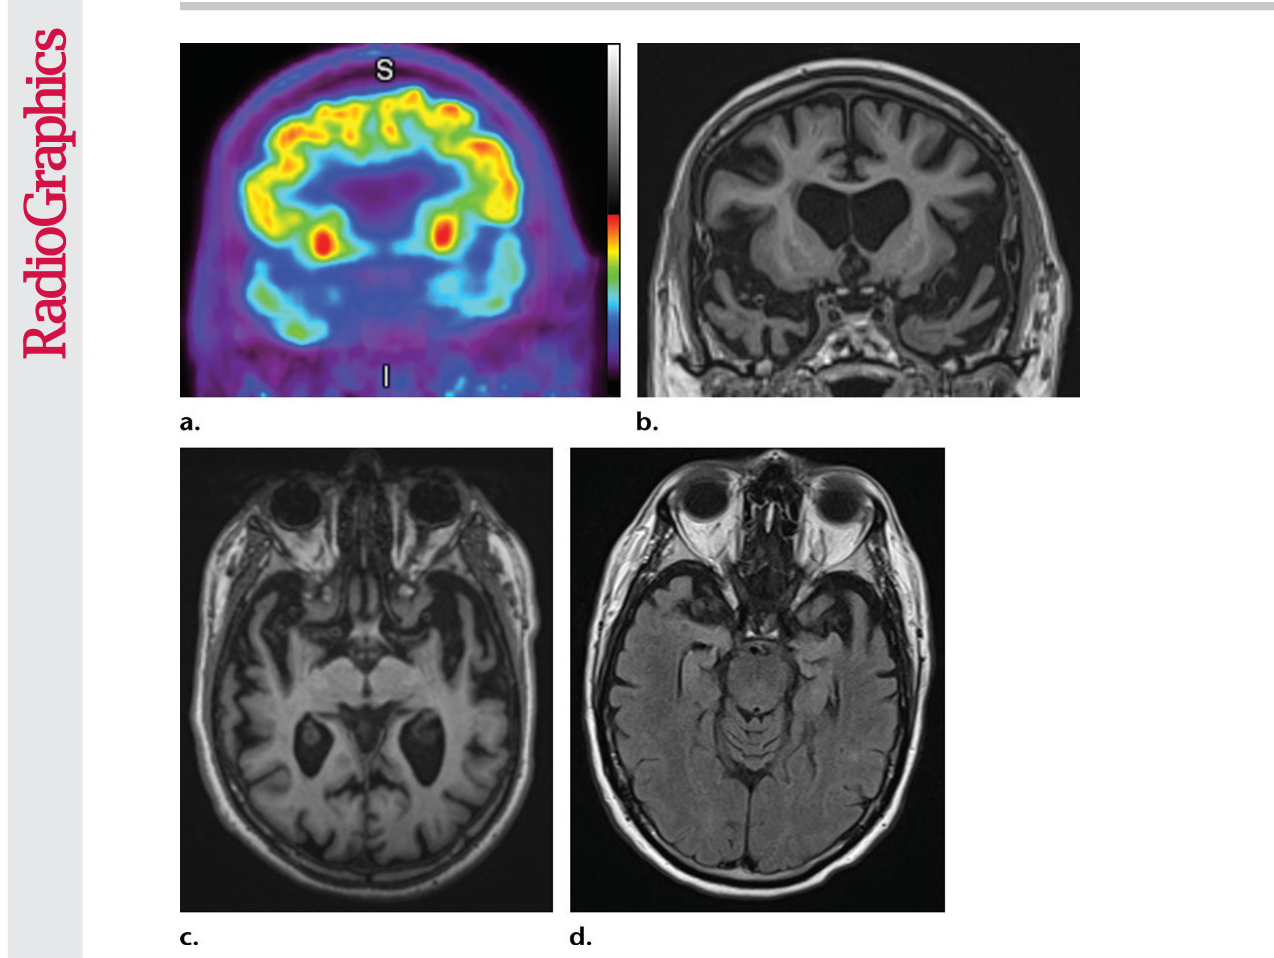
Figure 19. Figure 19. Frontotemporal lobar degeneration. (a) Coronal 18F-FDG PET image at the level of the anterior temporal lobes shows markedly decreased temporal lobe uptake. I = inferior, S = superior. (b, c) Coronal (b) and axial (c) T1-weighted MR images show severe bilateral temporal lobe atrophy. (d) Axial MR image at the level of the temporal lobes obtained 5 years earlier demonstrates the significant progressive atrophy in this patient.
Figure 20
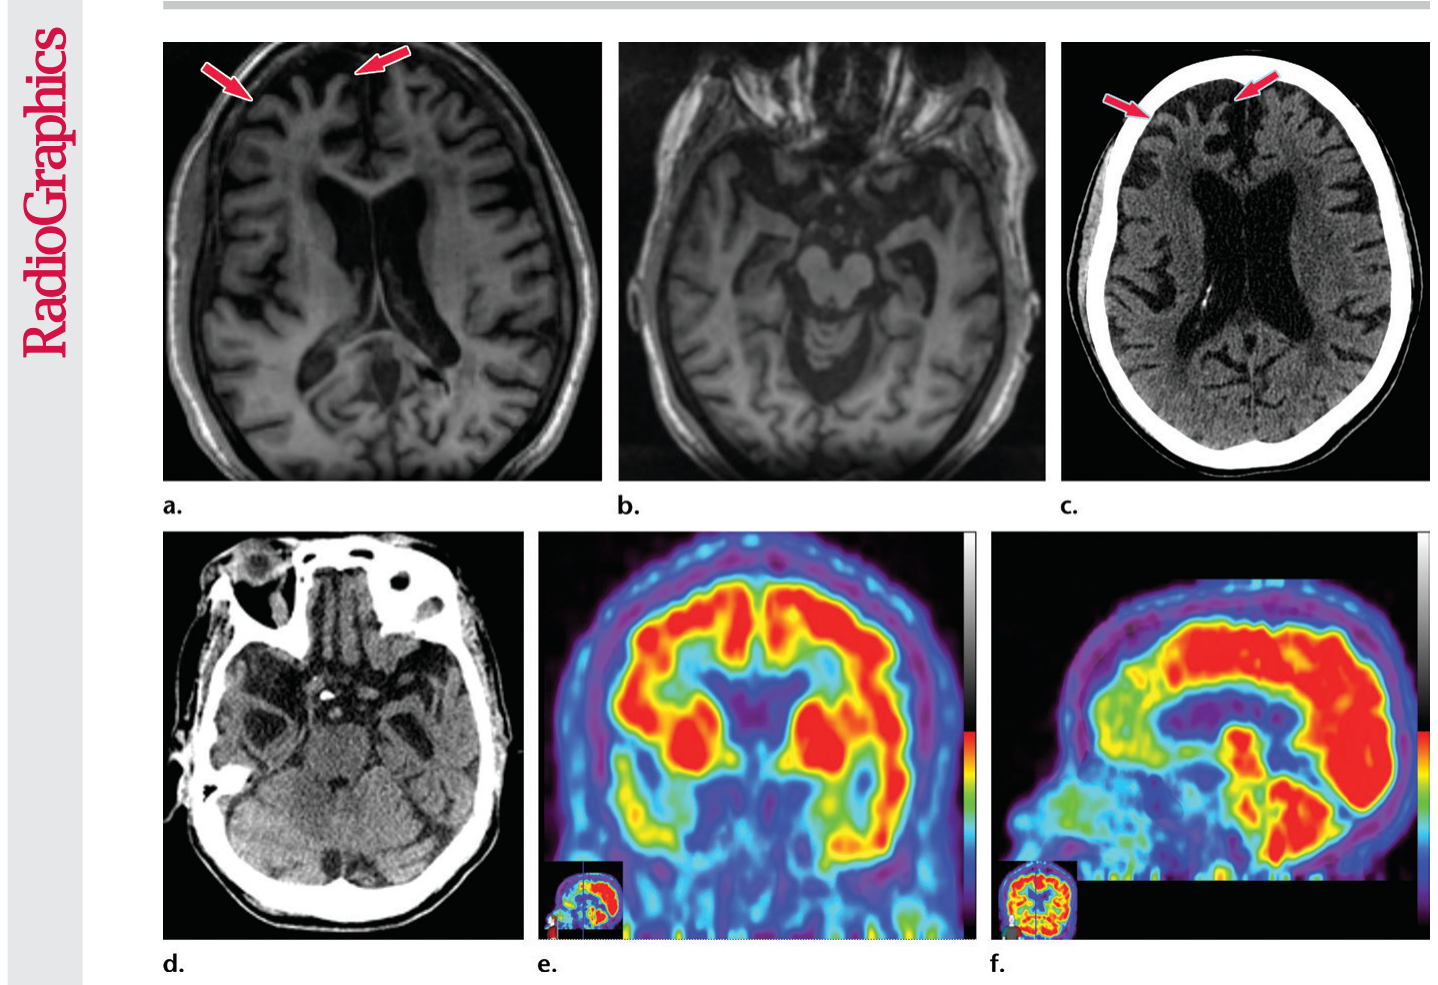
Figure 20. Figure 20. Frontotemporal lobar degeneration. (a, b) Axial T1-weighted MR images at the convexities (a) and temporal lobes (b) show moderate frontotemporal atrophy. Note the atrophy at the right frontal lobe (arrows in a). (c) Follow-up axial CT image at the lateral ventricles obtained 5 years later shows asymmetric worsening atrophy (arrows) on the right. (d) Axial CT image shows similar asymmetric worsening at the temporal lobes. (e, f) Coronal (e) and sagittal (f) 18F-FDG PET images obtained on the same day as the CT images show corresponding decreased activity in the frontal and temporal regions, findings compatible with FTLD. Image insets show a coronal section through the middle of the brain in this particular case to aid in lateralization.
Figure 21
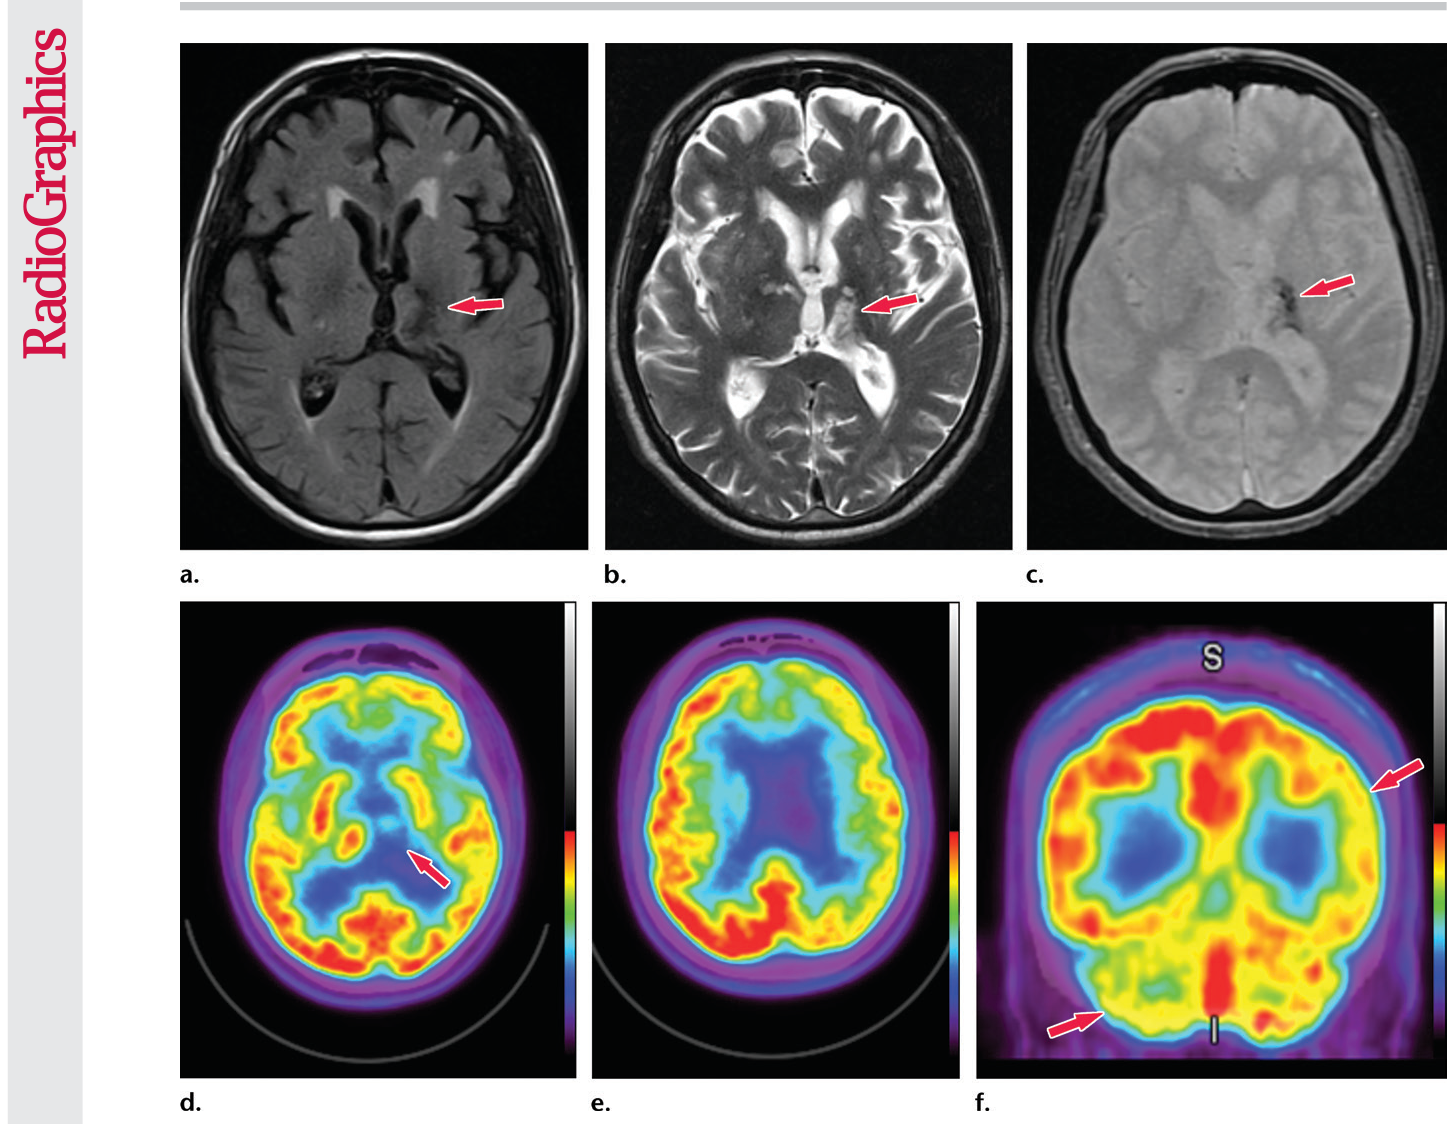
Figure 21. Figure 21. Patient with vascular dementia from a strategic left thalamic hemorrhagic infarct. (a–c) Axial T2-weighted fluid-attenuated inversion-recovery (FLAIR) (a), T2-weighted (b), and gradient-recalled-echo (c) MR images show encephalomalacia and hemosiderin staining in the left thalamus (arrow), compatible with a chronic hemorrhagic infarct. (d, e) Axial 18F-FDG PET images at the level of the thalami (d) and lateral ventricles (e) show nearly absent activity in the left thalamus (arrow in d) and decreased activity in the left cere- bral hemisphere, respectively, when compared with the normal activity depicted in the right thalamus and right cerebral hemisphere. Corroborative findings are compatible with thalamic infarct and vascular dementia. (f) Coronal 18F-FDG PET image shows decreased activity (arrows) in the left cerebral hemisphere and right cerebellar hemisphere, compatible with crossed cerebellar diaschisis. This is secondary to wallerian degeneration of the white matter tracts, which decussate contralaterally. I = inferior, S = superior.
Figure 22
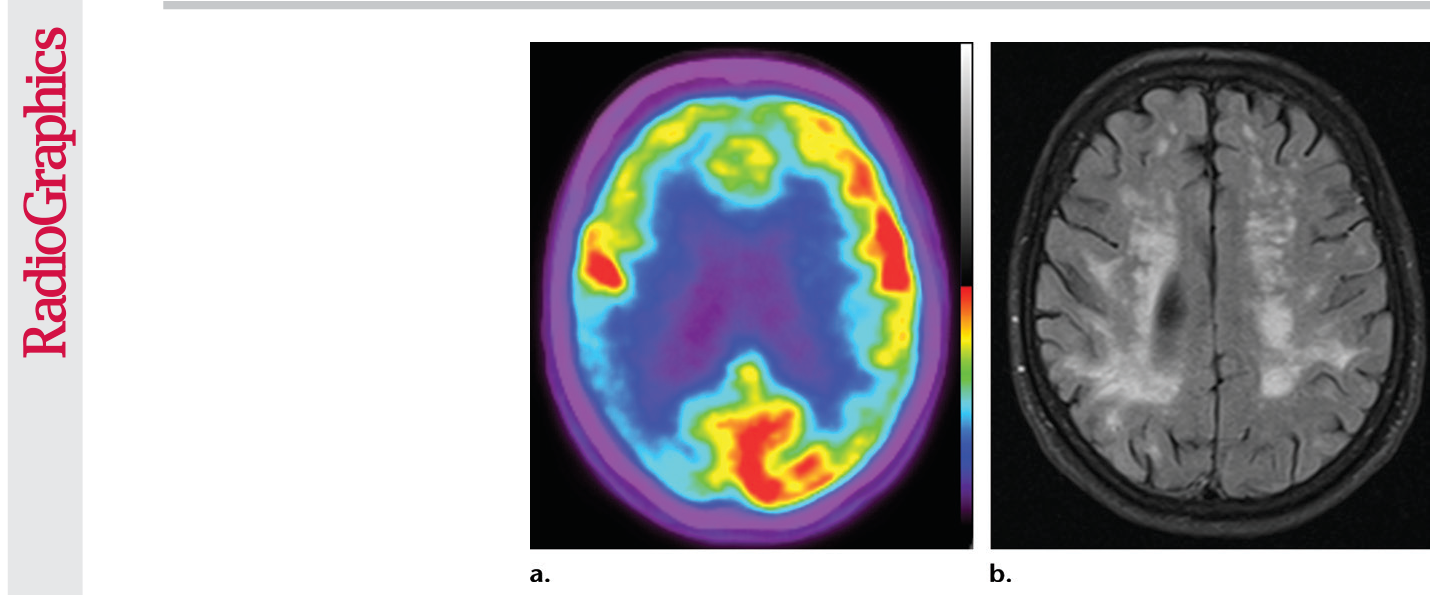
Figure 22. Figure 22. Patient with vascular dementia. (a) Axial 18F-FDG PET image shows decreased activity in the bilateral frontal and parietal regions, with the right side being worse than the left. In the proper clinical setting, these findings are suggestive of Alzheimer disease de- mentia. (b) Corresponding axial MR image shows confluent T2-weighted fluid-attenuated inversion-recovery (FLAIR) white matter areas of hyperintensity extending to the subcorti- cal regions, reflecting extensive ischemic damage without cortical volume loss. Findings at structural and functional imaging are representative of subcortical arteriosclerotic encepha- lopathy or Binswanger disease.
Figure 23
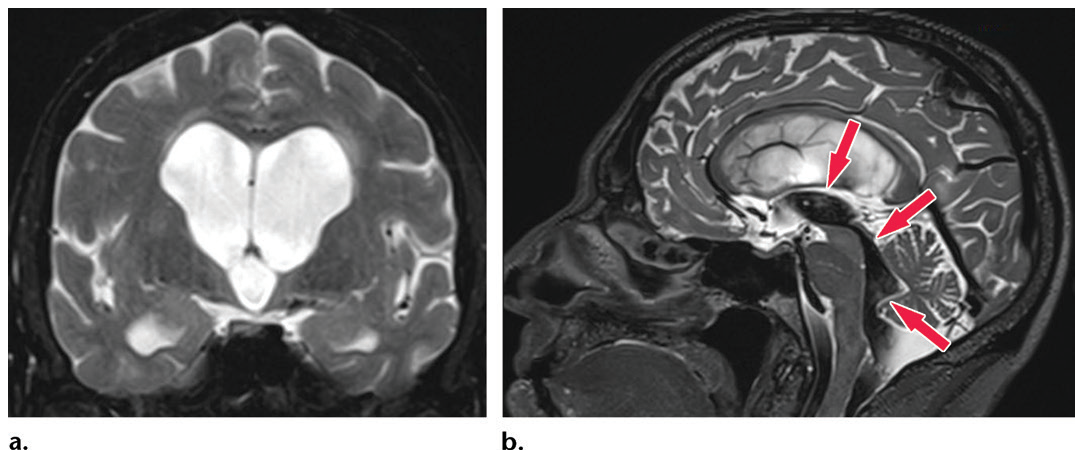
Figure 23. Figure 23. Patient with normal pressure hydrocephalus with insidious onset of dementia, gait disturbance, and urinary incontinence. Coronal T2-weighted (a) and sagittal T2-weighted three-dimensional–volumetric high-spa- tial-resolution (b) MR images show ventriculosulcal disproportion, which is suggestive of normal pressure hydro- cephalus. Three-dimensional–volumetric high-spatial-resolution images also show a large cerebrospinal fluid flow void (arrows) at the level of the third ventricle, cerebral aqueduct, and fourth ventricle, suggesting increased veloci- ties and excluding obstruction, which helps confirm normal pressure hydrocephalus.
Figure 24
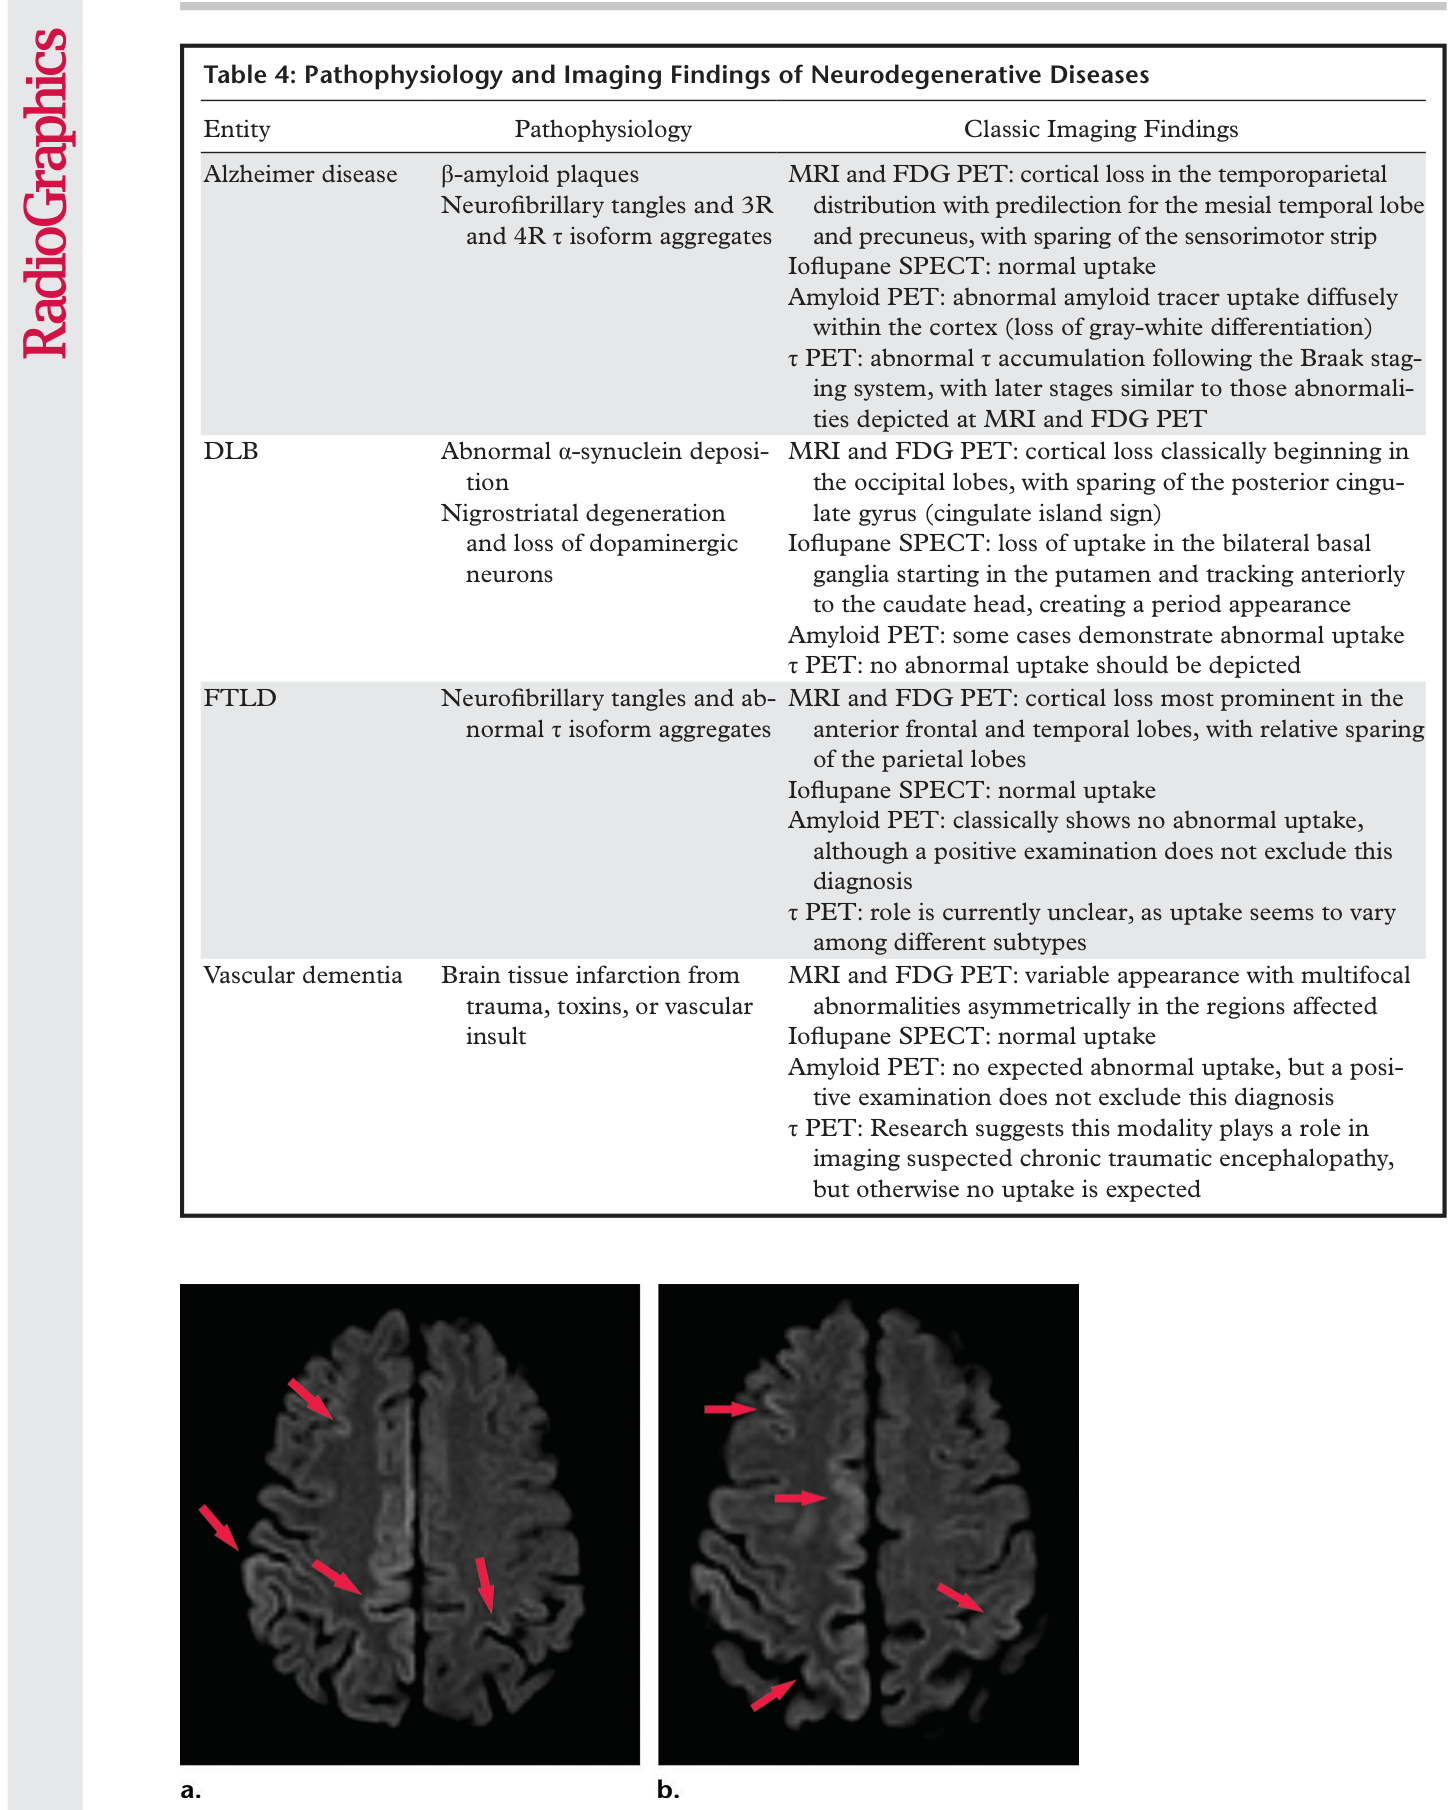
Figure 24. Figure 24. Creutzfeldt–Jakob disease. Axial diffusion-weighted MR images in a patient with rapidly progressive dementia show gyriform areas of hyperintensity of the cortical ribbon sign (arrows), a finding suspicious for Creutzfeldt–Jakob disease. The diagnosis was confirmed on the basis of clinical and imaging findings and elevated cerebrospinal fluid 14-3-3 protein levels.
Figure 25
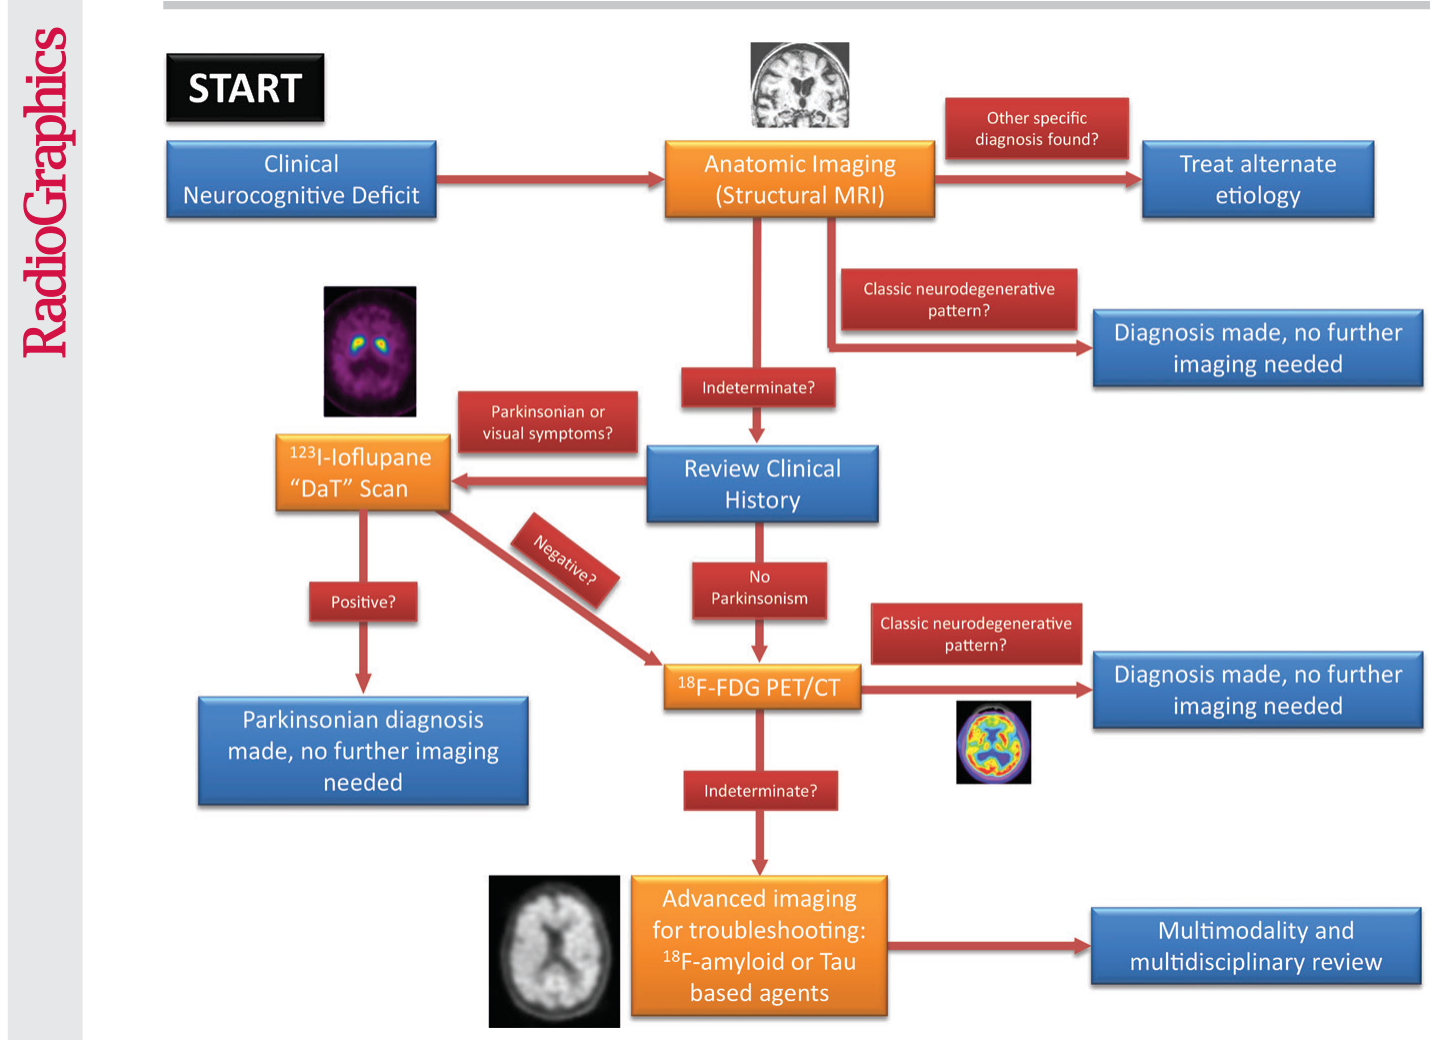
Figure 25. Figure 25. Flowchart shows the diagnostic strategy for the workup of patients with suspected dementia. In patients with clinical neurocognitive impairment, the first step in imaging should be performing structural MRI. This allows identification of alternate treat- able causes before performing additional workup. If a diagnosis is not clear, a clinical history review should be performed to identify any parkinsonian symptoms. If these symptoms are present, a 123I-ioflupane SPECT image should be obtained. If this is negative or if parkinsonian symptoms are absent, FDG PET should be performed. In many cases, the combination of MRI, FDG PET, and clinical his- tory review findings are sufficient to suggest a diagnosis. Additional workup should be used for troubleshooting. Amyloid or τ imaging (if available) should be considered to identify patterns that would suggest an Alzheimer disease diagnosis. If the distribution on FDG images suggests DLB, an examination with ioflupane can be considered. DaT = dopamine transporter.



コメントを残す