どうも、Beyond the Pixelです。胎児の先天性心疾患(CHDs)は、世界中で1000人に8〜9人の出生に見られる構造的な心臓の奇形であり、その早期発見は非常に重要です。胎児心エコー検査は、リアルタイムの超音波(US)画像を用いて胎児の心臓を評価する非侵襲的な手法ですが、その構造が複雑で、微細な異常を特定することが難しいため、検出には専門的なスキルが求められます。特に「3血管ビュー(3VV)」と呼ばれる特定の超音波画像は、肺動脈(PA)、大動脈(Ao)、上大静脈(SVC)という主要な血管の数、サイズ、位置、走行を評価するために不可欠です。多くのCHDsは、この3VVを含まない標準的な4心腔ビューのみでは見過ごされる可能性があります。例えば、ファロー四徴症や大血管転位症といった主要なCHDsも、大動脈のビューを含まなければ見逃されることがあります。本研究では、この3VV超音波動画から血管をセグメント化(個々の解剖学的構造をピクセル単位で識別し、分離する画像解析技術)し、そのサイズや空間的関係性に基づいて胎児の心臓が正常か異常かを検出する、ディープラーニング(多層のニューラルネットワークを用いてデータから特徴を自動で学習する機械学習の一種)を用いた革新的なアプローチが提案されました。これは、特に専門家が不足している低資源環境において、胎児の心疾患診断を支援する大きな可能性を秘めています。
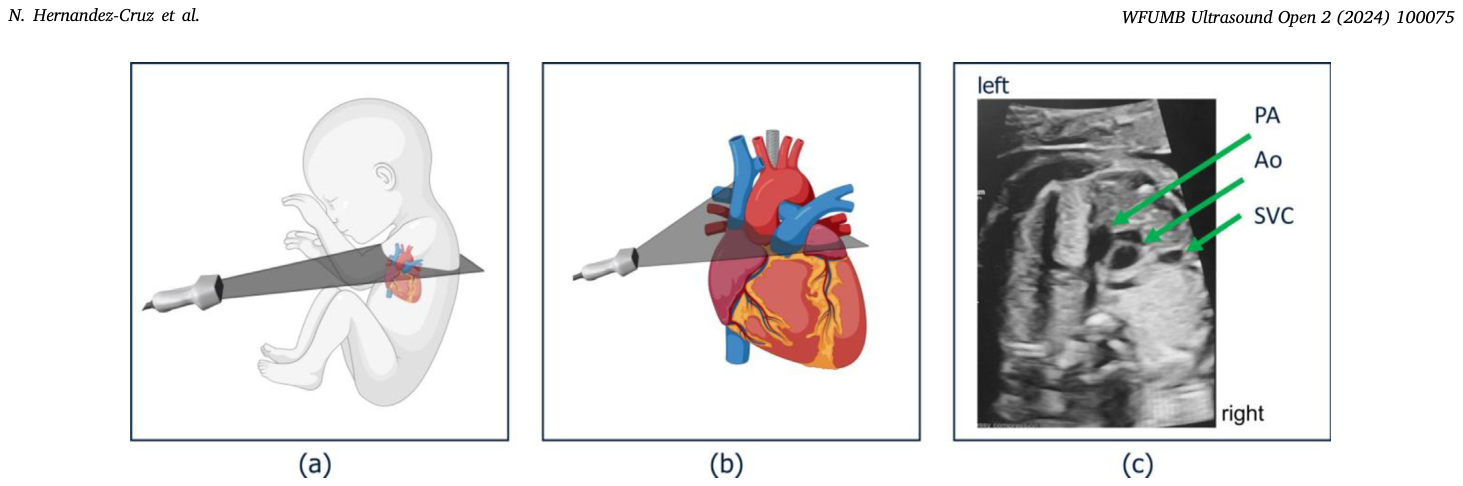
Figure 1. Fig. 1. The 3VV is obtained by moving the transducer in the axial scanning plane across the fetal chest from the 4CH towards the fetal head (cephalic direction). (a) Position of the transducer directed over the fetus. (b) Position of the transducer directed over the fetal heart. (c) 3VV of a normal fetal heart showing the great vessels (pulmonary artery, PA; aorta Ao) and superior vena cava (SVC).解説: この図は、胎児の胸部を軸走査平面でトランスデューサー(超音波プローブ)を動かし、4心腔ビューから胎児の頭部方向へ移動させることで3血管ビュー(3VV)が得られる様子を示しています。(a) 胎児の上に向けられたトランスデューサーの位置。(b) 胎児の心臓の上に向けられたトランスデューサーの位置。(c) 正常な胎児の心臓の3VVを示しており、主要な血管(肺動脈PA、大動脈Ao、上大静脈SVC)が見える。
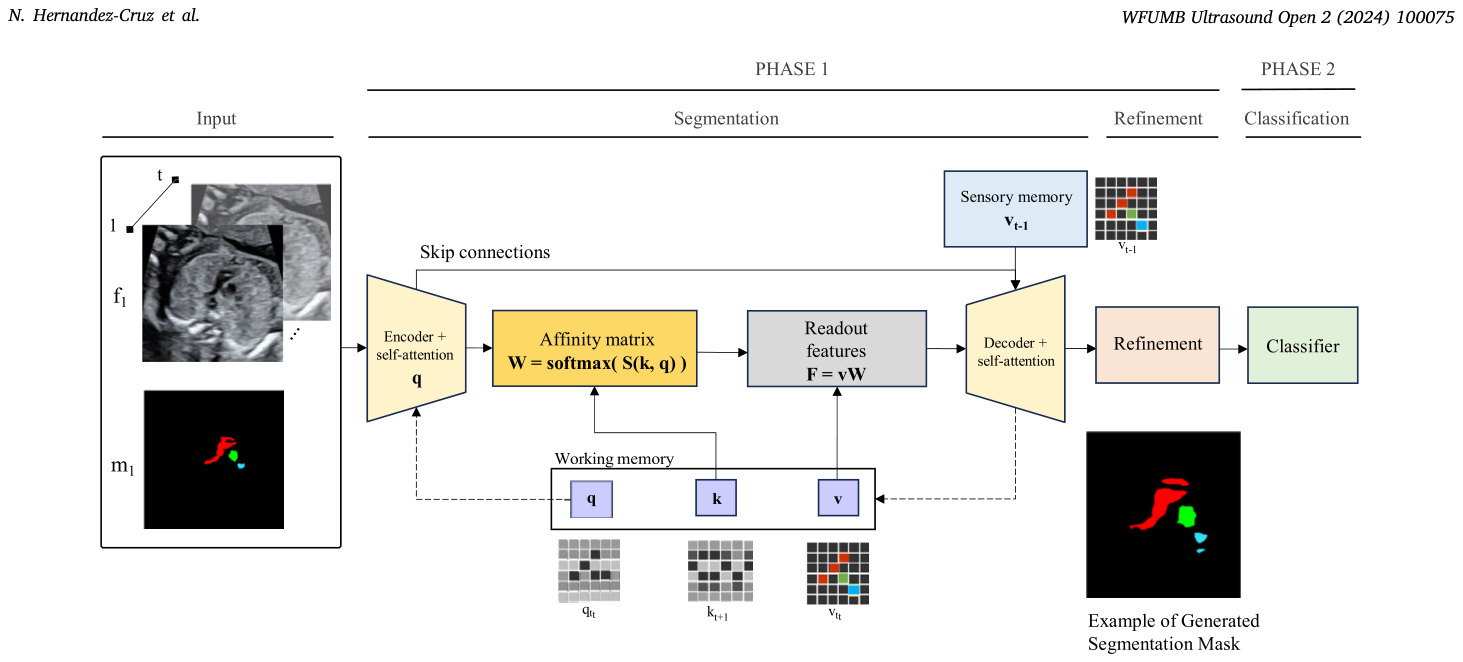
Figure 2. Fig. 2. The method architecture consists of two phases. The first phase extracts 𝑞and 𝑘, corresponding to the fetal heart anatomy embeddings in the anchor frame. 𝑊and 𝑆 are then calculated based on the pairwise similarity between 𝑞and 𝑘followed by a SoftMax operation. Readout features are obtained by mapping 𝑣incorporating information from both the image and the segmentation to 𝑊; embeddings are then passed to a decoder to generate a segmentation, followed by their refinement. The second phase uses a CoordConv network to detect abnormal US videos.解説: この図は、提案手法のアーキテクチャが2つのフェーズで構成されていることを示しています。第1フェーズは、アンカーフレームにおける胎児心臓の解剖学的構造の埋め込み(qとk)を抽出します。その後、qとkのペアワイズ類似性に基づいてWとSが計算され、ソフトマックス演算が行われます。画像とセグメンテーションの両方の情報を取り込んだvをWにマッピングすることでリードアウト特徴が取得され、埋め込みはデコーダーに渡されてセグメンテーションを生成し、その後リファインメント(精緻化)されます。第2フェーズでは、CoordConvネットワークを使用して異常な超音波動画を検出します。
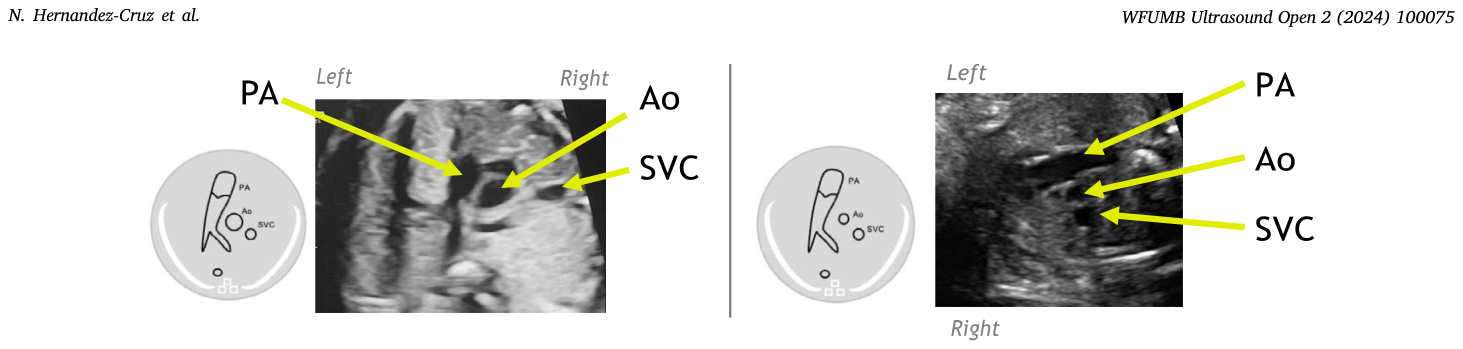
Figure 3. Fig. 3. Schematics and US images showing normal and abnormal 3VV examples. On the left, the schematic and image show a normal heart consisting of three vessels, normal proportion in size (PA ≥Ao and Ao > SVC), and alignment (the PA on the left side of the fetal chest followed by Ao and then SVC on the right side of the fetal chest). On the right, the schematic and image show an abnormal heart (diagnosed with coarctation of the aorta), which is different by having a disproportion of the great vessels (Ao < PA).解説: この図は、正常および異常な3血管ビュー(3VV)の例を示す模式図と超音波画像です。左側は、3つの血管、正常なサイズ比(PA≧AoかつAo>SVC)、および整列(胎児の胸部の左側にPA、次にAo、そして右側にSVC)を示す正常な心臓の模式図と画像です。右側は、大血管(AoとPA)に不均衡があることにより異なる異常な心臓(大動脈縮窄症と診断されたもの)の模式図と画像です。
研究データと評価方法
本研究では、Clinical Artificial Intelligence Models in Fetal Echocardiography (CAIFE) 研究からのデータを使用しました。対象者は妊娠18歳以上の妊娠中期(妊娠13〜27週、平均20週)の妊婦です。倫理承認はEast Midlands – Leicester Central Research Ethics Committeeより取得されました。データは、経験豊富な胎児心臓専門家によって、様々な超音波診断装置(General Electric Voluson、Fujifilm ARIETTA 850、Samsung HERA-W10、Sonoscape P60、Canon TUS-AI800など)を用いて取得されました。超音波動画は、DICOMフォーマットからフレームレベルで抽出され、TIFF形式に変換後、グレー画像を匿名化してMP4動画に変換されました。動画の長さは約1.5秒(60フレーム)です。本研究で使用されたデータセットは、3血管ビュー(3VV)の超音波動画150本で構成され、訓練用に50本、テスト用に100本(正常50本、異常50本)が用いられました。異常症例には、左心低形成症候群(20本)、左大動脈弓を伴うファロー四徴症(10本)、心室中隔欠損を伴う完全大血管転位症(10本)、大動脈縮窄症(10本)が含まれています。
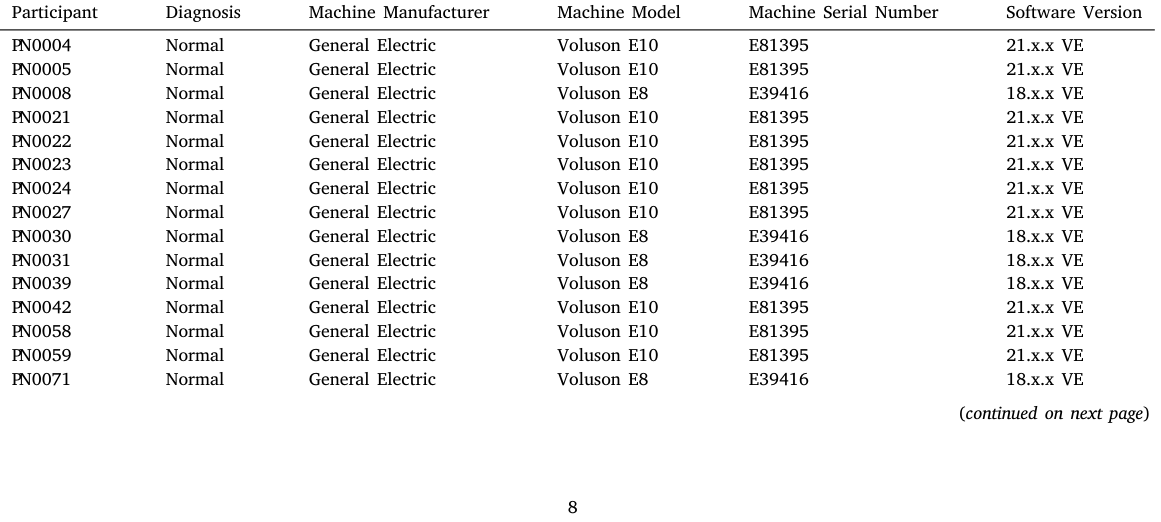
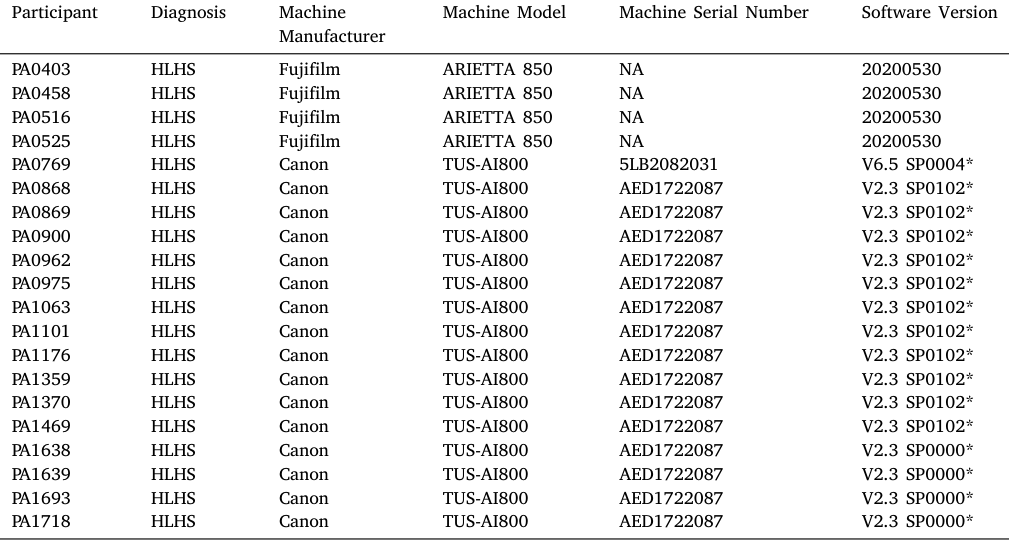
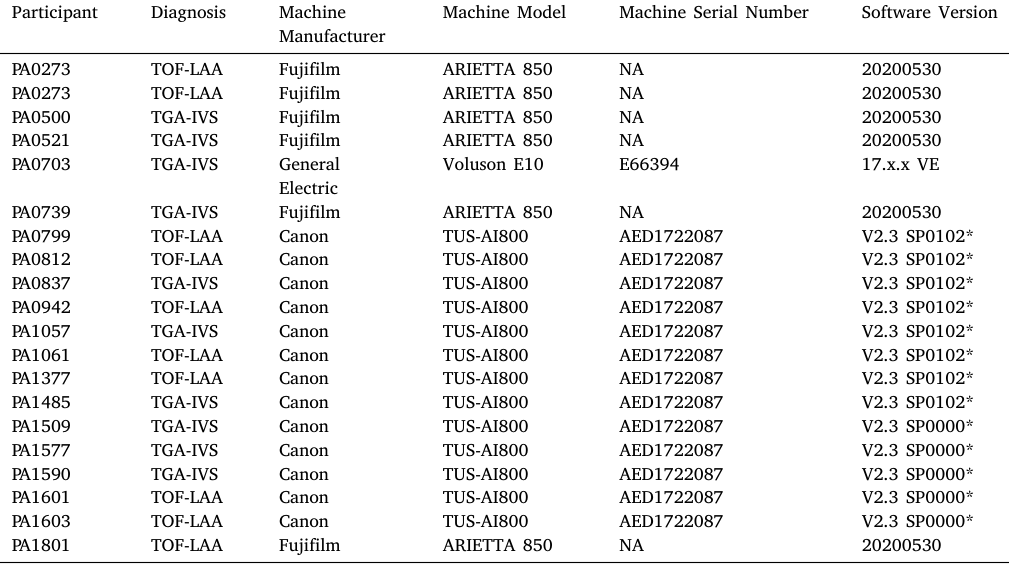
Table 5. Table 5 This table outlines participants and the ultrasound system used for scanning, corresponding to normal US video diagnoses.解説: この表は、正常な超音波動画診断に対応する参加者とスキャンに使用された超音波システムをまとめたものです。参加者ID、診断結果、超音波機器メーカー、モデル、シリアル番号、ソフトウェアバージョンが含まれています。Table 6. Table 6 This table outlines participants and the ultrasound system used for scanning, corresponding to hypoplastic left heart syndrome (HLHS) US video diagnoses.解説: この表は、左心低形成症候群(HLHS)の超音波動画診断に対応する参加者とスキャンに使用された超音波システムをまとめたものです。参加者ID、診断結果、超音波機器メーカー、モデル、シリアル番号、ソフトウェアバージョンが含まれています。Table 7. Table 7 This table outlines participants and the ultrasound system used for scanning, corresponding to tetralogy of Fallot with left aortic arch (TOF-LAA) and complete transposition of the great arteries with the intact interventricular septum (TOF-IVS).解説: この表は、左大動脈弓を伴うファロー四徴症(TOF-LAA)および心室中隔欠損を伴う完全大血管転位症(TOF-IVS)の診断に対応する参加者とスキャンに使用された超音波システムをまとめたものです。参加者ID、診断結果、超音波機器メーカー、モデル、シリアル番号、ソフトウェアバージョンが含まれています。
セグメンテーションの性能評価には、IoU(Intersection over Union:画像セグメンテーションの精度を測る指標で、予測された領域と実際の領域の重なり具合を示す)とDSC(Dice Similarity Coefficient:IoUと同様にセグメンテーション精度を測る指標で、予測と実際の領域の一致度を示す)が用いられました。超音波動画の分類性能は、感度(実際に異常がある超音波動画を、正しく異常と判定する割合)と特異度(実際に正常な超音波動画を、正しく正常と判定する割合)を用いて評価されました。
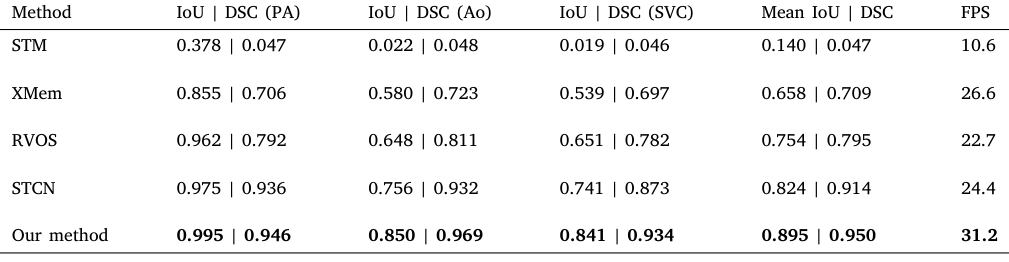
Table 1. Table 1 Comparison of four state-of-the-art methods for one-shot video segmentation and our method. Our method achieves the highest intersection over IoU and DSC.解説: この表は、ワンショット動画セグメンテーションに関する4つの最先端手法と提案手法の比較を示しています。提案手法は、IoU(Intersection over Union)とDSC(Dice Similarity Coefficient)の両方で最も高い結果を達成しています。各血管(PA、Ao、SVC)ごとのIoUとDSC、および平均IoUとDSC、そして1秒あたりのフレーム数(FPS)が示されています。
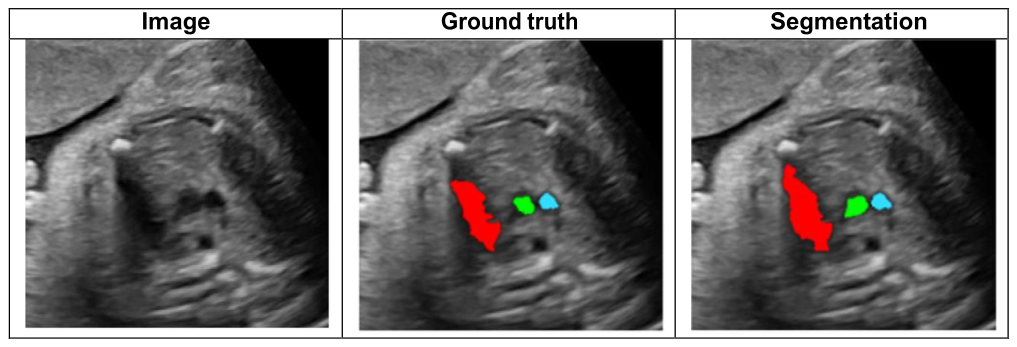
Figure 4. Fig. 4. Qualitative results for the segmentation of 3VV compared to the manually derived GT. These images have been manually overlapped (bottom) and 50% zoomed in to contrast differences for illustrative purposes. The red, green, and blue colour codes represent the PA, Ao, and SVC, respectively. (For interpretation of the references to colour in this figure legend, the reader is referred to the web version of this article.)解説: この図は、手動で作成されたグランドトゥルース(GT)と比較した3血管ビュー(3VV)のセグメンテーションの定性的な結果を示しています。これらの画像は、比較のために手動で重ね合わせ(下部)られ、50%拡大されています。赤、緑、青の色はそれぞれPA(肺動脈)、Ao(大動脈)、SVC(上大静脈)を表しています。画像は、GTと提案手法のセグメンテーション結果を比較しており、特に困難なケースにおける提案手法の精度を示しています。
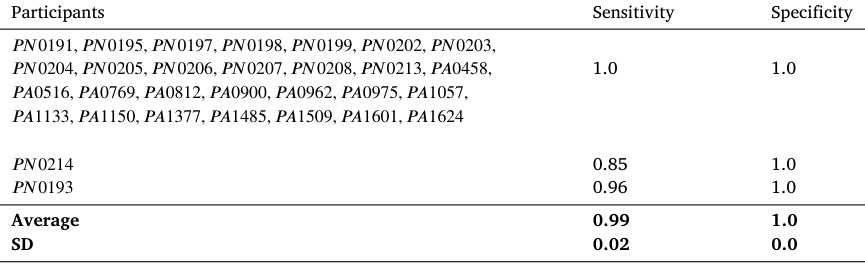
Table 2. Table 2 For brevity, we provide a breakdown sample of performance case-based for 30 of the subset of tested US videos. The first column shows the list of participants, followed by classification sensitivity and specificity. The result of the performance from the videos not listed is 1.0.解説: この表は、テストされた超音波動画の一部(30本)について、参加者ごとのパフォーマンスの内訳サンプルを示しています。最初の列に表示されていない動画のパフォーマンスは1.0です。参加者リスト、それに続く分類感度と特異度が示されています。
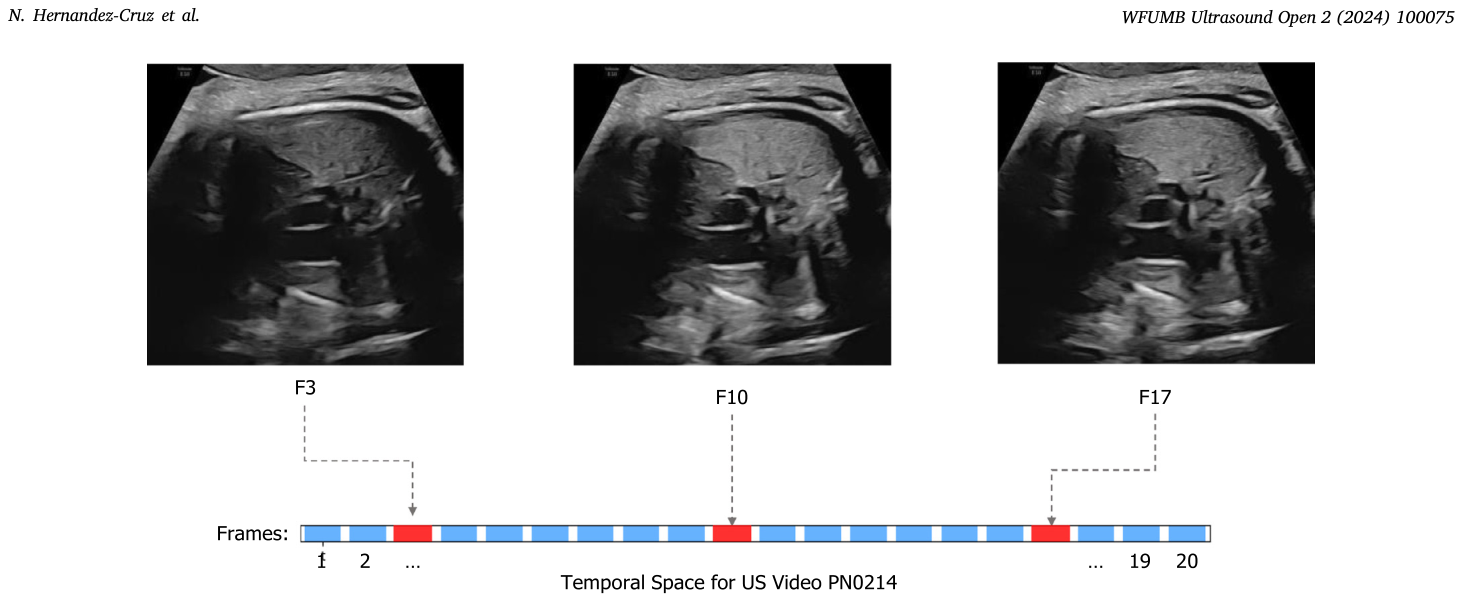
Figure 5. Fig. 5. Mislabelled frames in 𝑃𝑁0214 (normal heart). Correct frames are represented in blue, and mislabelled frames are in red. US of the mislabelled frames (𝐹3, 𝐹10, and 𝐹17) are shown above the timeline. (For interpretation of the references to colour in this figure legend, the reader is referred to the web version of this article.)解説: この図は、PN0214(正常な心臓)における誤ラベルフレームを示しています。正しいフレームは青、誤ラベルフレームは赤で表されています。誤ラベルフレーム(F3、F10、F17)の超音波画像はタイムラインの上に示されており、音響陰影が肋骨から発生したことが原因で正常な心臓が異常と誤ってラベル付けされた状況を表しています。
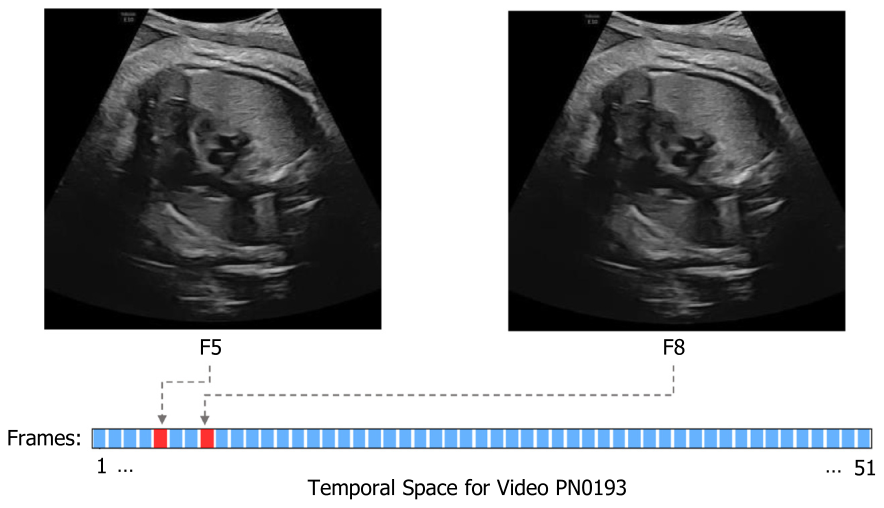
Figure 6. Fig. 6. Mislabelled frames in 𝑃𝑁0193 (normal heart). Correct frames are represented in blue, and mislabelled frames are in red. A sample of the mislabelled US frames (𝐹5 and 𝐹8) is shown above the timeline. (For interpretation of the references to colour in this figure legend, the reader is referred to the web version of this article.)解説: この図は、PN0193(正常な心臓)における誤ラベルフレームを示しています。正しいフレームは青、誤ラベルフレームは赤で表されています。誤ラベルされた超音波フレーム(F5およびF8)の例がタイムラインの上に示されており、胎児の動きにより大動脈(Ao)が肺動脈(PA)より小さく見え、正常な心臓が異常と誤ってラベル付けされた状況を表しています。
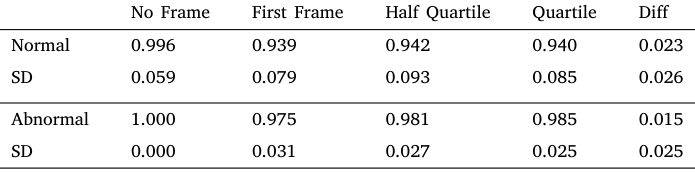
Table 3. Table 3 Sensitivity results for the introduction of mislabelled anchor frames at different positions, where ‘No Frames’ stands for no mislabelled frames; ‘First frame’ stands for mislabelling the first frame of the video; ‘Half Quartile’ stands for mislabelling the frame at position 12.5% of the video; ‘Quartile’ stands for mislabelling the frame at position 25% of the video.解説: この表は、誤ラベル付けされたアンカーフレームを異なる位置に導入した場合の感度結果を示しています。「フレームなし」は誤ラベルフレームなしを、「最初のフレーム」は動画の最初のフレームを誤ラベル付けした場合を、「ハーフクォータイル」は動画の12.5%の位置のフレームを誤ラベル付けした場合を、「クォータイル」は動画の25%の位置のフレームを誤ラベル付けした場合を示します。
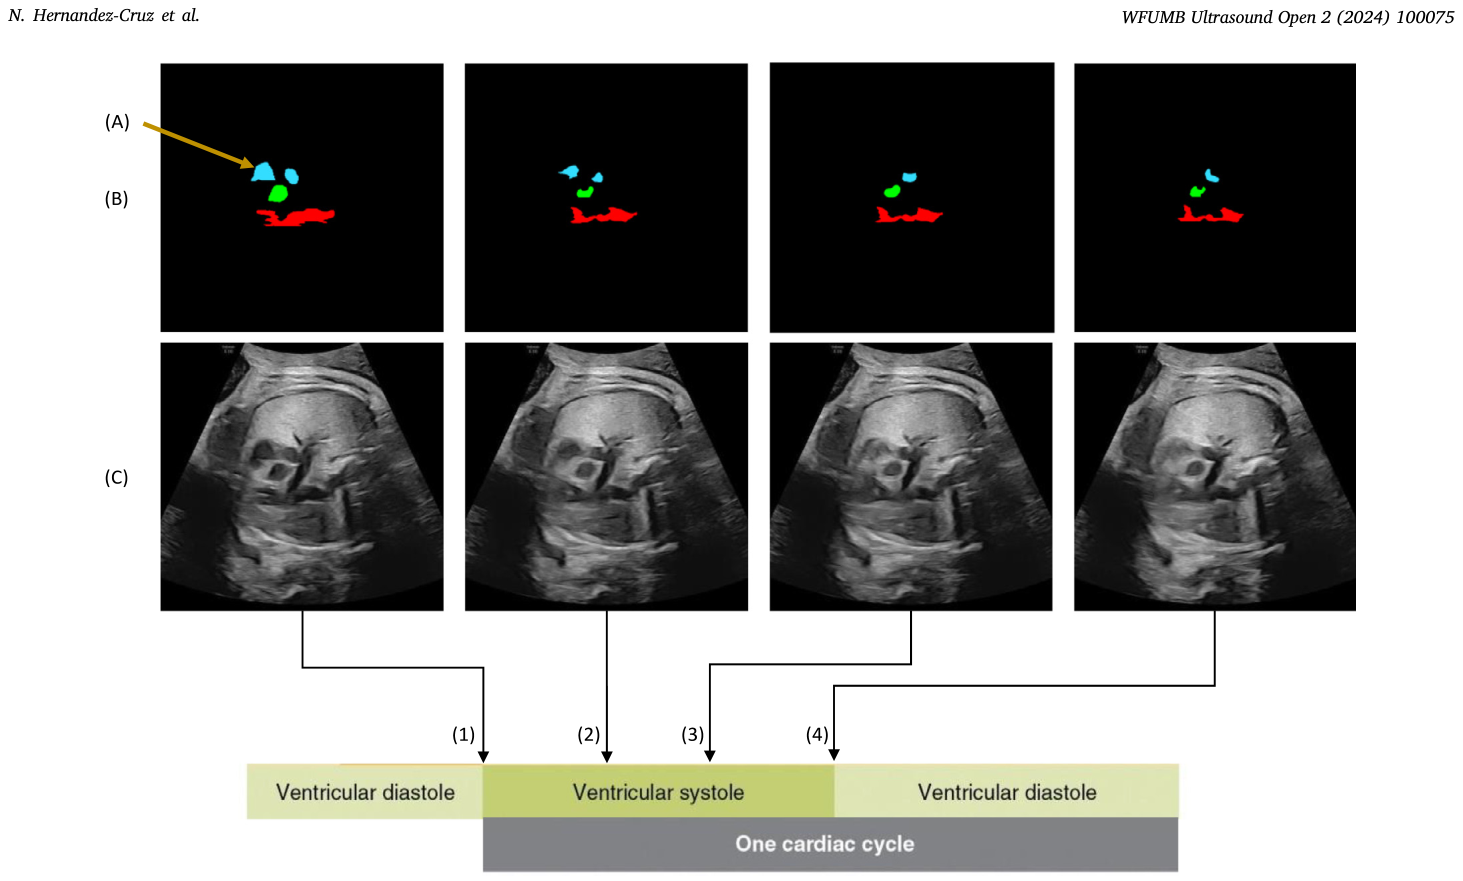
Figure 7. Fig. 7. Image (A) shows the morphological changes of a mislabelled heart vessel. Images in (B) show the segmentations generated by the method followed by their respective US image in (C). The leftmost column shows the smallest mislabelled vessel during the (1) end-diastolic phase of the cardiac cycle — when the heart’s ventricles are filled with blood just before they contract. (2, 3) Shows the changes along the transition to the systole phase of the cardiac cycle. The right-most images (4) show the mislabelled heart vessels are the biggest size at the end-systolic cardiac phase when the ventricles have contracted and ejected the blood.
Table 8
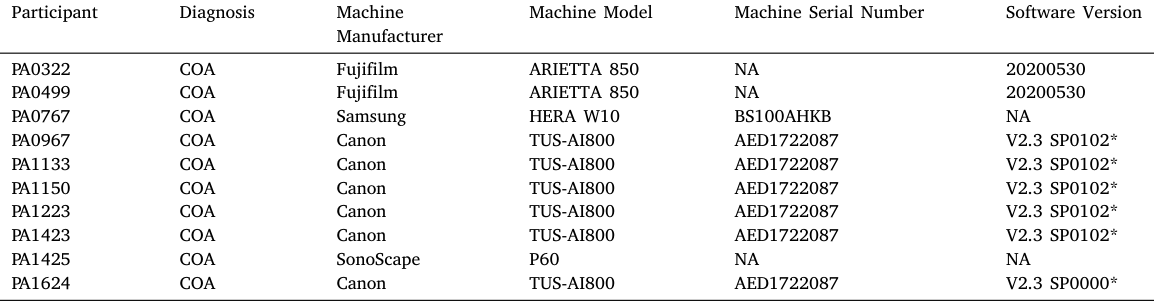
Table 8. Table 8 This table outlines participants and the ultrasound system used for scanning, corresponding to coarctation of the aorta (COA).
Table 9
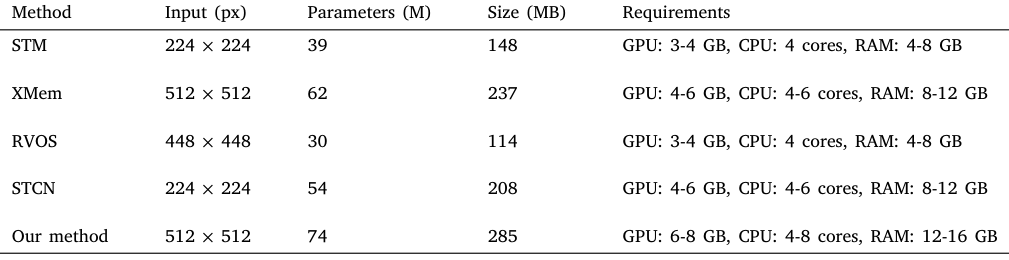
Table 9. Table 9 Technical specifications of CNN-based video processing methods. The first column lists the input size in pixels, the second column presents the number of parameters in millions, and the third column presents the size of the parameters in megabytes. The rightmost column estimates the minimum computational requirements needed for implementation.

コメントを残す