どうも、Beyond the Pixelです。緑膿菌(Pseudomonas aeruginosa)は、院内感染の主要な原因菌であり、特に免疫不全の対象者や集中治療を必要とする対象者、嚢胞性線維症の対象者において大きな課題となっています。多剤耐性化しやすく、死亡率も高いため、専門家にとってその診断は喫緊の課題です。現在の診断方法、例えば微生物培養や分子技術は、臨床サンプルに依存しており、感染部位の微生物環境を正確に反映できない場合があります。これにより、感染の不均一性(複数の病変や病気の進行・治療中の時間的変化など)を見落とすリスクがあり、診断が不完全になる可能性がありました。このような課題を解決するため、PETのような分子イメージング技術が注目されています。PETは放射性薬剤の取り込みを利用して、感染部位を局所化し、その進行をモニタリングすることを可能にします。しかし、緑膿菌に特異的な放射性トレーサー(放射性薬剤)が不足しているのが現状でした。
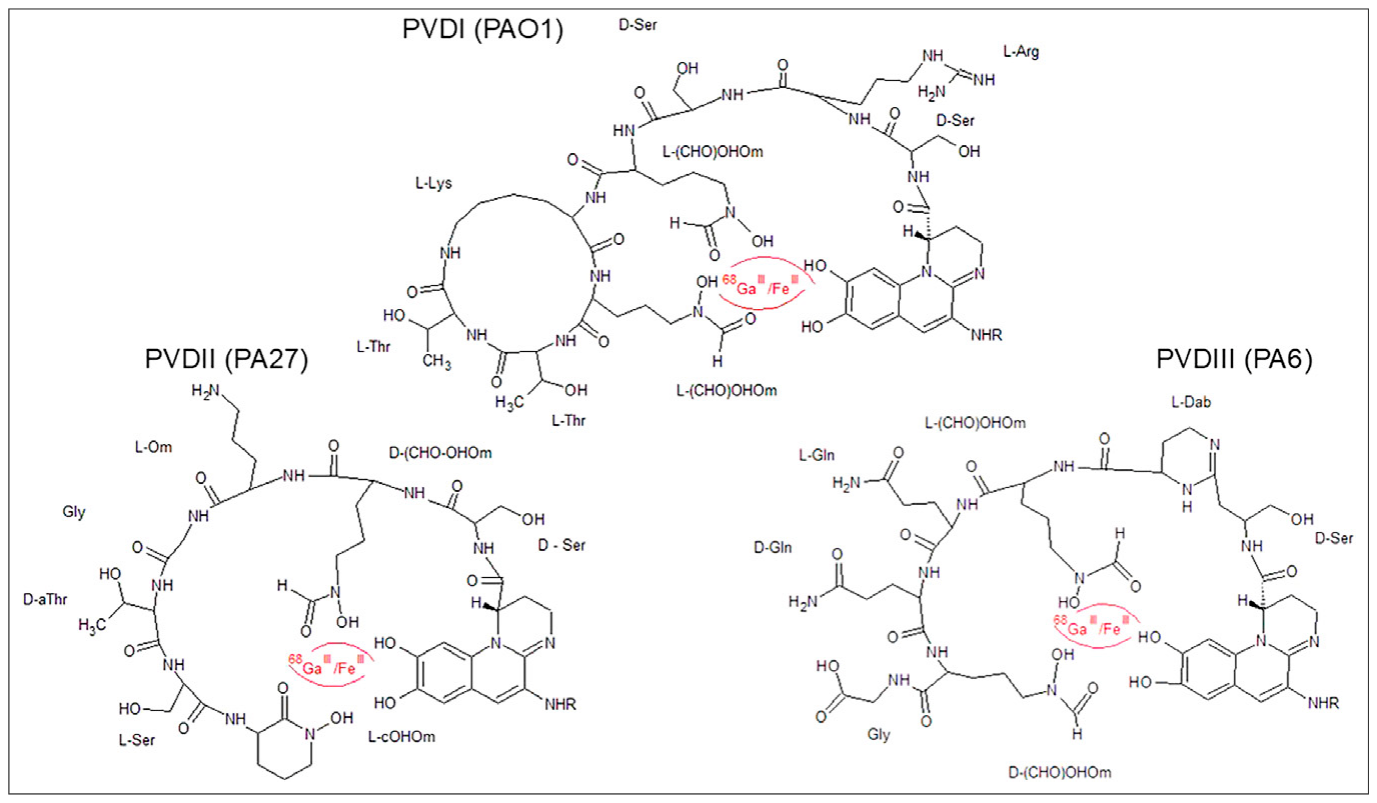
Figure 1. FIGURE 1. Chemical structures of 3 FeIII/68GaIII-pyoverdines, adapted from (12).解説: 本図は、緑膿菌によって生産される3種類のピオベルジン(PVDI、PVDII、PVDIII)の化学構造を示しています。それぞれの構造には、鉄(Fe<sup>III</sup>)または放射性同位体ガリウム68(<sup>68</sup>Ga<sup>III</sup>)が結合する部位が示されており、放射性標識の原理を視覚化しています。
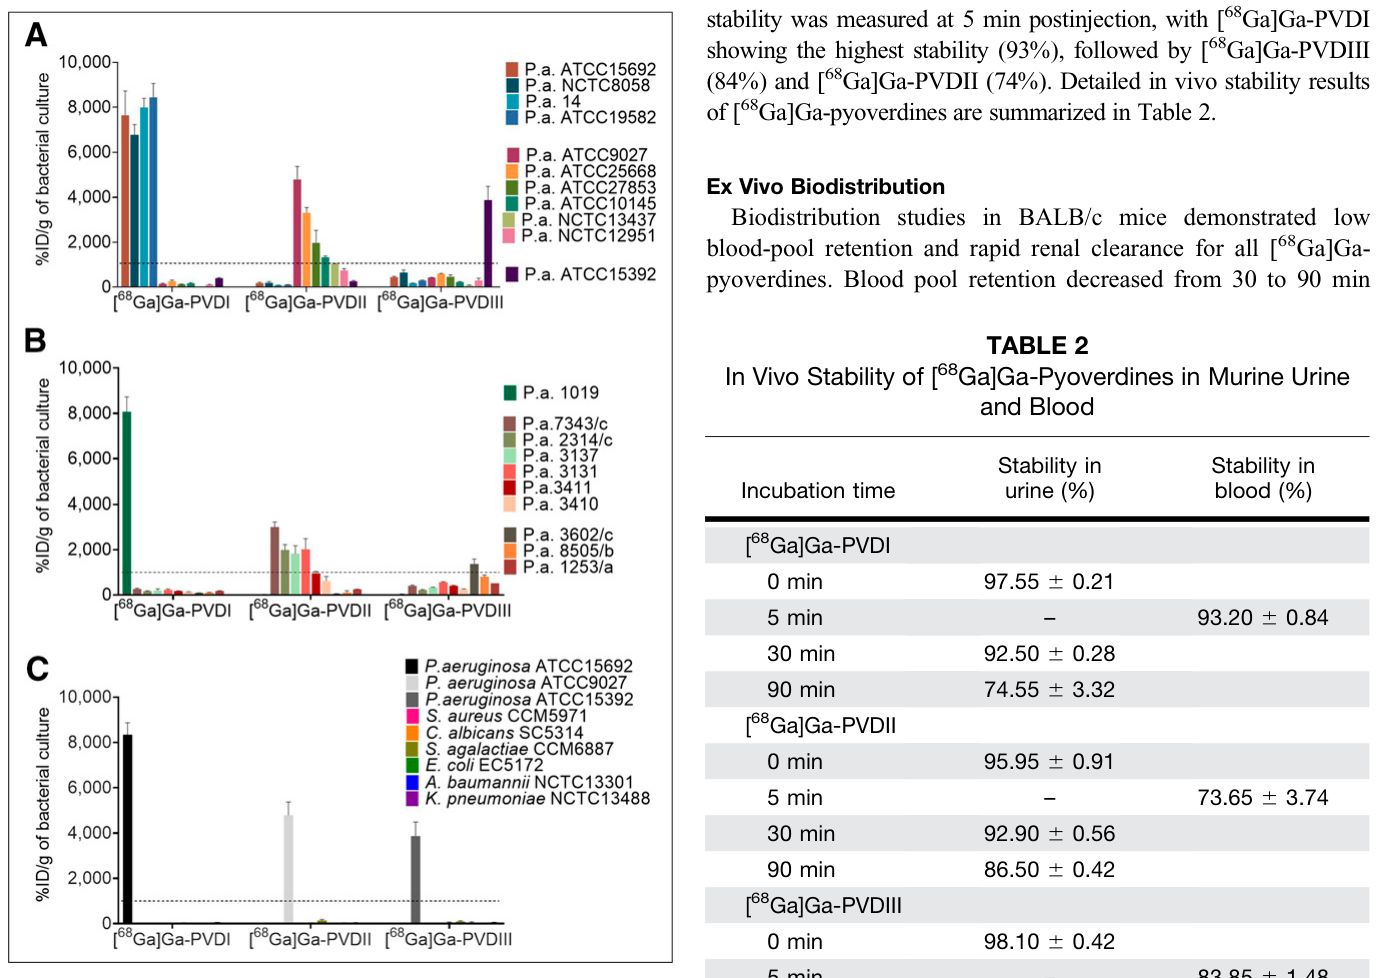
Figure 2. FIGURE 2. In vitro uptake of [68Ga]Ga-pyoverdines in different P. aerugi- nosa (P.a.) reference strains (A), patient isolates (B), and other selected pathogens (C) after 45 min of incubation in Mueller–Hinton medium. High uptake limit is represented by dashed line.解説: 本図は、様々な緑膿菌(P.a.)参照株(A)、対象者由来分離株(B)、およびその他の選択された病原体(C)における、[<sup>68</sup>Ga]Ga-ピオベルジン類のin vitro取り込みを示しています。各株が特定のピオベルジンタイプに対して高い取り込みを示すことが示されており、緑膿菌に対するトレーサーの選択的取り込みが確認されています。
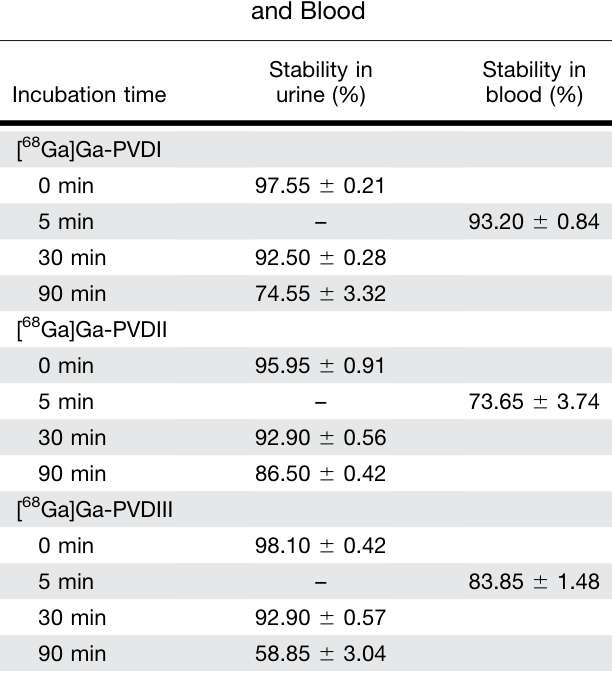
Table 2. TABLE 2 In Vivo Stability of [68Ga]Ga-Pyoverdines in Murine Urine解説: 本表は、マウスの尿と血液中における[<sup>68</sup>Ga]Ga-ピオベルジン類のin vivo安定性を示しています。注射後の異なる時間点(0分、5分、30分、90分)での各[<sup>68</sup>Ga]Ga-ピオベルジン(PVDI、PVDII、PVDIII)の尿中および血中安定性(パーセンテージ)が示されています。
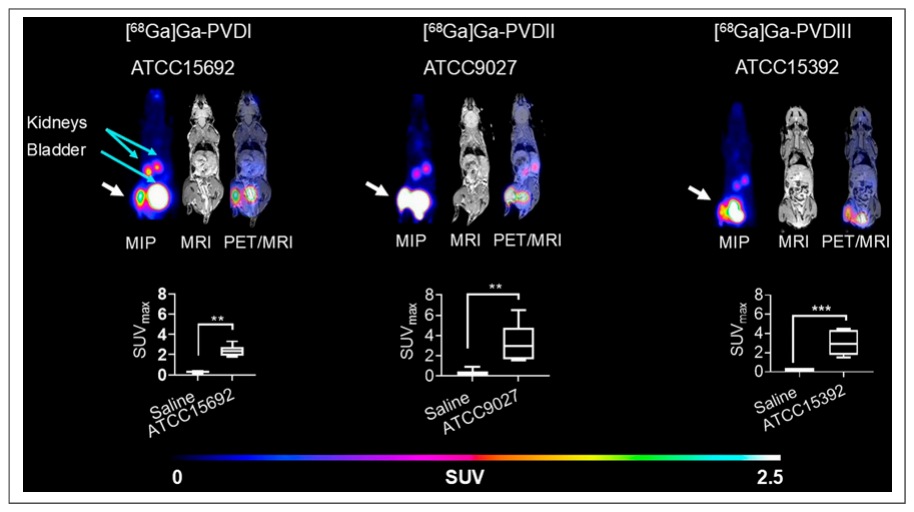
Figure 3. FIGURE 3. Maximum-intensity-projection (MIP), MR, and fused PET/MR sagittal slice images of mice with P. aeruginosa infection (strains ATCC15692, ATCC9027, ATCC15392—each representing 1 of 3 groups) in left hind leg (white arrows) and saline injection in right hind leg. All mice received 50 mL of 109 viable cells/mL of bacterial suspension and were scanned 5 h after infection and 45 min postinjection. Quantification of radioactive signal uptake is shown for each image, comparing left hind legs injected with viable P. aeruginosa strains and right hind legs injected with saline (n 5 3–6). **P , 0.001; ***P , 0.00001. Supplemental Figure 5 shows full combinations and quantification of each tested strain and [68Ga]Ga-pyoverdines.解説: 本図は、緑膿菌感染マウスにおける最大強度投影(MIP)、MR画像、および融合PET/MR矢状断層像を示しています。各画像は、3つのピオベルジングループのうち1つを代表する緑膿菌株(ATCC15692、ATCC9027、ATCC15392)に感染した左後肢(白矢印)と、生理食塩水が注入された右後肢を示しています。放射性シグナルの取り込みの定量化により、感染部位でのトレーサーの蓄積が統計的に有意であることが示されています。
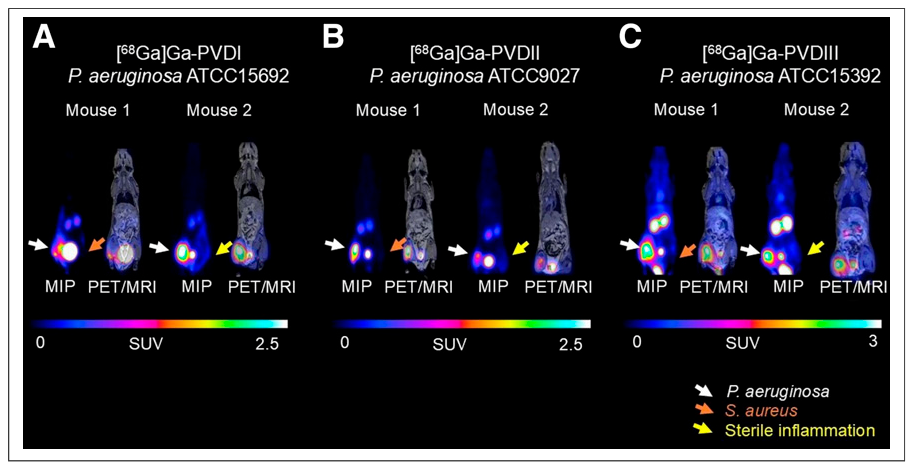
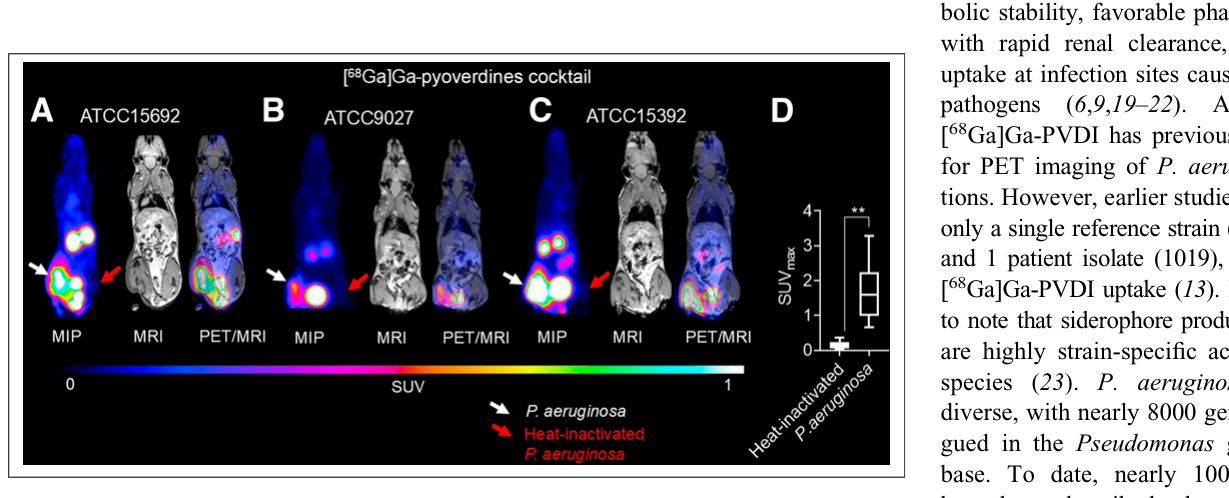
Figure 4. FIGURE 4. Maximum-intensity-projection (MIP) and fused PET/MR sagittal slice images with P. aeruginosa ATCC15692 (A) ATCC9027 (B) and ATCC15392 (C) in left hind leg (white arrows) and S. aureus (orange arrows) in right hind leg (mouse 1) and sterile inflammation in right hind leg (yellow arrows) (mouse 2). Mice were injected with [68Ga]Ga-PVDI (A), [68Ga]Ga-PVDII (B), and [68Ga]Ga- PVDIII (C) 5 h after infection (50 mL of 109 viable cells/mL of P. aeruginosa bacterial culture and 50 mL of 108 viable cells/mL of S. aureus). PET/MRI scans were performed 45 min postinjection.解説: 本図は、緑膿菌(ATCC15692、ATCC9027、ATCC15392)に感染した左後肢(白矢印)、および黄色ブドウ球菌(S. aureus、橙矢印)感染または無菌性炎症(黄矢印)がある右後肢のマウスにおけるMIPと融合PET/MR矢状断層像を示しています。[<sup>68</sup>Ga]Ga-PVDI(A)、[<sup>68</sup>Ga]Ga-PVDII(B)、[<sup>68</sup>Ga]Ga-PVDIII(C)を注射した結果、緑膿菌感染部位にのみ放射性シグナルが蓄積し、他の病原体や無菌性炎症ではシグナルがないことが確認され、本トレーサーの高い特異性を示しています。Figure 6. FIGURE 6. Maximum-intensity-projection (MIP) PET image, sagittal slices of MR, and fused PET/MR images of mice infected with P. aeruginosa ATCC15692 (A) ATCC9027 (B), and ATCC15392 (C) in left hind leg (white arrows) and corresponding heat-inactivated P. aeruginosa strains (red arrows) in right hind leg. All mice received 50 mL of 109 viable cells/mL of bacterial suspension. Mice were injected with [68Ga]Ga-pyoverdines cocktail 5h after infection, and PET/MRI scans were per- formed 45 min postinjection. (D) Comparison of quantification of radioactive signal uptake among left hind legs injected with viable P. aeruginosa strains and right hind legs injected with heat-inactivated P. aeruginosa strains (n 5 8). Results are expressed as SUVmax. **P , 0.001.解説: 本図は、緑膿菌(ATCC15692、ATCC9027、ATCC15392)に感染した左後肢(白矢印)と、対応する熱失活緑膿菌株が注射された右後肢(赤矢印)のマウスにおける、[<sup>68</sup>Ga]Ga-ピオベルジンカクテルによる最大強度投影(MIP)PET画像、MR矢状断層像、および融合PET/MR画像を示しています。(D)では、生菌緑膿菌が注射された左後肢と熱失活菌が注射された右後肢間の放射性シグナル取り込みの定量比較が示されており、生菌にのみトレーサーが特異的に取り込まれることが確認されています。
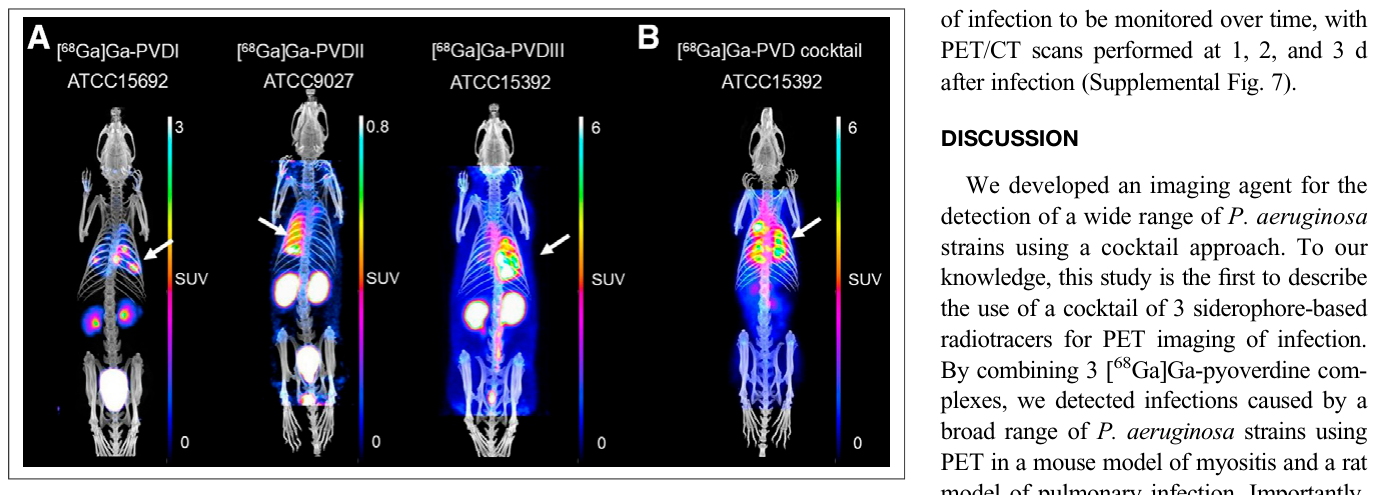
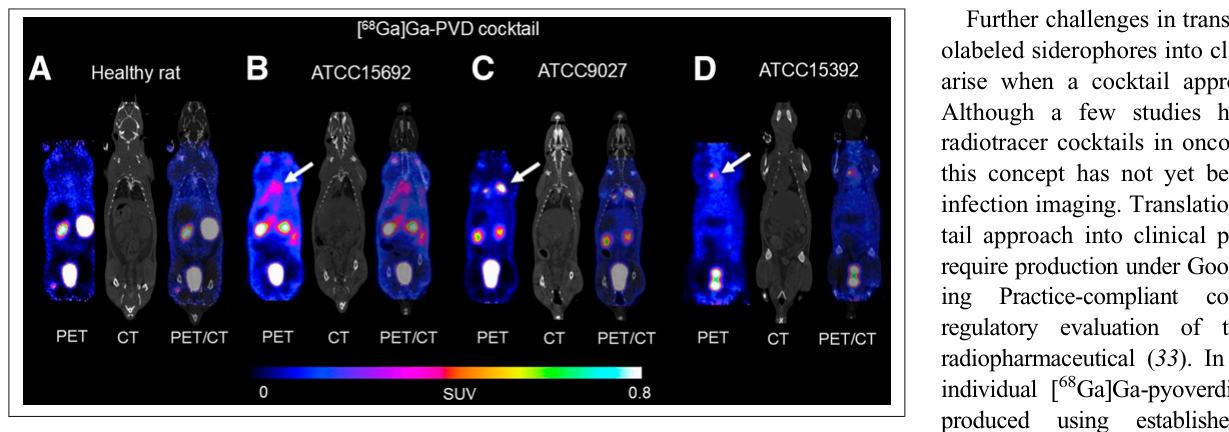
Figure 5. FIGURE 5. PET/CT maximum-intensity-projection images of [68Ga]Ga-pyoverdines in rat lung model of P. aeruginosa infection (24 h after infection and 45 min postinjection of [68Ga]Ga-PVDI (ATCC15692), [68Ga]Ga-PVDII (ATCC9027), [68Ga]Ga-PVDIII (ATCC15392) (A), and [68Ga]Ga- pyoverdines cocktail (ATCC15392) (b). Immunosuppressed rats received 100 mL of suspension con- taining (2–5) 3 108 viable cells/mL. White arrows indicate site of infection.解説: 本図は、ラットの緑膿菌肺感染モデルにおける[<sup>68</sup>Ga]Ga-ピオベルジン類のPET/CT最大強度投影画像を示しています。(A)は単一の[<sup>68</sup>Ga]Ga-ピオベルジン(PVDI、PVDII、PVDIII)を対応する緑膿菌株(ATCC15692、ATCC9027、ATCC15392)に感染したラットに注射した結果を、一方(B)は[<sup>68</sup>Ga]Ga-ピオベルジンカクテルをATCC15392株に感染したラットに注射した結果を示しています。白矢印は感染部位を指しており、肺の感染が検出されていることが分かります。Figure 7. FIGURE 7. PET, CT and fused PET/CT coronal slices of images of [68Ga]Ga-pyoverdines cocktail in rat lung infection model. Immunosuppressed rats were infected with significantly lower infectious dose (compared with Fig. 6): 4 3 107 (B), 1 3 107 (C), and 6 3 106 (D) viable cells/mL. Each rat received 100 mL of corresponding bacterial suspension. Imaging was performed 45 min after injec- tion of [68Ga]Ga-pyoverdines cocktail, 48–72 h after infection, depending on animals’ clinical condi- tion. Uptake shown in healthy control (A) and in lungs infected with ATCC15692 (B), ATCC9027 (C), and ATCC15392 (D). White arrows mark infection sites.解説: 本図は、ラット肺感染モデルにおける[<sup>68</sup>Ga]Ga-ピオベルジンカクテルのPET、CT、および融合PET/CT冠状断層像を示しています。健康な対照ラット(A)と比較して、感染したラット(B: ATCC156992、C: ATCC9027、D: ATCC15392)の肺に放射性シグナルが蓄積していることが示されており、少ない感染量でもカクテルが肺感染を検出できることが示されています。白矢印は感染部位を示しています。


コメントを残す