どうも、Beyond the Pixelです。ハイブリッドPET/MRIは、MRIの優れた軟部組織コントラストとPETの分子・代謝情報を組み合わせることで、心臓病の診断に新たな道を開く強力な画像診断モダリティです。両方のスキャンを同時に行うことで、PETとMRI画像の重ね合わせ精度が向上し、対象者にとっては1回の検査で済む利点があります。また、PET/CTと比較して放射線被ばく量が少ないことも特徴です。
しかし、心臓や冠動脈の画像化は、呼吸や心臓自身の動きによって画像がブレてしまうという大きな課題を抱えています。特に冠動脈は小さく複雑な構造を持つため、高解像度かつ長時間にわたるスキャンが必要となり、この動きによるブレの影響は甚大です。従来、呼吸によるブレの補正には、横隔膜ナビゲーターや呼吸ベルトといった外部センサーが使われてきましたが、これは通常、呼気終末期のデータのみを使用するため、全データの約30%しか利用できず、信号対ノイズ比(SNR)の低下を招いていました。心臓の動きの補正には、心電図(ECG)を用いたゲーティングが一般的ですが、これもまた特定の心拍サイクル期間のデータしか使わないため、SNRが低下する原因となります。
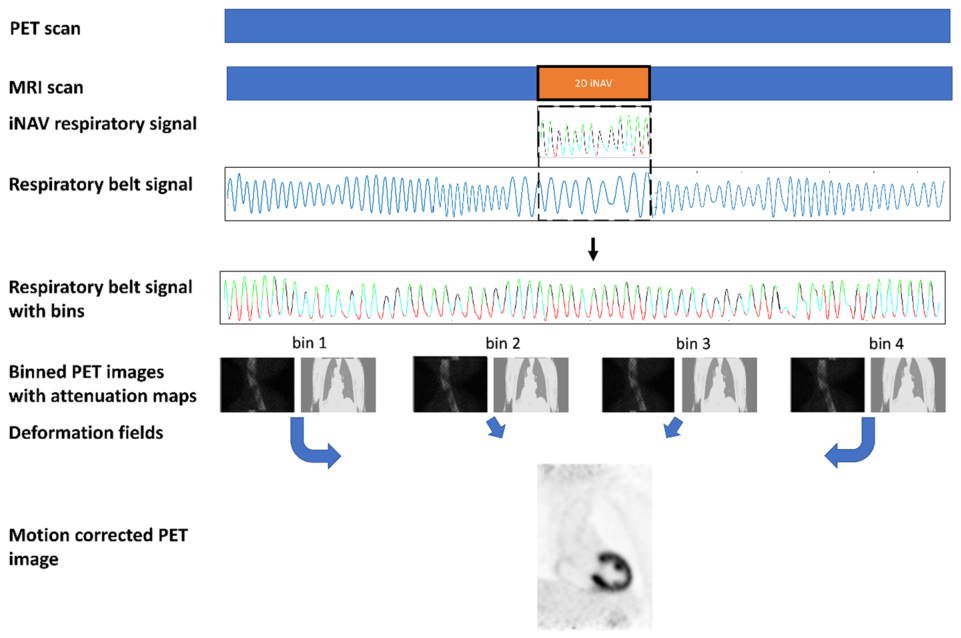
Figure 1. Fig. 1 PET and MRI data are acquired simultaneously. The 2D iNAV is only available for part of the complete examination (i.e. during the CMRA acquisition). The feet-head (FH) motion signal is derived from the iNAV to generate the iNAV respiratory signal. The different colors (green, black, red, and cyan) each represent the bin in which the data acquired during this time window will be allocated. The breathing signal from the respiratory belt (thoracic motion) is available for the entire duration of the scan. By co-registration of the iNAV and belt respiratory signal in the period in which they are acquired simultaneously, the respiratory signal in the entire time period can be used to bin the PET data of the entire PET examination. The µ-map is deformed using the inverse motions fields to match the position of each bin. The deformed µ-map is used to reconstruct PET data for each bin. Next, these PET images are transformed to the end-expiration position using the motion fields again and combined to create the final motion-corrected PET image解説: 本図は、PETとMRIデータが同時に取得される状況を示しています。2D iNAV(画像ナビゲーター)は検査の一部(CMRA取得中)でのみ利用可能です。このiNAV呼吸信号と、検査全体で記録される呼吸ベルト信号を同時に利用し、PETデータを4つのビンに分割します。各ビンで取得されたデータは再構成され、iNAVベースの変形場を使って結合され、最終的な呼吸動態補正PET画像が作成されるプロセスを表しています。
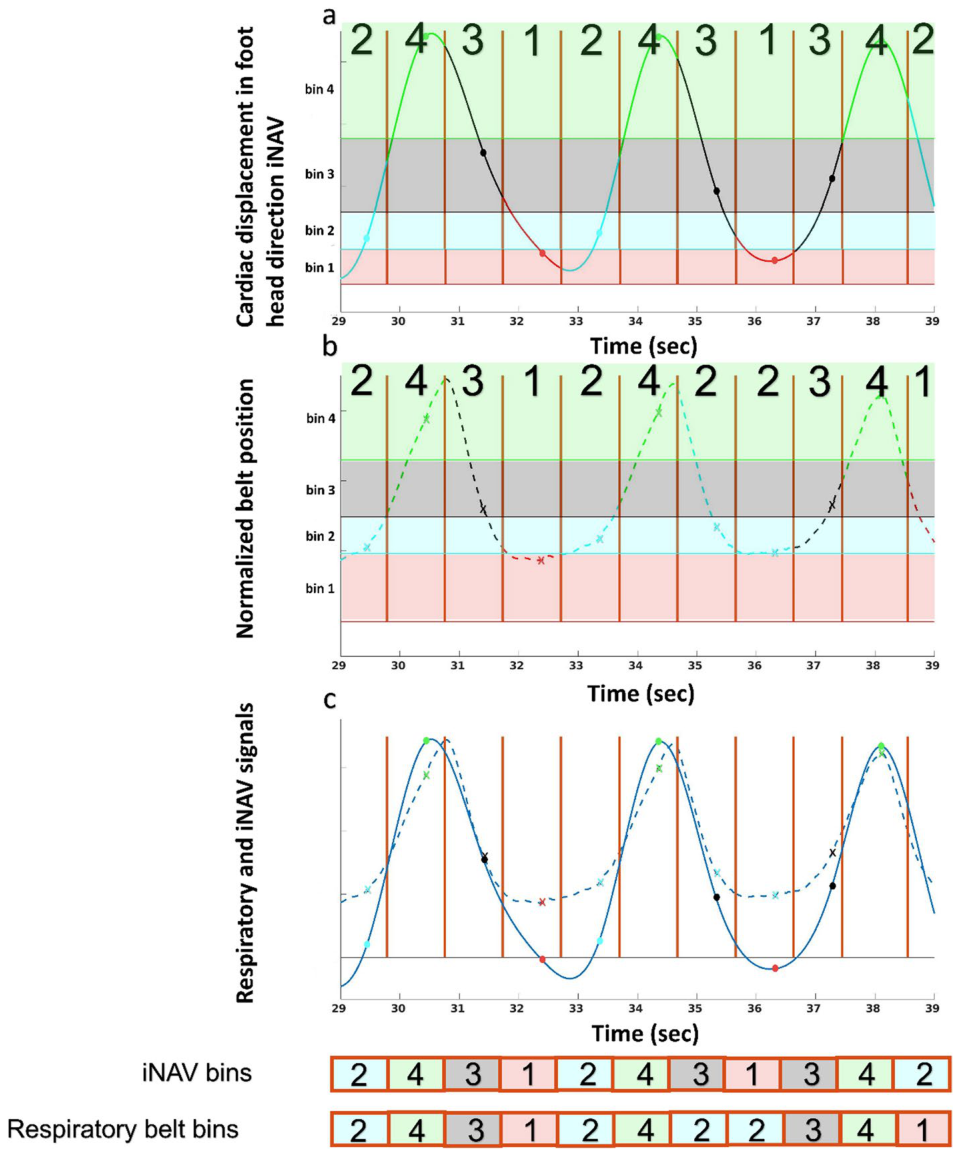
Figure 2. Fig. 2 a Feet head motion recorded by the iNAV. b Thoracic motion recorded with the respiratory belt. c Overlapping signal from the iNAV (a) and the respiratory belt (b). The solid vertical lines represent the R-peak in the ECG signal. The dots on curve in sub-plot a represent the time points at which the iNAV was acquired in the R–R wave. The crosses on curve in sub-plot b represent the corresponding time points signal from the respiratory belt. The shaded horizontal regions in panel a and b represent the 4 bins. All PET data acquired in an R-R interval is allocated to one of the 4 bins. The bin to which the data is allocated is based on the displacement of the heart as determined by the iNAV. For example, in panel a, the data in the first panel is allocated to bin 2 as the iNAV acquired for the R–R interval falls within the bin 2 thresholds. The four colors represent the 4 bins. Red represents bin 1, cyan bin 2, black bin 3 and green bin 4解説: 本図は、iNAVによって記録された足元から頭部方向の心臓の動き(a)、呼吸ベルトで記録された胸部の動き(b)、および両信号の重なり(c)を示しています。垂直線はECGのR波ピークを表し、ドットやクロスはiNAVまたは呼吸ベルトがデータを取得した時点を示します。色分けされた水平領域は4つのビンを表し、PETデータがどのビンに割り当てられるかの閾値を示しています。最下段にはiNAVビンと呼吸ベルトビンが比較されています。
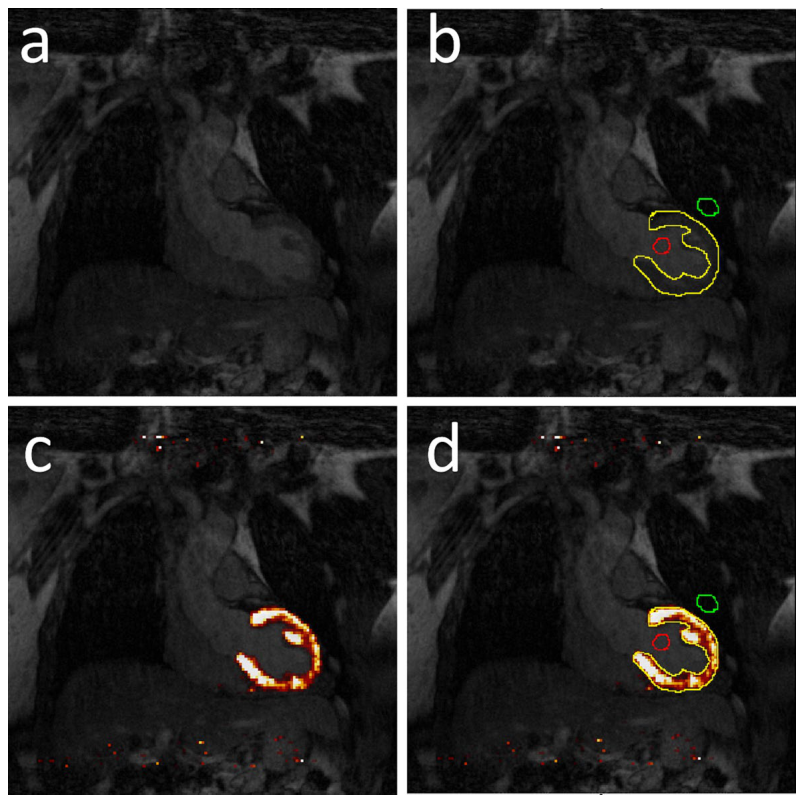
Figure 3. Fig. 3 MR and 18F-FDG PET/MR images of the myocardium. a CMRA image, b CMRA image with the volumes of Interest (VOIs) that encompasses the left ventricular wall (yellow), a VOI in the middle of the left ventricular cavity (red) and a VOI in the lung close to the myocardium (green) c shows a color overlay of the PET image projected on the CMRA image. d PET/MR image with the three VOIs解説: 本図は、心筋のMR画像と18F-FDG PET/MR画像を示しています。(a)はCMRA画像、(b)は左心室壁(黄色)、左心室腔の中央(赤色)、心筋に近い肺(緑色)に設定された体積関心領域(VOI)が重ねられたCMRA画像です。(c)はPET画像をCMRA画像にカラーオーバーレイしたもので、(d)は3つのVOIが重ねられたPET/MR画像です。
定量評価の結果
ペアワイズ比較の結果、以下の点が明らかになりました。
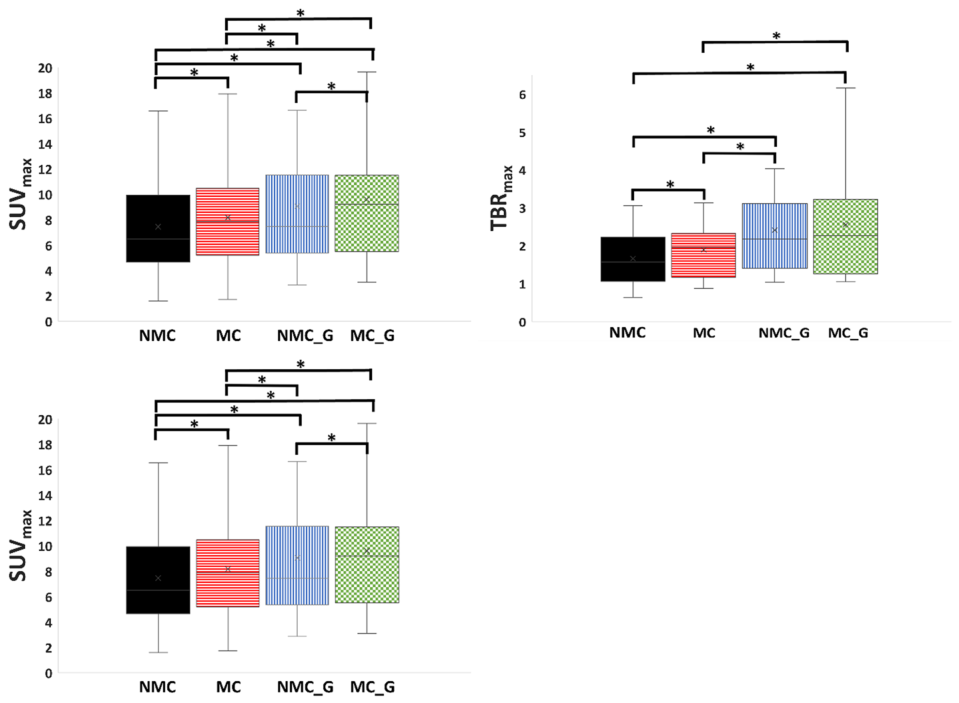
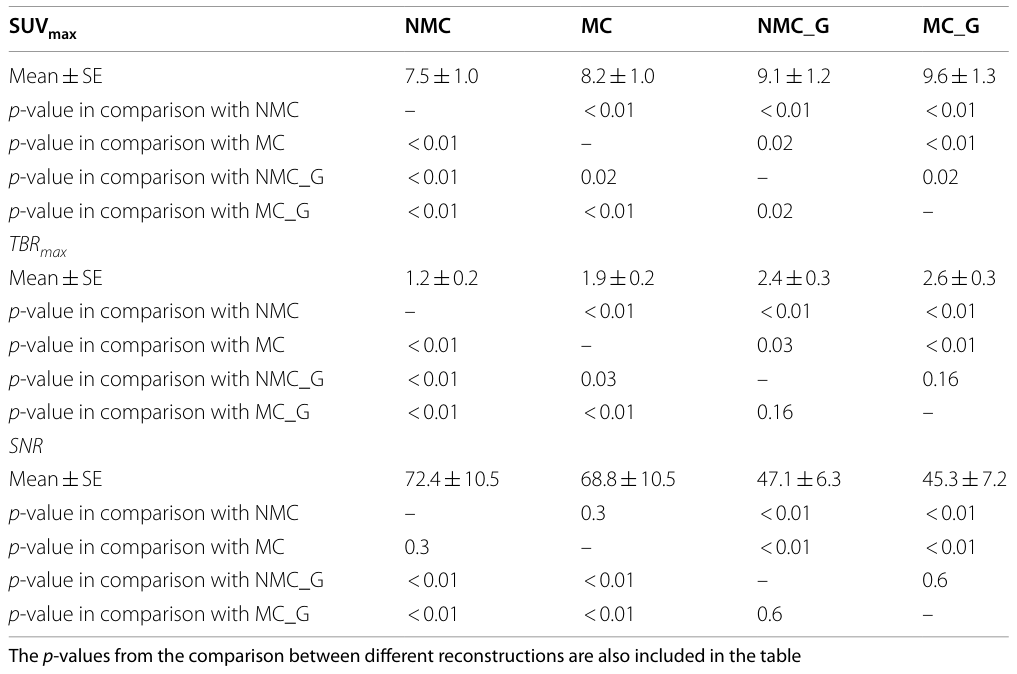
* MC vs NMC: 呼吸動態補正(MC)データセットのSUVmaxおよびTBRmax値は、非補正(NMC)データセットよりも有意に高値でした(SUVmax: 8.2±1.0 vs 7.5±1.0, p < 0.01; TBRmax: 1.9±0.2 vs 1.2±0.2, p < 0.01)。これは呼吸動態補正が画像のブレを低減し、トレーサーの取り込み値を正確に反映したことを示唆しています。
* MC_G vs NMC_G: 呼吸動態補正とゲーティングを組み合わせた(MC_G)データセットのSUVmaxおよびTBRmax値も、非補正だがゲーティングあり(NMC_G)データセットより高値でした(SUVmax: 9.6±1.3 vs 9.1±1.2, p = 0.02; TBRmax: 2.6±0.3 vs 2.4±0.3, p = 0.16)。TBRmaxについては統計的有意差は見られませんでしたが、傾向は同様でした。
* SNRの維持: 呼吸動態補正(MC)は、SNRを統計的に有意に変化させませんでした。これは、全PETデータを利用したため、データ破棄によるSNR低下がなかったことを意味します。
* ゲーティングによるSNR低下: 心臓ゲーティングを適用した再構成(NMC_GおよびMC_G)は、ゲーティングなしの再構成と比較して、有意に低いSNRを示しました。これは、ゲーティングによりPETカウント数が大幅に減少するため、予想通りの結果です。
これらの結果は、
Figure 4. Fig. 4 Box plots of the SUVmax a TBRmax b and SNR c for each of the four reconstructions (NMC, MC, NMC_G and MC_G) for the 19 datasets included in this study. The ‘x’ inside the box represents the mean value, the horizontal line the median value, the box represents the 1st and 3rd quartile. The ‘whiskers’ show the lowest and highest values and the asterisk (*) shows significant difference between two comparisons解説: 本図は、本研究で評価された4つの再構成(NMC、MC、NMC_G、MC_G)におけるSUVmax、TBRmax、およびSNRのボックスプロットを示しています。ボックス内の「x」は平均値、水平線は中央値、ボックスは第1四分位点と第3四分位点を表し、アスタリスク(*)は統計的有意差を示しています。提供された画像では、SUVmax、TBRmax、そして再度SUVmaxの3つのプロットが表示されており、キャプションのSNRプロットとは一部内容が異なります。⚠ 自動抽出画像の検証で一致を確認できませんでした。正確な内容は元論文のFigure 4をご参照ください。
のボックスプロットと、
Table 1. Table 1 Table showing the mean and standard error values of each of the four reconstructions for each of the three quantitative parameters assessed in this study解説: 本表は、SUVmax、TBRmax、およびSNRについて、4種類の再構成(NMC、MC、NMC_G、MC_G)それぞれの平均値と標準誤差を示しています。また、異なる再構成間の比較におけるp値も含まれており、統計的有意差の有無を判断できます。
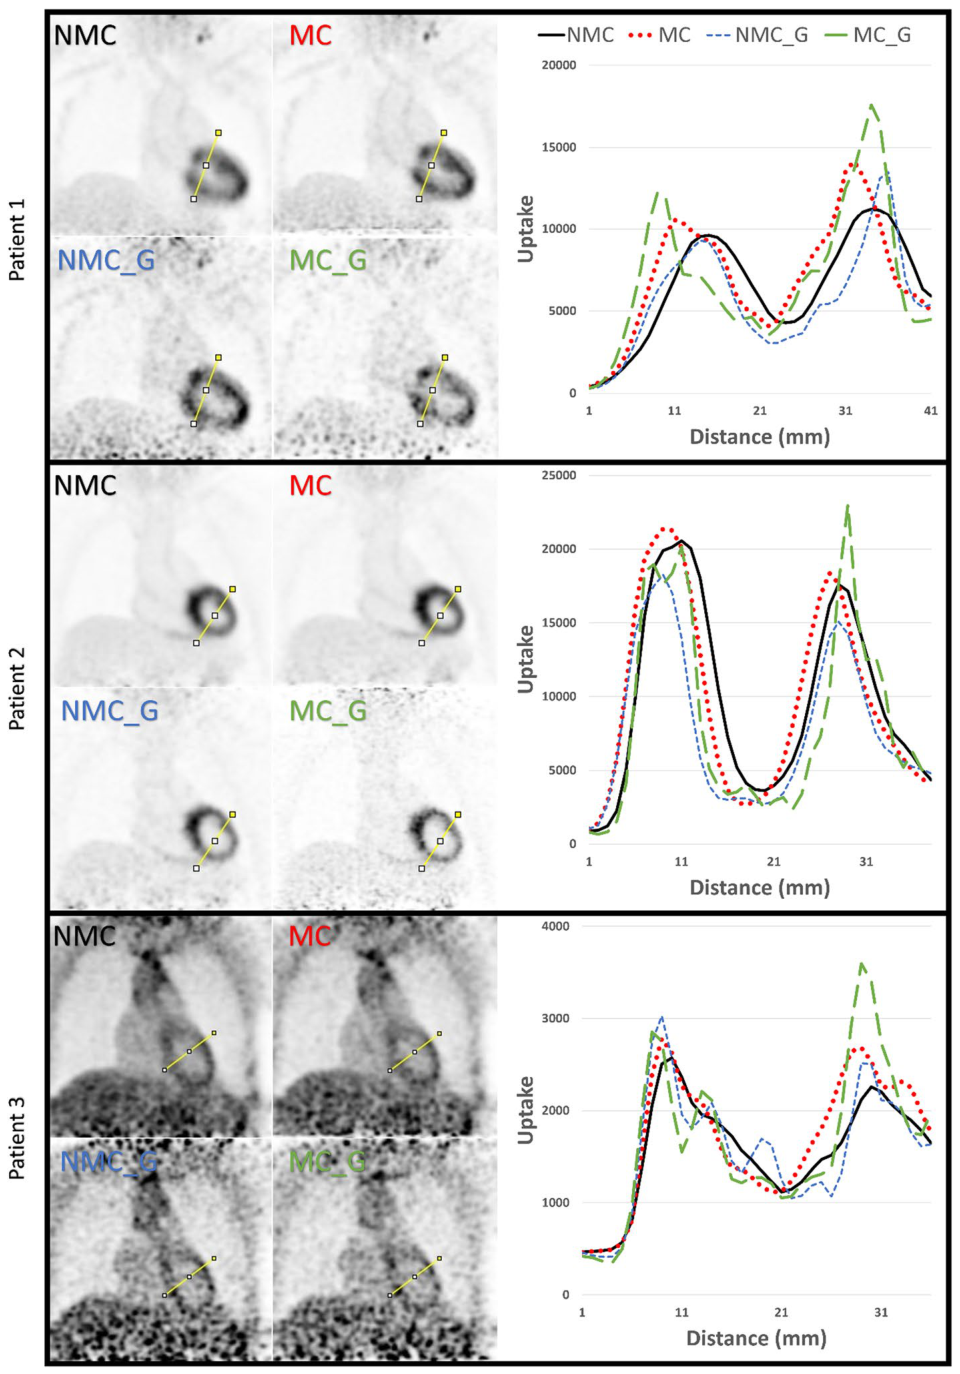
Figure 5. Fig. 5 Line profiles (column on the right) through the myocardium of the four PET reconstructions (NMC, MC, NMC_G and MC_G) of three patients injected with 18F-FDG are shown. The data for the line profiles were acquired at the same location for each reconstruction per patient (yellow lines). The line profiles represent the 18F-FDG uptake values for each reconstruction (black = no motion correction, red = motion corrected no gating, blue = no motion correction but gating and green = motion corrected and gated)解説: 本図は、18F-FDGを投与された3人の対象者について、4種類のPET再構成(NMC、MC、NMC_G、MC_G)と、その心筋を横切るラインプロファイル(右列)を示しています。ラインプロファイルは、各再構成(黒=非補正、赤=呼吸動態補正のみ、青=非補正・ゲーティングあり、緑=呼吸動態補正・ゲーティングあり)における18F-FDGの取り込み値と距離の関係を表しています。
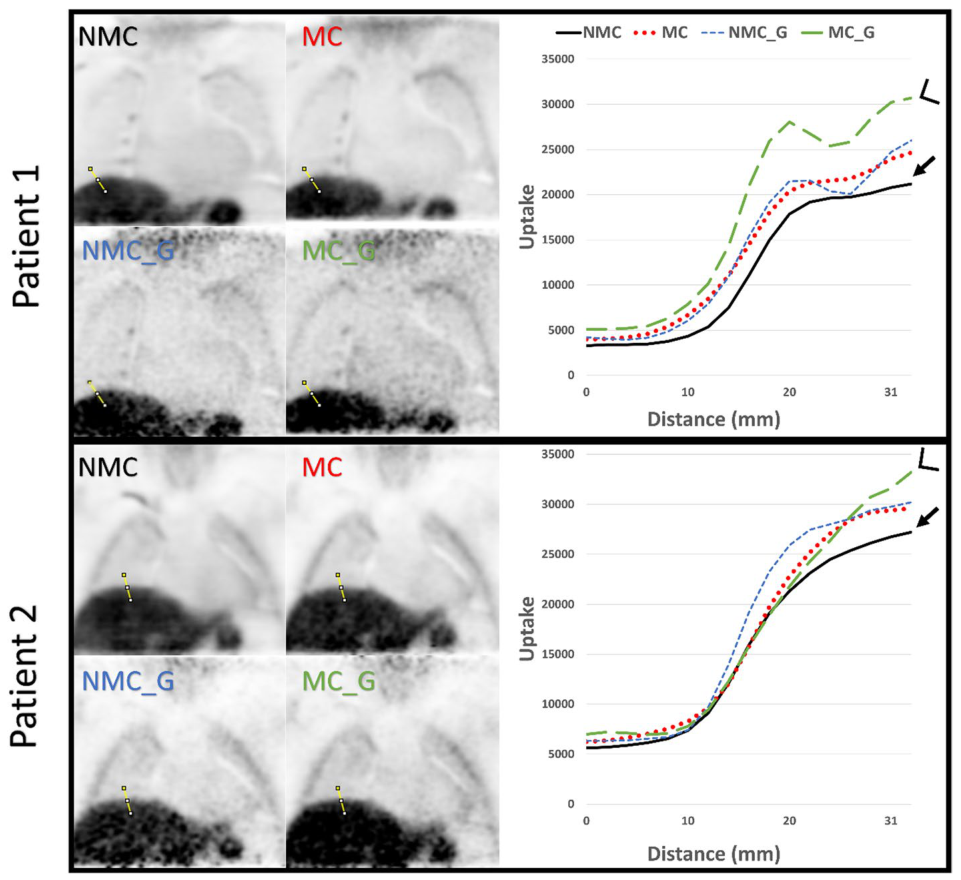
Figure 6. Fig. 6 Line profiles (column on the right) on the liver-lung interface of the four PET reconstructions (NMC, MC, NMC_G and MC_G) of two patients injected with 18F-FCH are shown. The data for the line profiles were acquired at the same location for each reconstruction per patient (yellow lines). The line profiles represent the 18F-FCH uptake values for each reconstruction (black = no motion correction, red = motion corrected no gating, blue = no motion correction but gating and green = motion corrected and gated). The arrow in the plots indicates the maximum uptake value for the no motion correction reconstruction in the liver and the arrow heads indicates the higher uptake value of the reconstruction with motion correction and cardiac gating解説: 本図は、18F-FCHを投与された2人の対象者について、4種類のPET再構成(NMC、MC、NMC_G、MC_G)と、肝臓と肺の境界面におけるラインプロファイル(右列)を示しています。ラインプロファイルは、各再構成(黒=非補正、赤=呼吸動態補正のみ、青=非補正・ゲーティングあり、緑=呼吸動態補正・ゲーティングあり)における18F-FCHの取り込み値と距離の関係を表しています。

コメントを残す