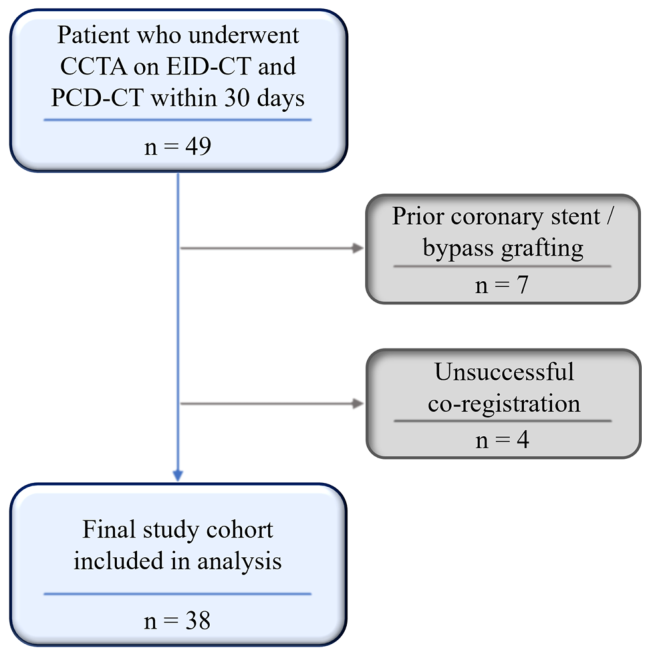
Figure 1. Fig. 1 Flowchart of the study population selection process. EID, energy- integrating detector; PCD, photon-counting detector解説: このフローチャートは、研究対象者の選定プロセスを示しています。EID-CTとPCD-CTの両方で冠動脈CT血管造影を受けた49名の対象者が最初にスクリーニングされました。そのうち、冠動脈ステント留置術またはバイパス移植術の既往がある7名と、画像処理が失敗した4名が除外され、最終的に38名の対象者が解析に含まれました。
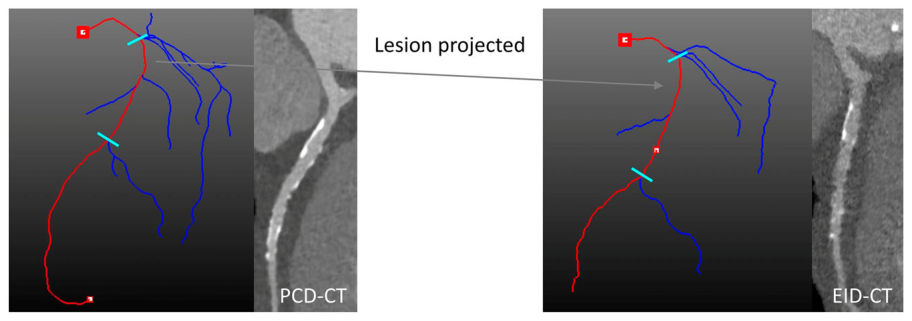
Figure 2. Fig. 2 Representative example of lesion co-registration between PCD-CT and EID-CT. Curved multiplanar reformats show a predominantly calcified plaque along the left anterior descending artery. Three-dimensional vessel models (red, target vessel; blue, side branches) display automated lumen and wall detection; cyan markers indicate the proximal and distal lesion endpoints. The reference lesion was projected onto the paired reconstruction via closest-point mapping along registered centerlines, ensuring spatial alignment and consistent 3D mask placement across series. PCD, photon-counting detector; EID, energy-integrating detector解説: この画像は、PCD-CTとEID-CT間での病変のコ・レジストレーションの代表例を示しています。曲面多断面再構成画像は、左前下行枝に沿った主に石灰化したプラークを示しています。3次元血管モデル(赤:ターゲット血管、青:側枝)は、自動化されたルーメンと血管壁の検出を表示しており、シアンのマーカーは病変の近位および遠位終点を示しています。参照病変は、登録された中心線に沿った最近点マッピングを介して、対になる再構成に投影され、シリーズ間で空間的に整合性のある3Dマスク配置を確保しました。
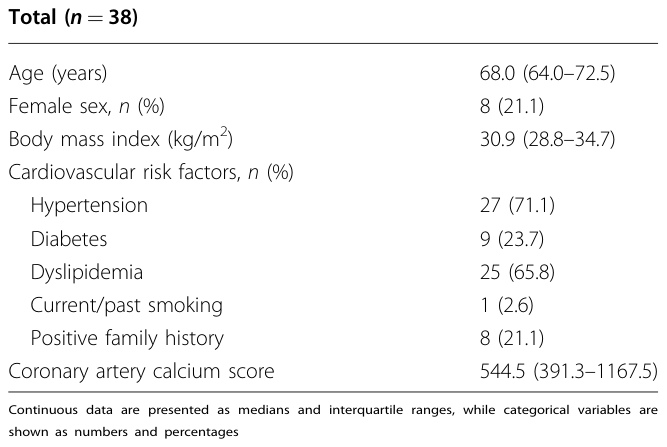
Table 1. Table 1 Demographic and clinical profile of participants解説: この表は、研究参加者の人口統計学的および臨床的特徴をまとめたものです。38名の対象者の年齢中央値、女性の割合、BMI、心血管リスク因子(高血圧、糖尿病、脂質異常症、喫煙歴、家族歴)、および冠動脈石灰化スコアが示されています。連続データは中央値と四分位範囲で、カテゴリカル変数は絶対頻度と割合で示されています。
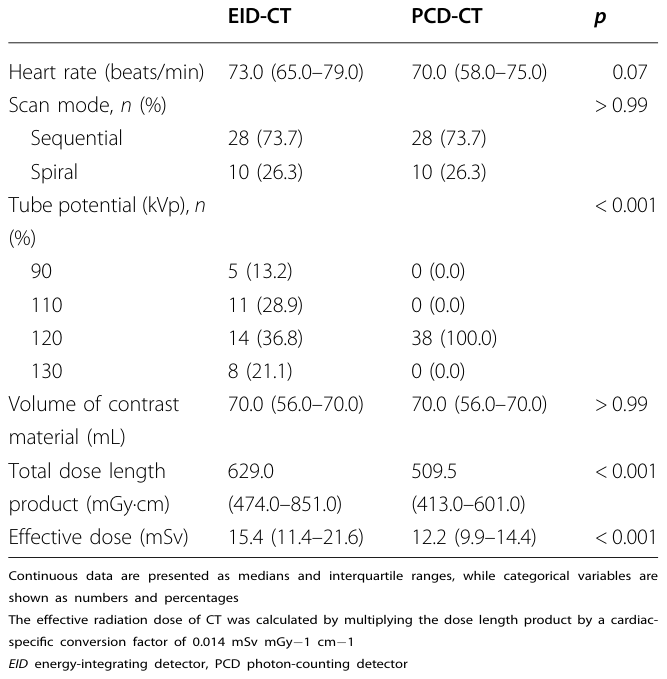
に示されています。スキャン間の期間の中央値は14.0日でした。スキャン時の心拍数や造影剤量などは、EID-CTとPCD-CTで類似していましたが、PCD-CTではEID-CTよりも低い実効線量でスキャンが実施されました(PCD-CT: 12.2mSv vs EID-CT: 15.4mSv、p < 0.001)。スキャンに関する詳細なパラメータは
Table 2. Table 2 Acquisition parameters of the scans解説: この表は、CTスキャンの取得パラメータをEID-CTとPCD-CTに分けて示しています。心拍数、スキャンモード、管電圧(kVp)、造影剤量、総線量長積、実効線量の各項目が比較されており、EID-CTとPCD-CT間の統計的有意差(p値)も示されています。PCD-CTでは実効線量が有意に低いことが示されています。
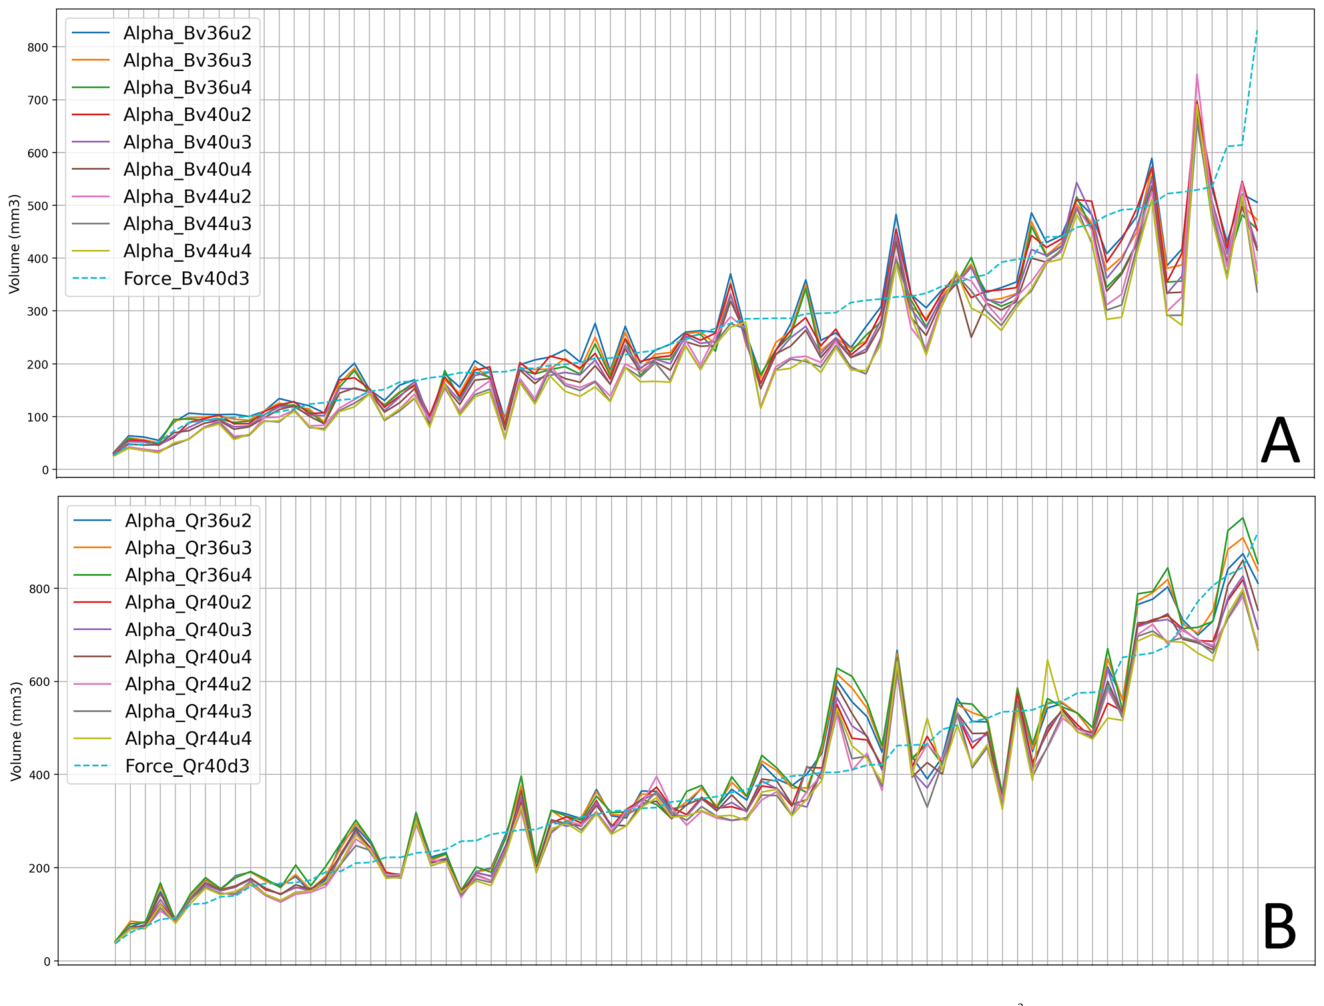
Figure 3. Fig. 3 Vessel-level total plaque volumes across EID-CT and PCD-CT reconstructions. Line plots show volumes (mm³) for PCD-CT reconstructions (solid lines) overlaid on the EID-CT reference (dashed line). Samples along the x-axis are sorted in ascending order based on EID-CT volumes. A shows the comparison of vascular (Bv) kernels, while B demonstrates differences for the quantitative (Qr) kernels. EID, energy-integrating detector; PCD, photon- counting detector解説: このグラフは、EID-CTとPCD-CTの再構成における血管レベルの総プラーク体積を示しています。PCD-CTの再構成(実線)の体積(mm³)が、EID-CTの参照値(破線)に重ねて表示されています。X軸のサンプルは、EID-CTの体積に基づいて昇順に並べられています。Aは血管用(Bv)カーネルの比較を、Bは定量的(Qr)カーネルの比較を示しています。
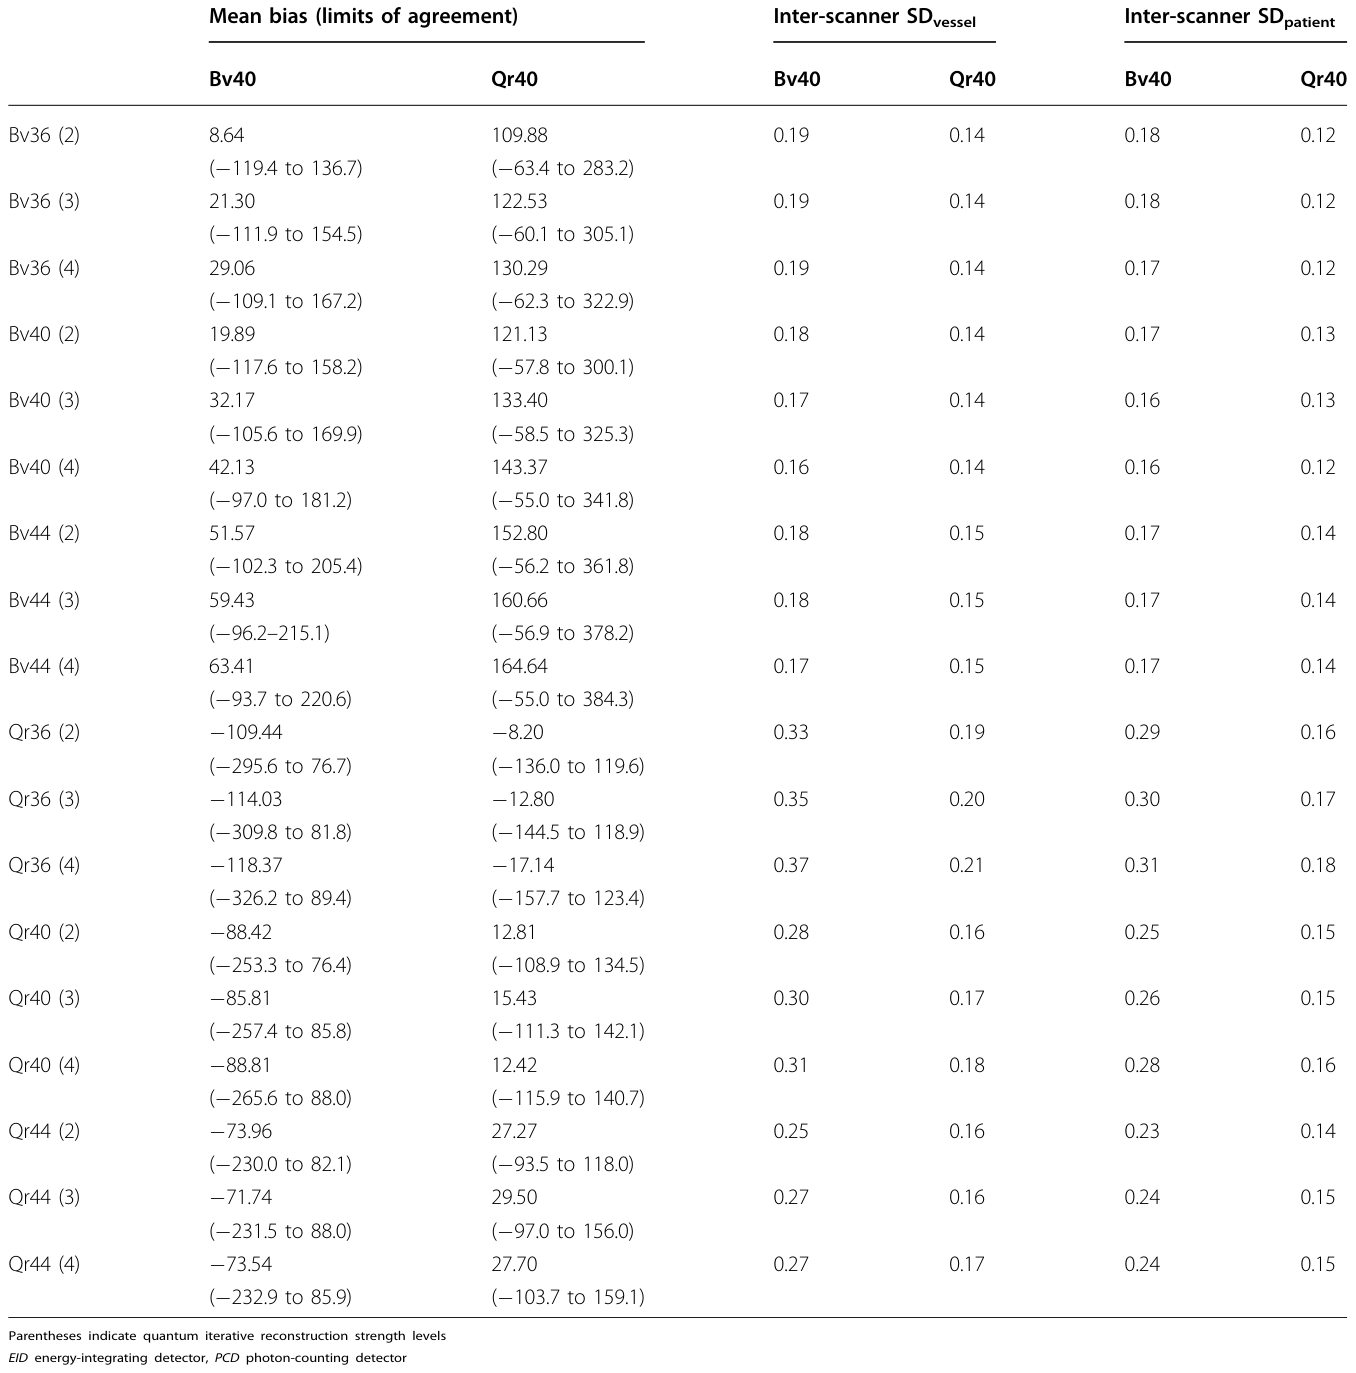
Table 3. Table 3 Variability in total plaque volume measurements between EID-CT and PCD-CT解説: この表は、EID-CTとPCD-CT間での総プラーク体積測定におけるばらつきをまとめたものです。各再構成ペアにおける平均バイアス(および一致の限界)、血管ベースのCT装置間標準偏差、および対象者ベースのCT装置間標準偏差が示されています。括弧内の数字は量子反復再構成強度レベルを示しています。
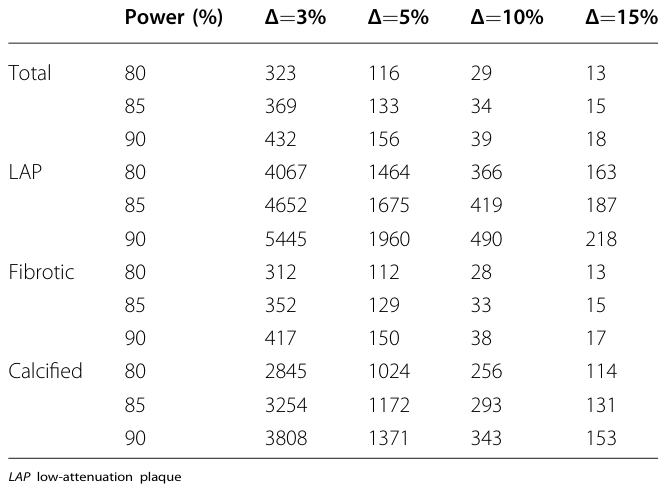
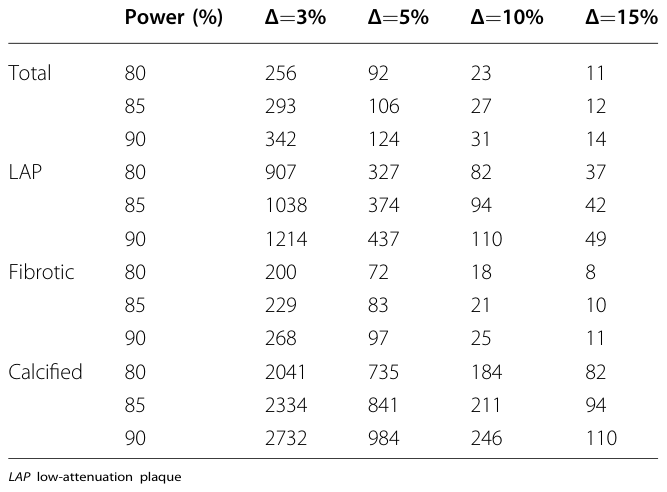
Table 4. Table 4 Sample-size requirements to detect proportionate changes by vessel-based analysis解説: この表は、血管ベースの解析における、割合の変化を検出するためのサンプルサイズ要件を示しています。検出力80%、85%、90%の各レベルで、総プラーク、低吸収プラーク(LAP)、線維性プラーク、石灰化プラークの体積において3%、5%、10%、15%の変化を検出するために必要な血管数(グループあたり)が示されています。
および
Table 5. Table 5 Sample-size requirements to detect proportionate changes by patient-based analysis解説: この表は、対象者ベースの解析における、割合の変化を検出するためのサンプルサイズ要件を示しています。検出力80%、85%、90%の各レベルで、総プラーク、低吸収プラーク(LAP)、線維性プラーク、石灰化プラークの体積において3%、5%、10%、15%の変化を検出するために必要な対象者数(グループあたり)が示されています。
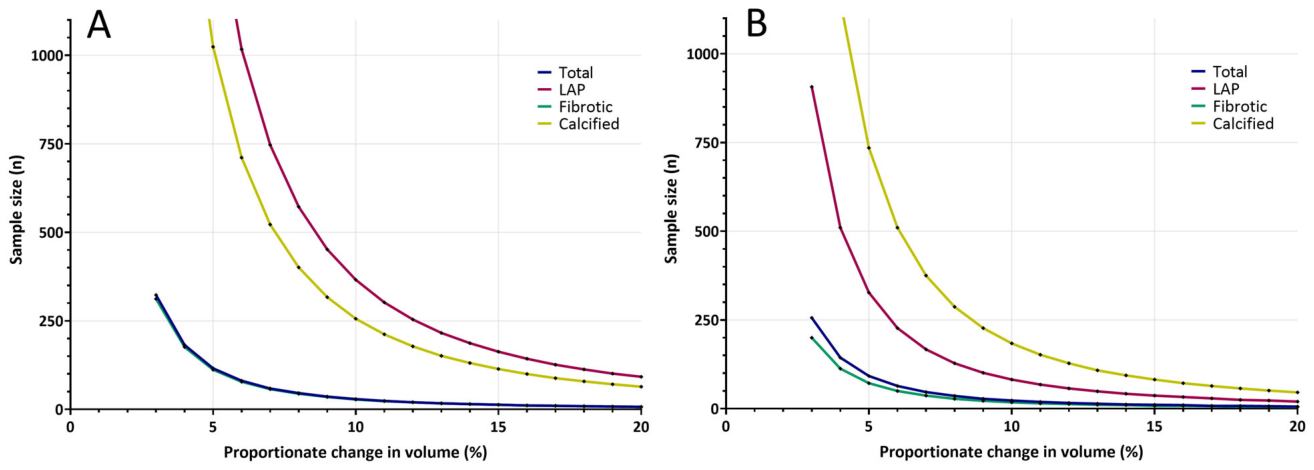
に示されており、各プラークコンポーネントのサンプルサイズと期待される変化の依存関係は
Figure 5. Fig. 5 Sample-size requirements by plaque component. Curves show the required per-group sample size to detect proportionate vessel—(A) and patient-level (B) changes in plaque volume at α = 0.05 and 80% power. Separate curves are displayed for total (blue), low-attenuation (magenta), fibrotic (green), and calcified (yellow) plaques. Calculations use the inter-scanner standard deviation of signed paired differences between the EID-CT reference and harmonized PCD-CT reconstructions. EID, energy-integrating detector; LAP, low-attenuation plaque; PCD, photon-counting detector解説: このグラフは、プラークコンポーネントごとのサンプルサイズ要件を示しています。α=0.05および80%の検出力で、プラーク体積における割合の変化を検出するために必要なグループあたりのサンプルサイズ(n)を示しています。Aは血管レベルの変化、Bは対象者レベルの変化を表しており、総プラーク(青)、低吸収プラーク(マゼンタ)、線維性プラーク(緑)、石灰化プラーク(黄)について個別の曲線が表示されています。
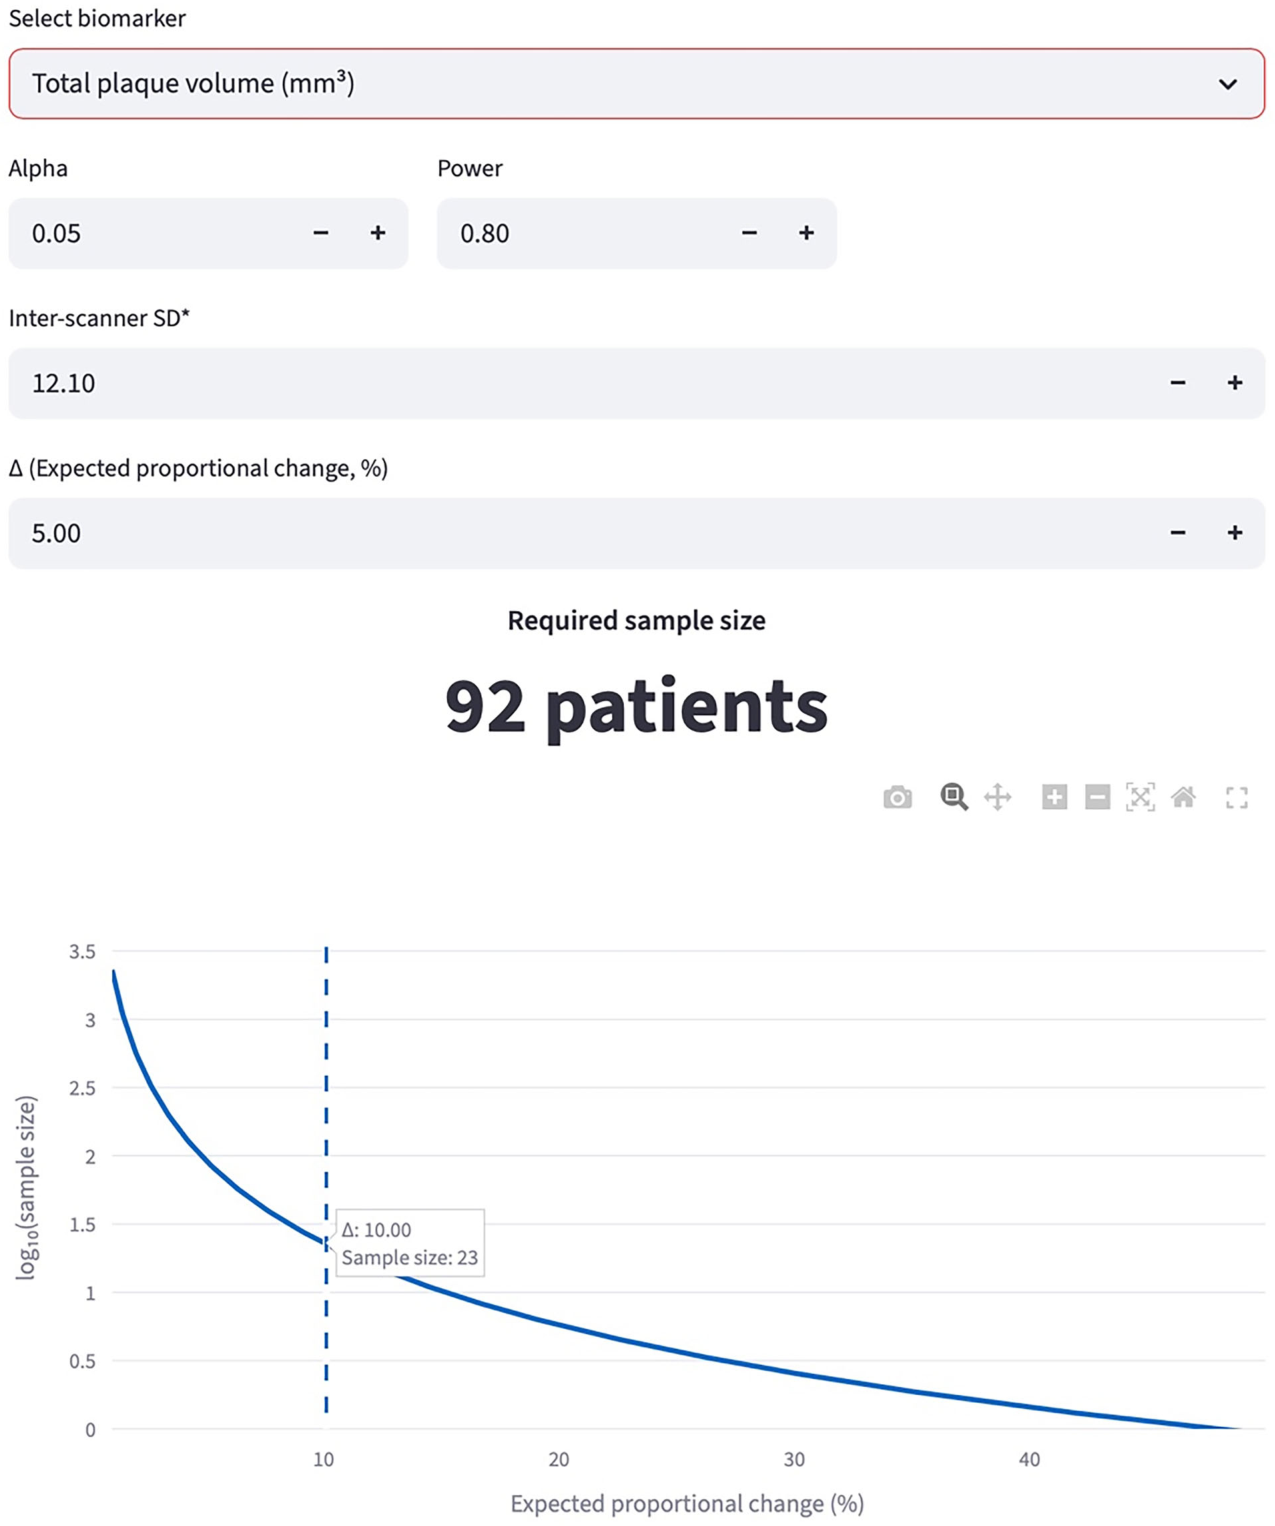
Figure 6. Fig. 6 Online sample-size calculator for longitudinal coronary plaque progression studies. The web-based calculator estimates the required sample size under user-defined statistical assumptions. Users specify the biomarker of interest, two-sided significance level, desired statistical power, patient-level inter-scanner standard deviation (automatically populated from the present results but adjustable), and the expected proportional change (Δ). The tool outputs the required sample size for the selected study design and visualizes the relationship between expected proportional change and required sample size on a logarithmic scale, with the selected proportional change (Δ) indicated解説: この図は、縦断的な冠動脈プラーク進行研究のためのオンラインサンプルサイズ計算ツールを示しています。ウェブベースの計算ツールは、ユーザーが定義した統計的仮定に基づいて必要なサンプルサイズを推定します。ユーザーは、関心のあるバイオマーカー、両側検定の有意水準、希望する統計的検出力、対象者レベルのCT装置間標準偏差(現在の結果から自動入力されるが調整可能)、および期待される割合の変化(Δ)を指定します。このツールは、選択された研究デザインに必要なサンプルサイズを出力し、期待される割合の変化と必要なコホートサイズの関係を対数スケールで視覚化します。


コメントを残す