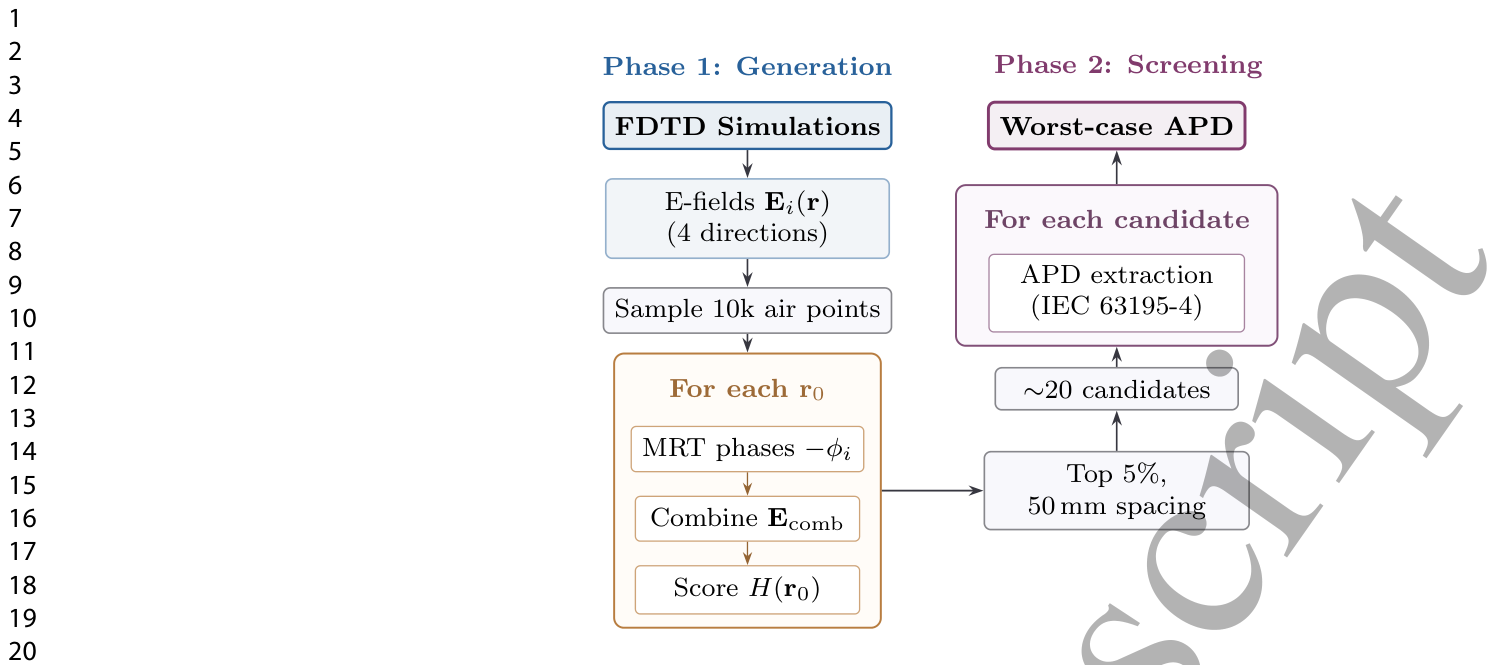
Figure 2. Figure 2: Two-stage screening reduces computational cost 500 times. Phase 1 evaluates 10,000 candidates using an efficient hotspot score based on E-field intensity at nearby skin voxels. Phase 2 performs full APD extraction following IEC/IEEE 63195-4 only on the top 20 candidates.解説: この図は、最悪ケースのAPD(吸収パワー密度)を探すための2段階のスクリーニングプロセスを示しています。フェーズ1では、FDTDシミュレーションで得られた電界データとMRTフェーズから効率的なホットスポットスコアを計算し、10,000の候補点を評価します。フェーズ2では、上位5%(約20個)の候補点にのみ、IEC/IEEE 63195-4に従った完全なAPD抽出を行います。これにより、計算コストを500分の1に削減できます。
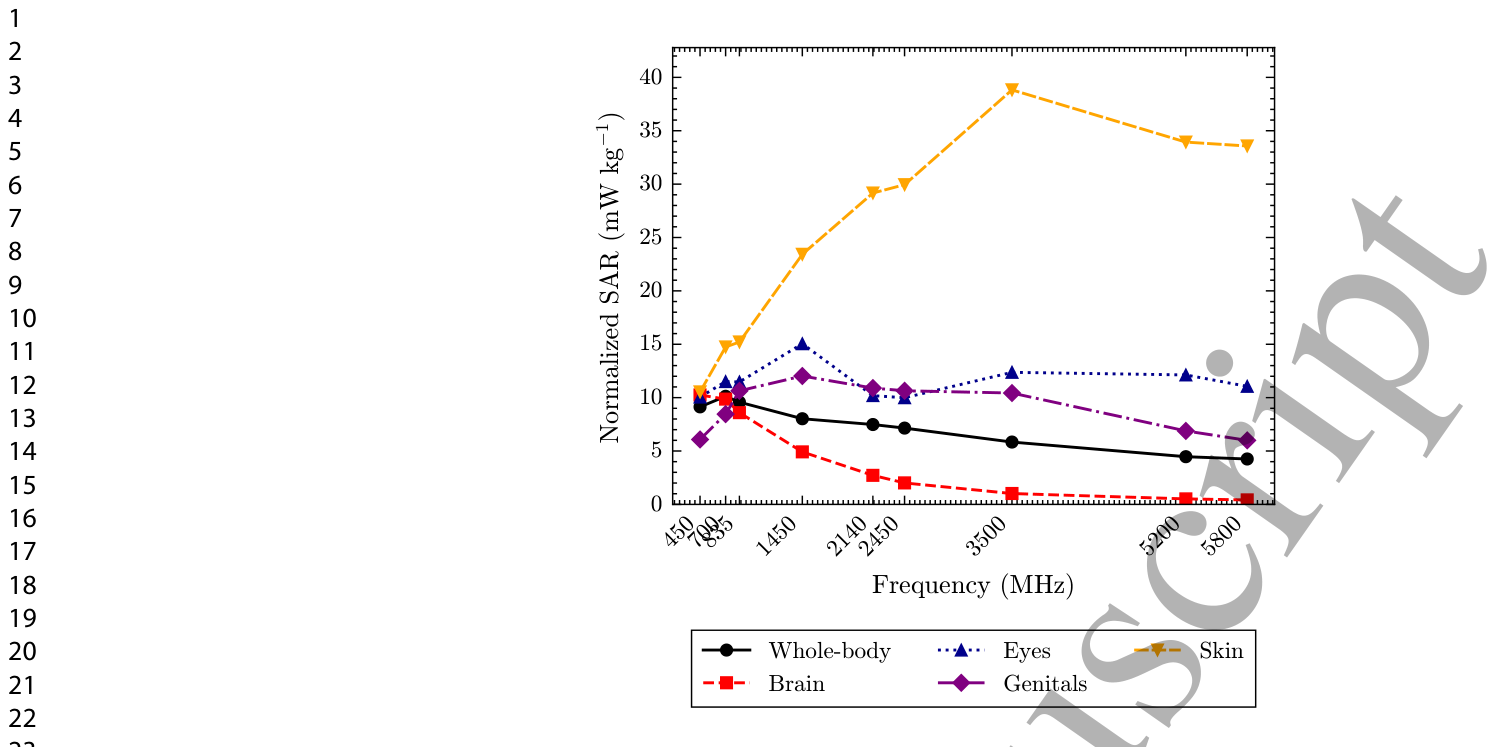
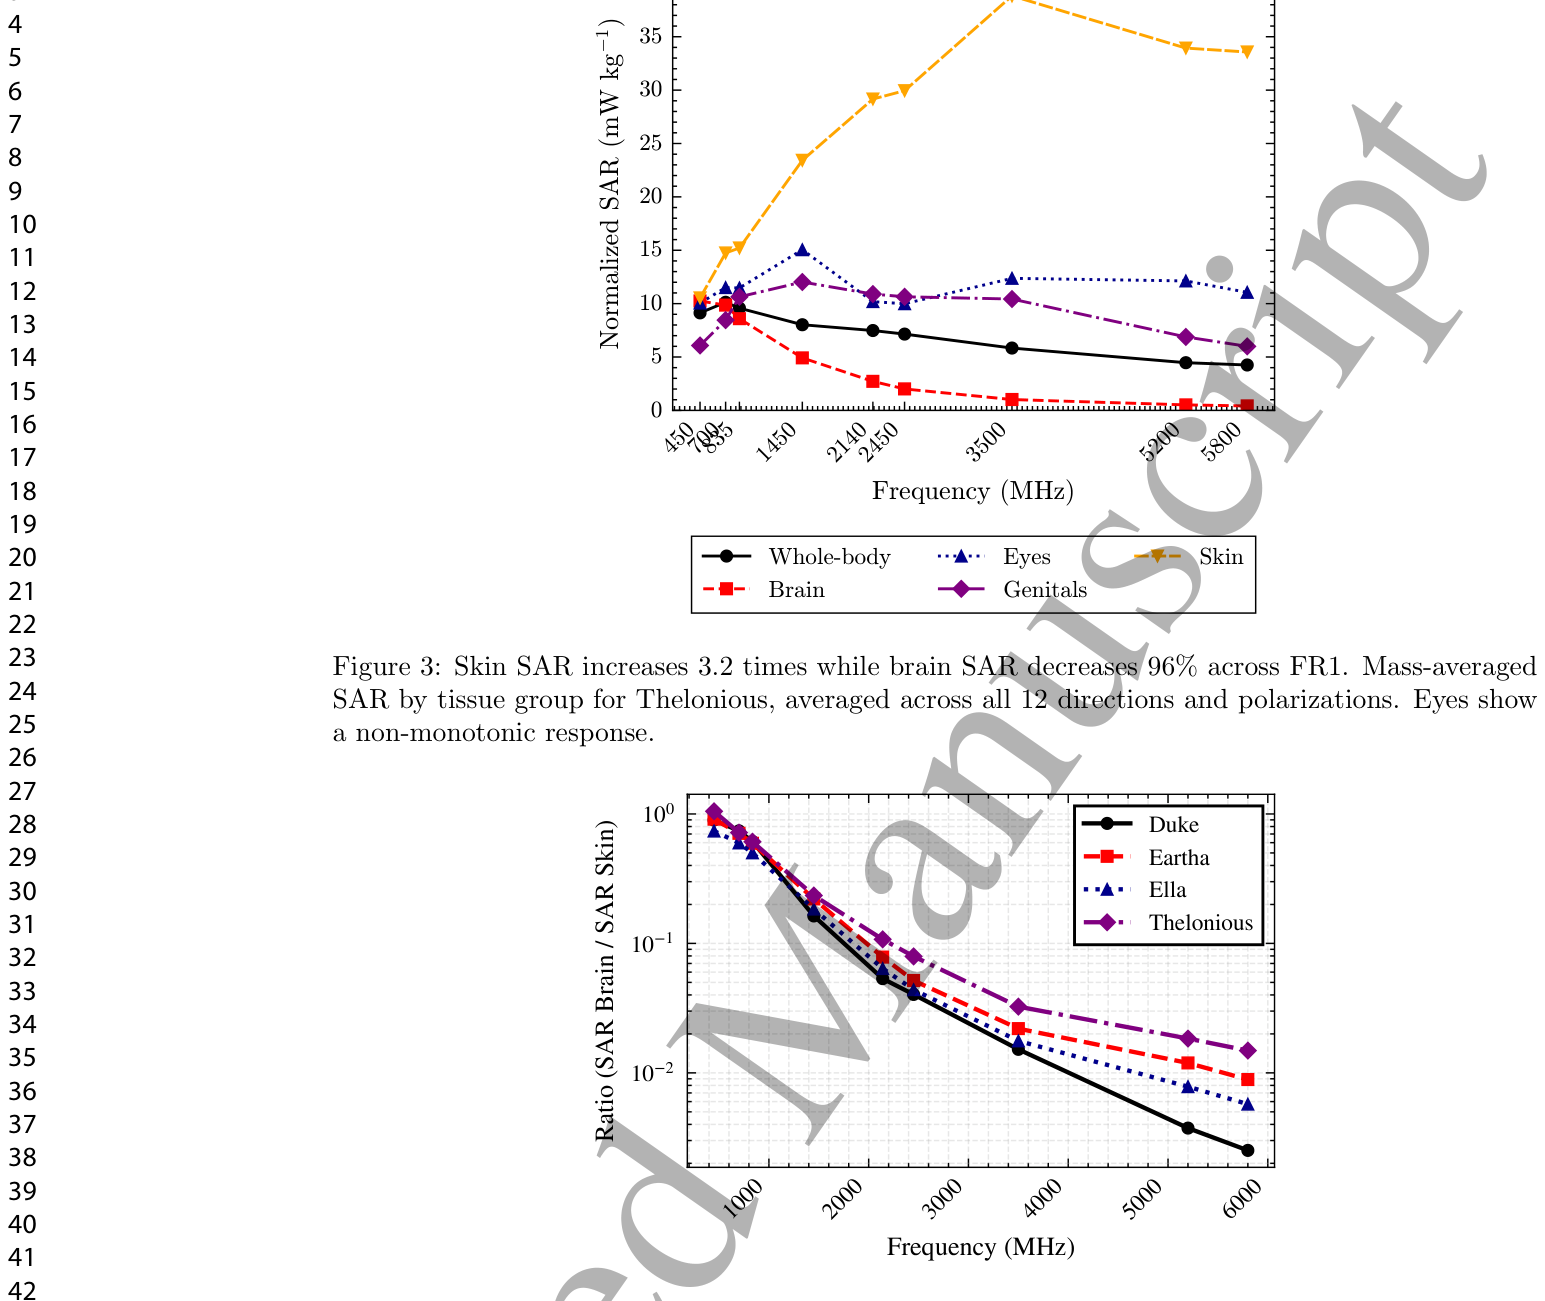
Figure 3. Figure 3: Skin SAR increases 3.2 times while brain SAR decreases 96% across FR1. Mass-averaged SAR by tissue group for Thelonious, averaged across all 12 directions and polarizations. Eyes show a non-monotonic response.解説: このグラフは、FR1帯(450 MHz~5800 MHz)におけるThelonious(6歳児ファントム)の、組織グループ別の質量平均SAR(12方向・偏波で平均)を正規化値(mW/kg)で示しています。皮膚SARが約3.2倍増加する一方で、脳SARは96%減少しています。眼のSARは単調ではない応答を示しています。
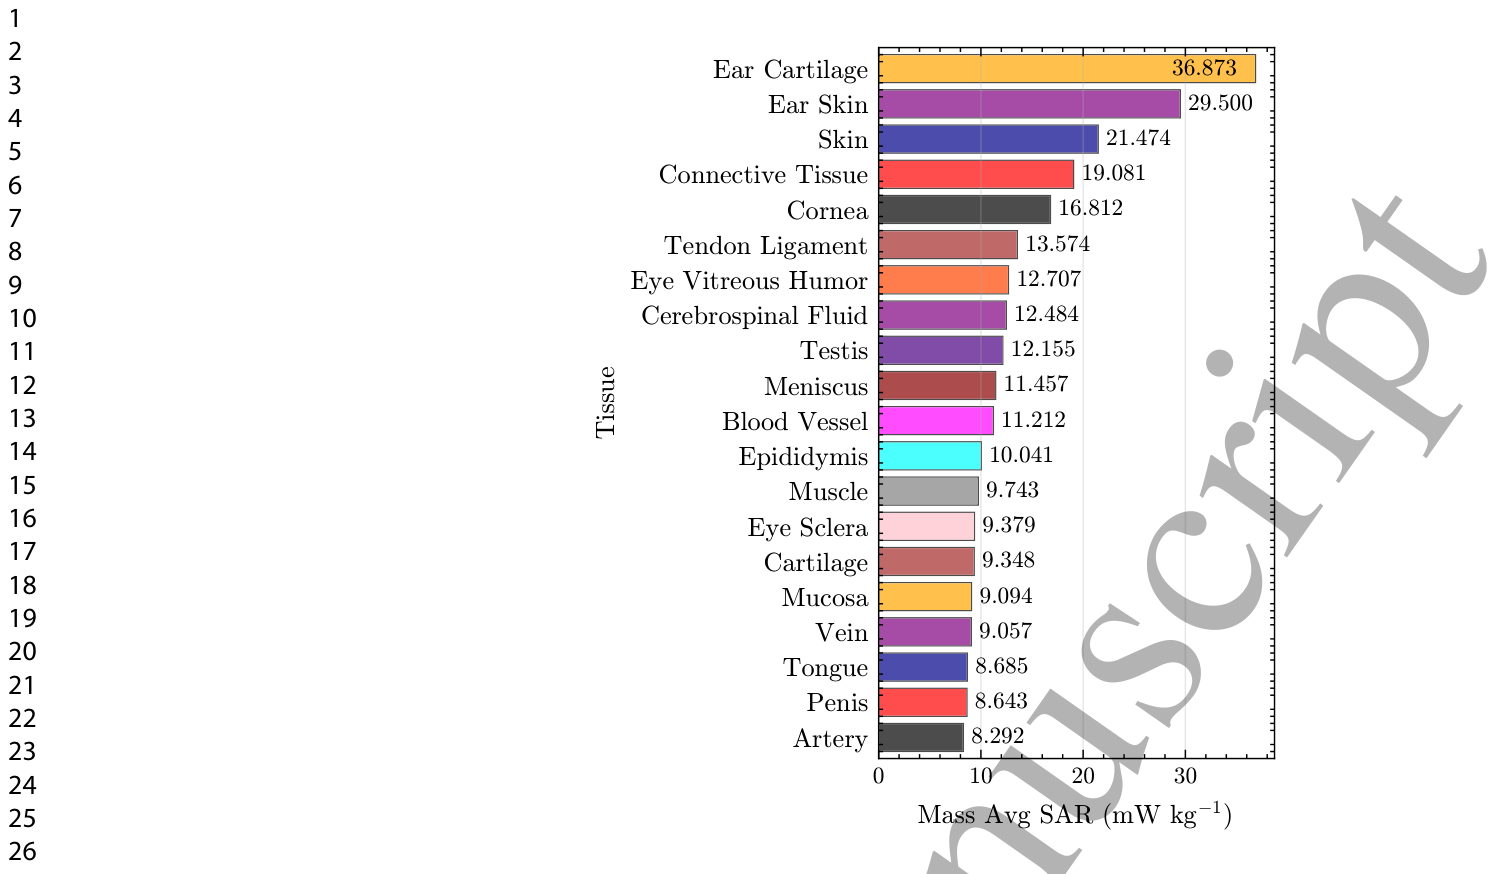
Figure 4. Figure 4: Brain-to-skin SAR ratio across phantoms. Brain exposure drops by orders of magnitude relative to skin as frequency increases. Child phantoms show higher relative brain exposure at high frequencies compared to adults.解説: このグラフは、FR1帯(450 MHz~5800 MHz)における脳SARと皮膚SARの比率を、4つのファントム(大人2体、子供2体)について示しています。周波数が高くなるにつれて、脳曝露は皮膚と比較して桁違いに減少することがわかります。子供のファントムは、高周波数帯においても大人と比較して相対的に高い脳曝露を示しています。
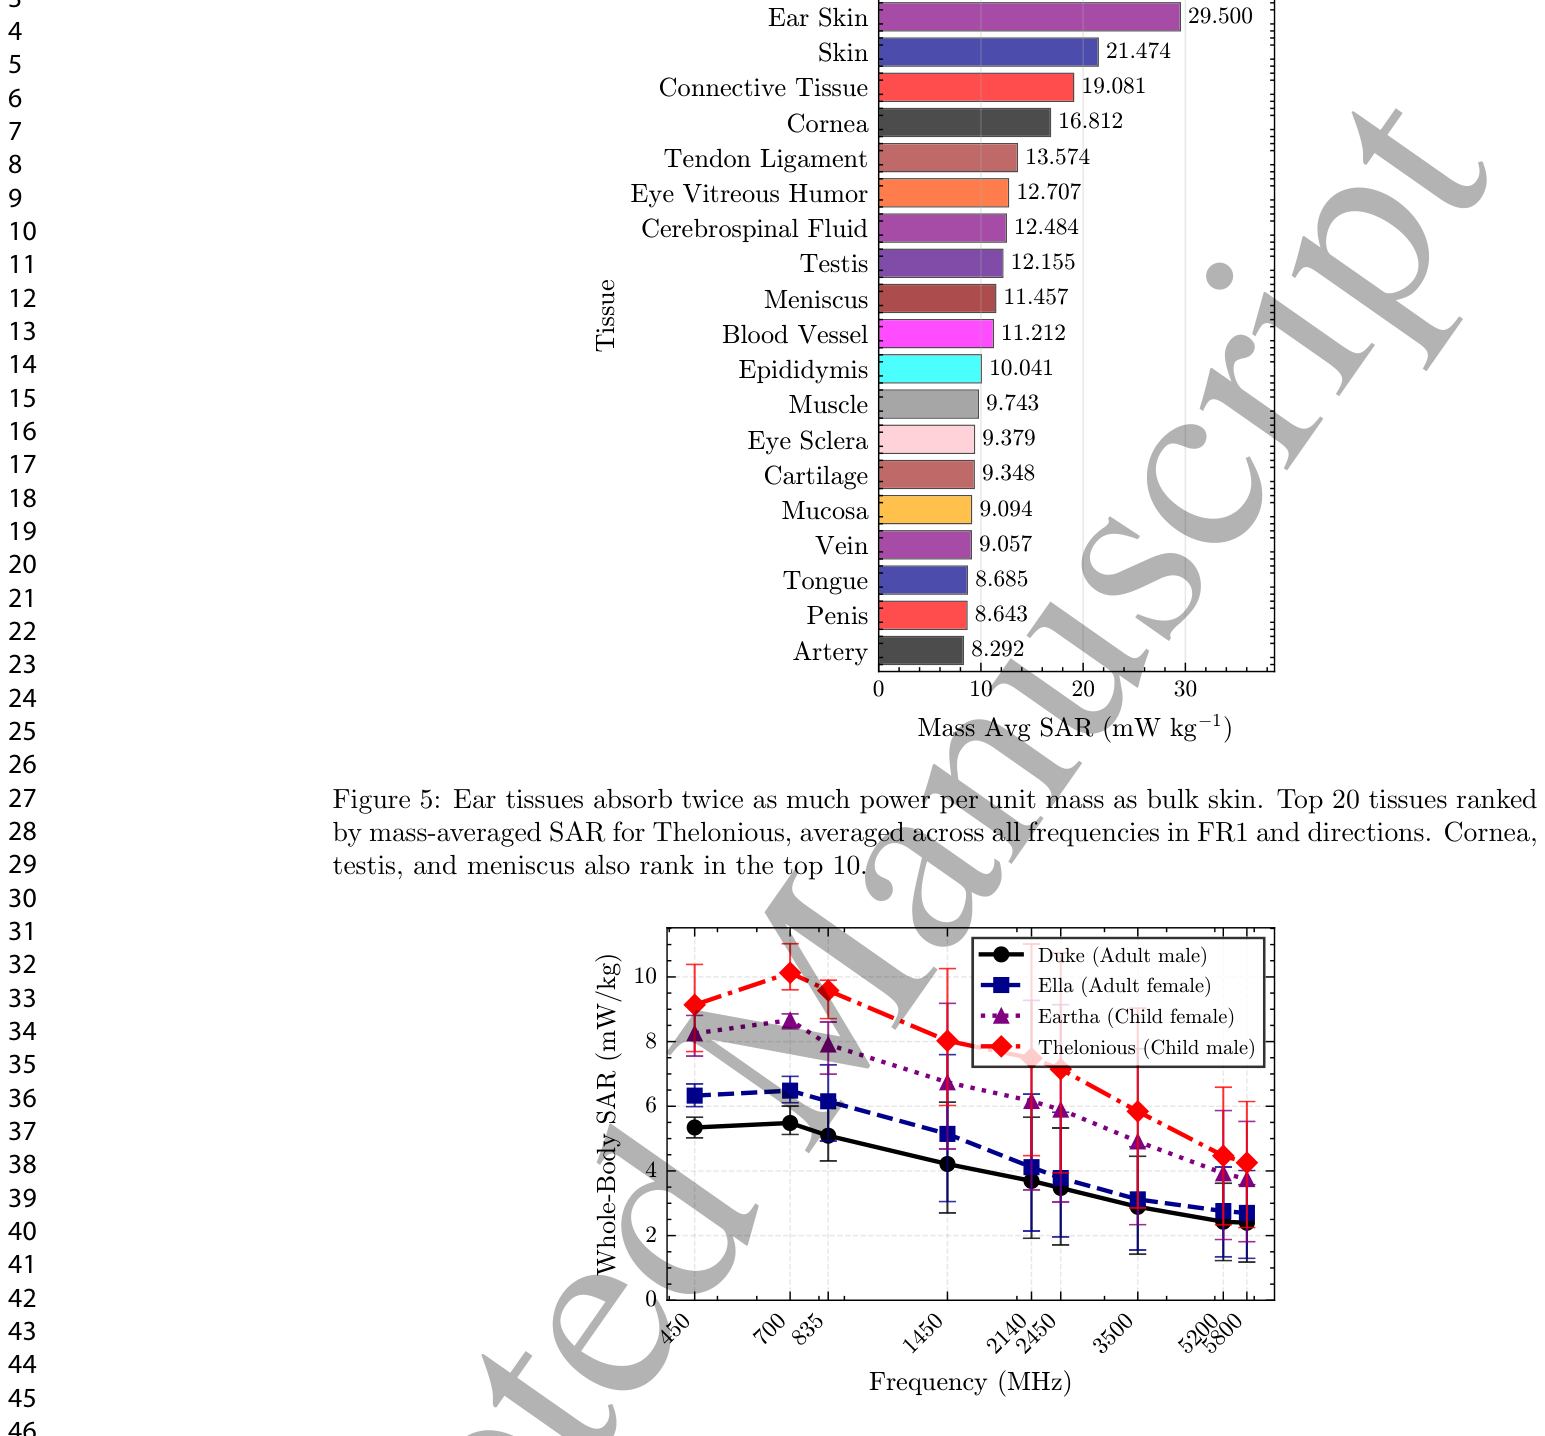
Figure 5. Figure 5: Ear tissues absorb twice as much power per unit mass as bulk skin. Top 20 tissues ranked by mass-averaged SAR for Thelonious, averaged across all frequencies in FR1 and directions. Cornea, testis, and meniscus also rank in the top 10.解説: このグラフは、FR1帯の全周波数と方向で平均された、Theloniousの質量平均SARが最も高い上位20組織をランキング形式で示しています。耳の軟骨はバルク皮膚の2倍以上のパワーを吸収し、角膜、精巣、半月板も上位10位に入っています。
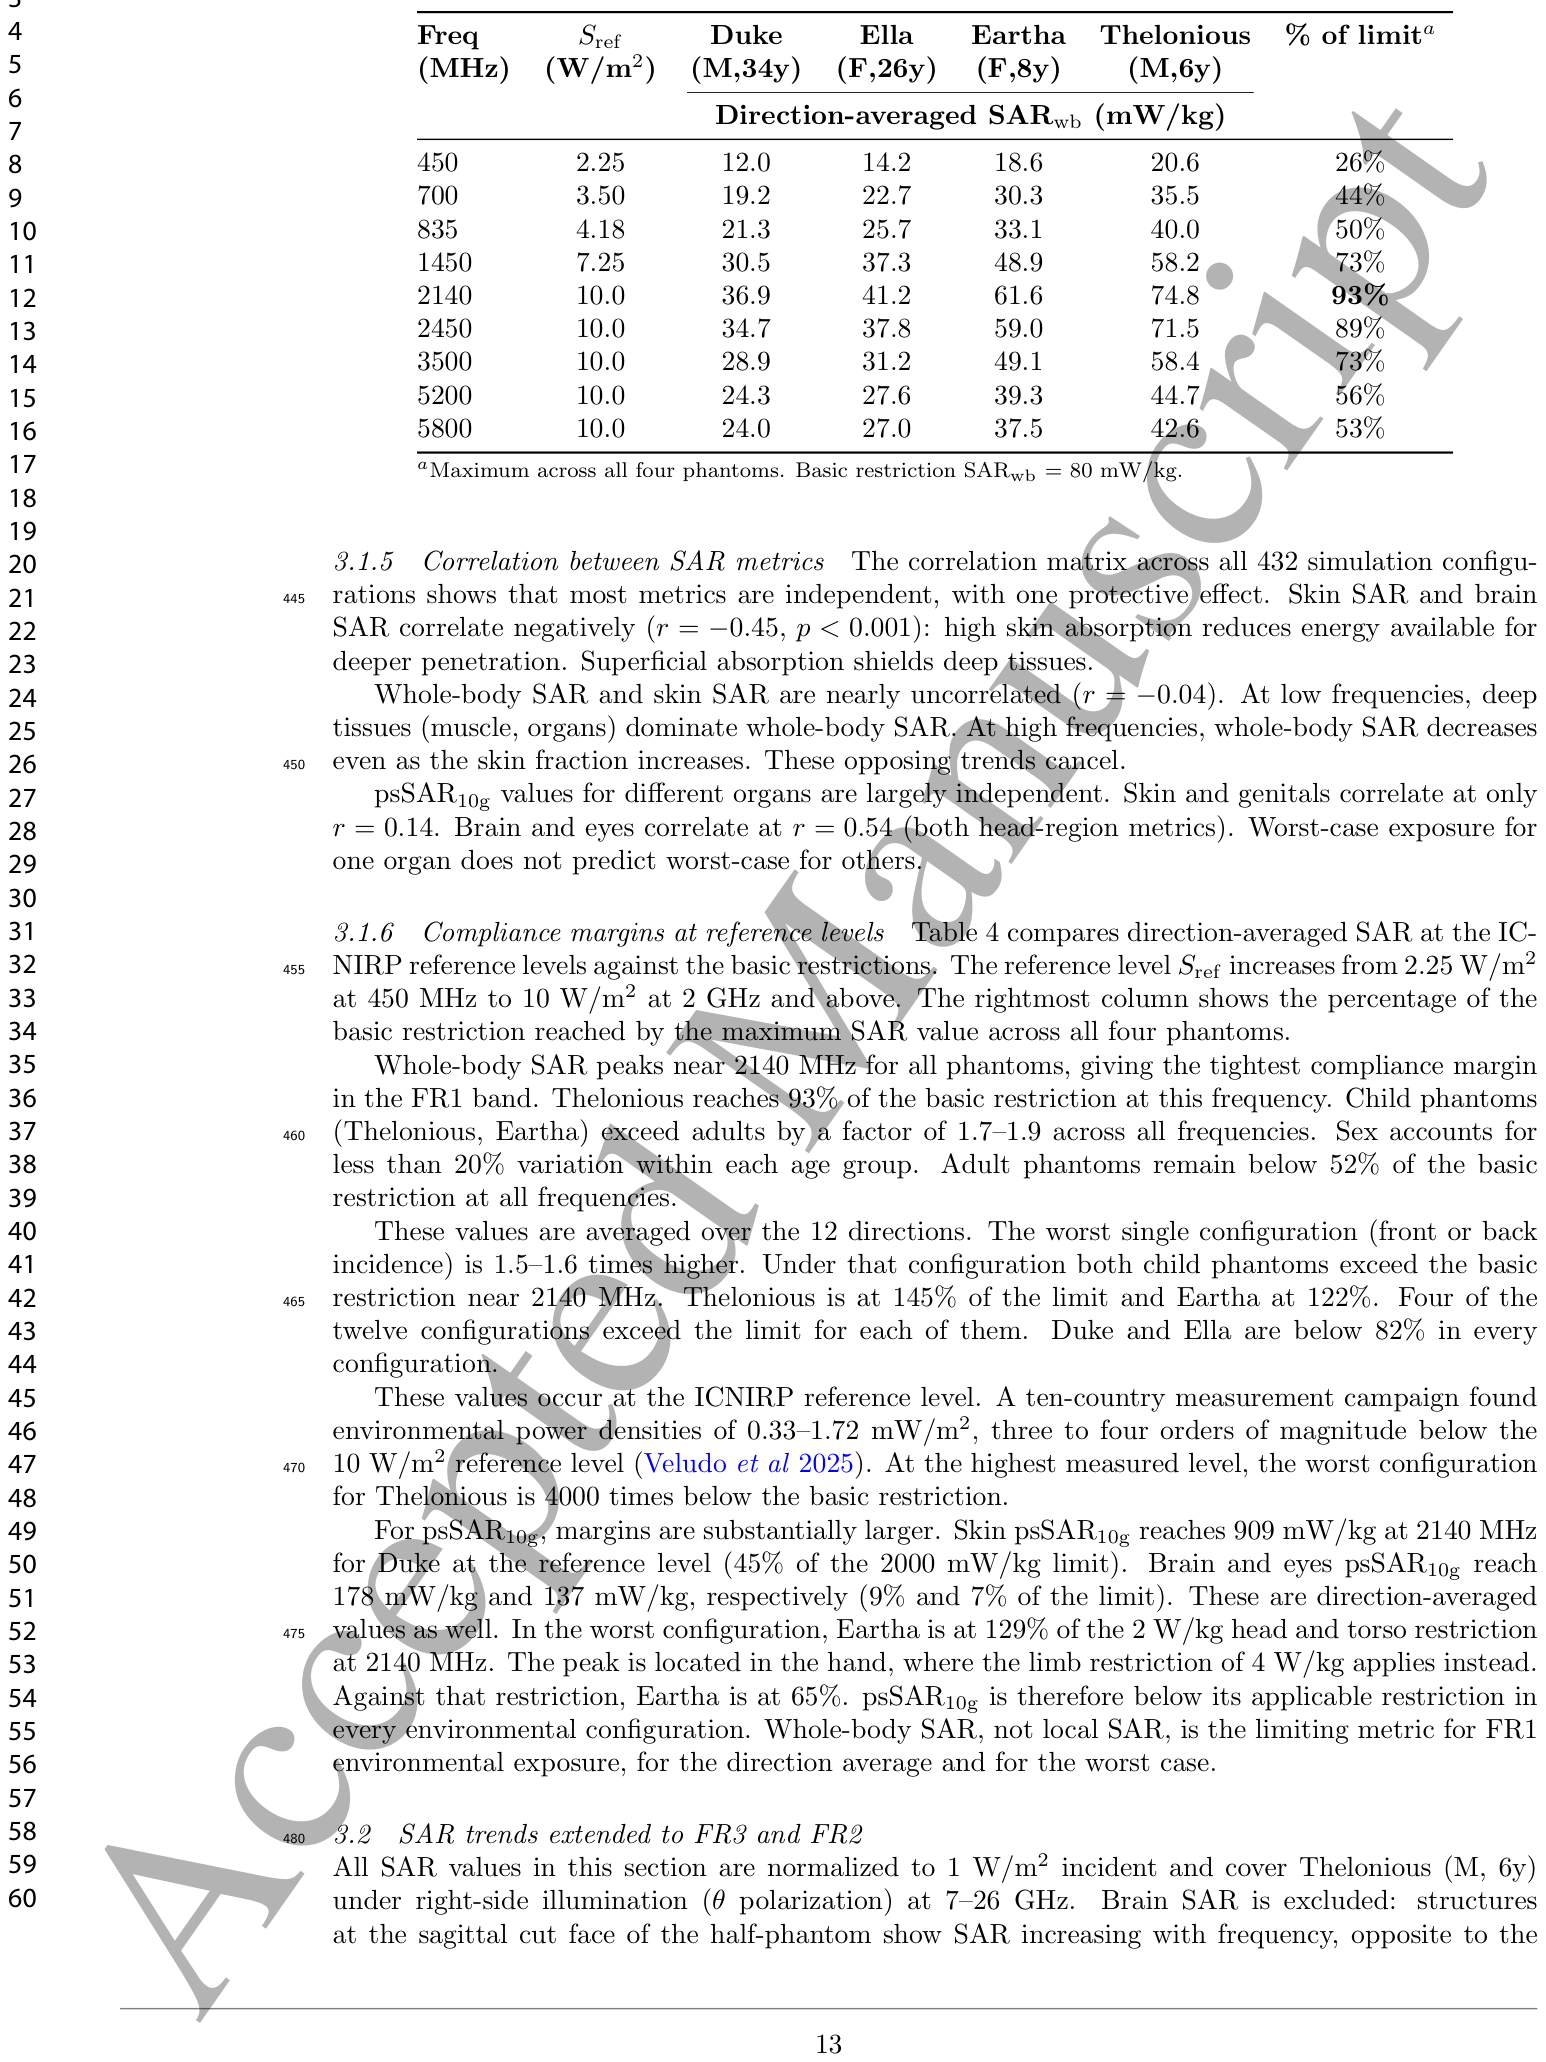
Figure 6. Figure 6: Children show 1.5–1.9 times higher whole-body SAR than adults at all frequencies. Error bars indicate standard deviation across the 12 direction-polarization combinations.解説: このグラフは、FR1帯の全周波数における全身SAR(mW/kg)を、4つのファントム(大人2体、子供2体)について比較しています。エラーバーは、12の方向と偏波の組み合わせにおける標準偏差を示しています。子供のファントムは、大人のファントムと比較して、すべての周波数で全身SARが1.5~1.9倍高いことが示されています。
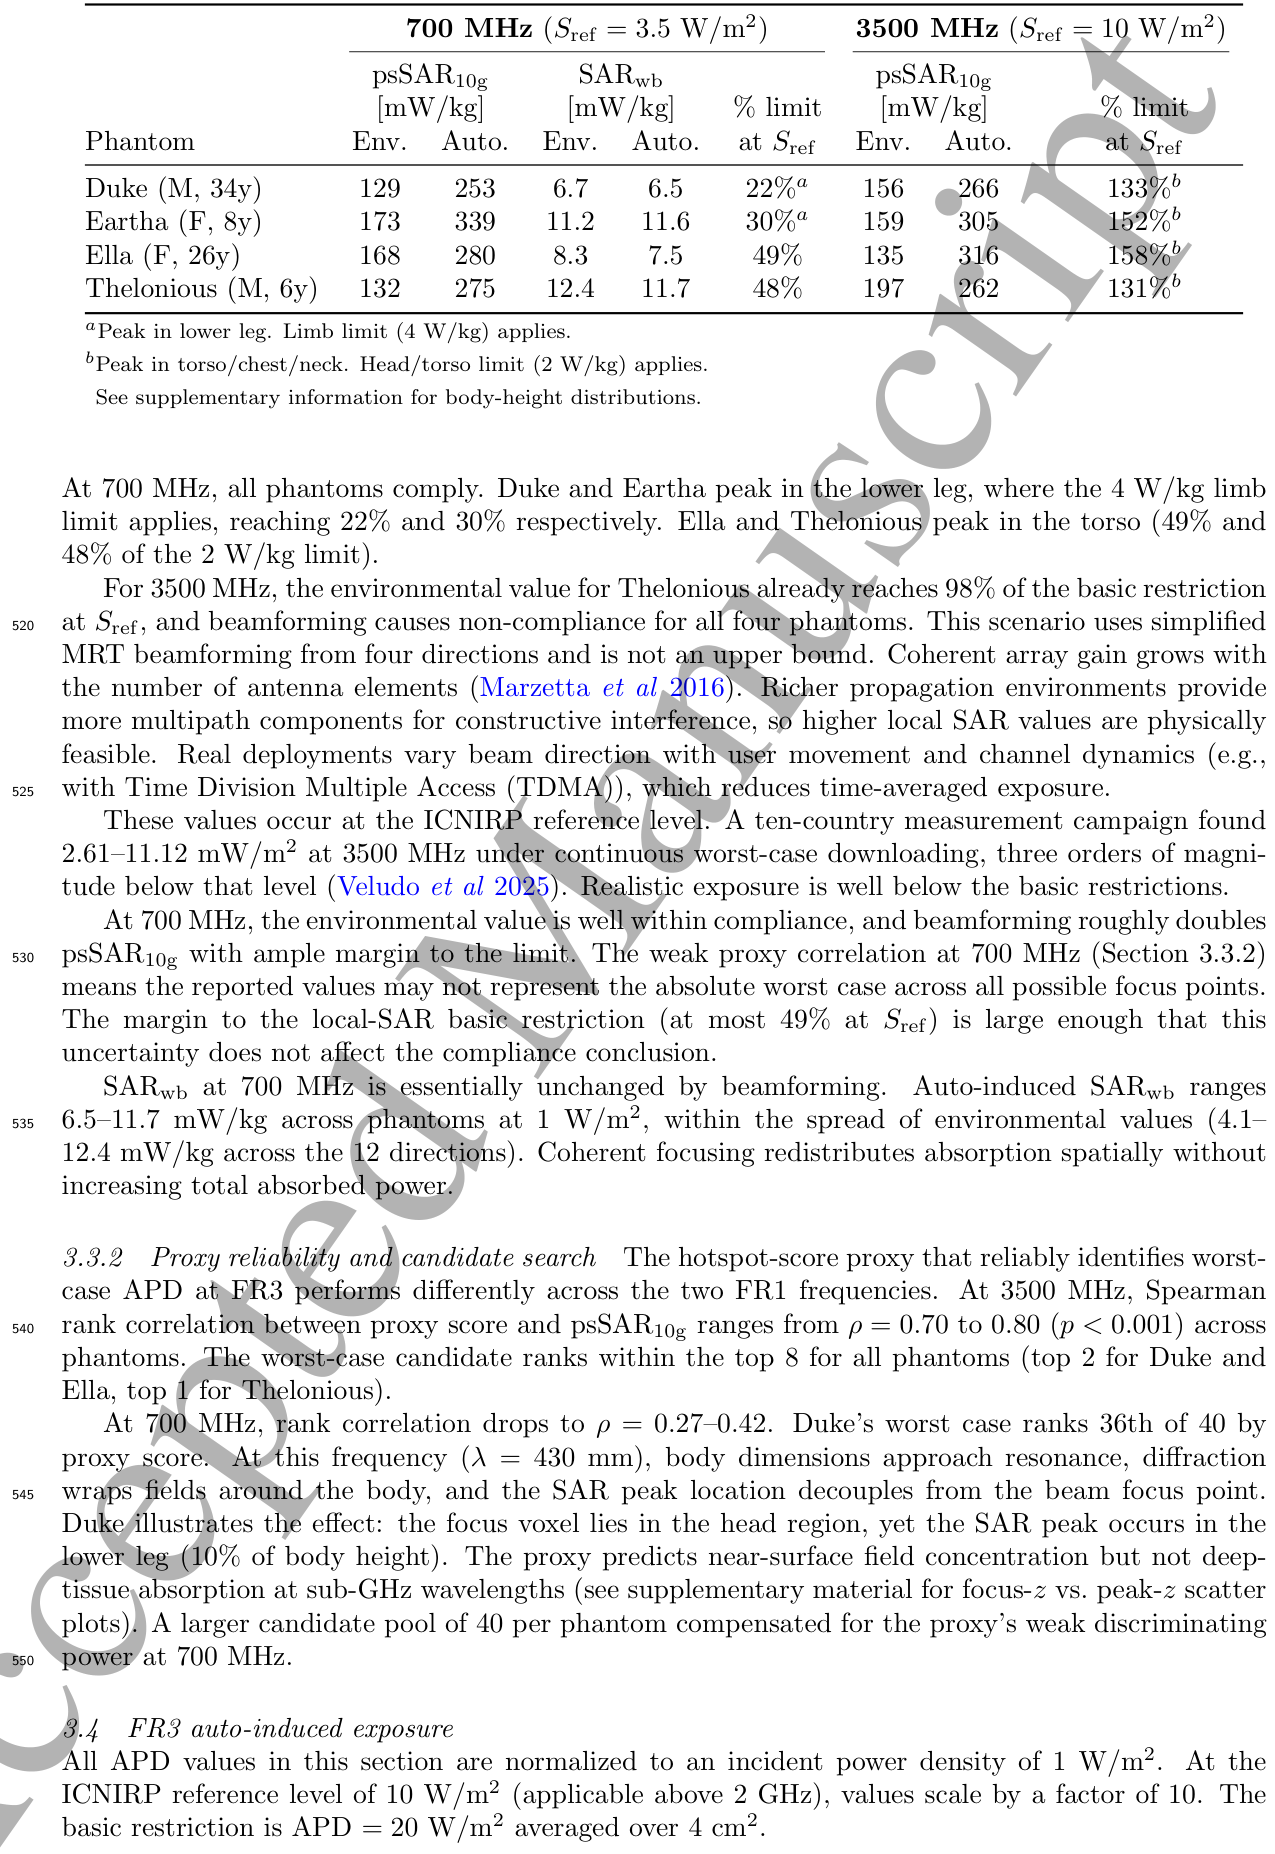
Table 5. Table 5: Auto-induced psSAR10g and SARwb compared to the environmental worst case. All values at 1 W/m2 incident. The % limit column gives psSAR10g as a percentage of the applicable local-SAR basic restriction at Sref.解説: この表は、オートインデュース曝露と環境曝露の最悪ケースにおけるpsSAR10gと全身SAR(SARwb)を比較したものです。すべての値は1 W/m²入射で正規化されています。3500 MHzでは、オートインデュースpsSAR10gが参照レベル(10 W/m²)において、すべてのファントムで頭部/体幹の2 W/kg制限値を131~158%超過することが示されています。
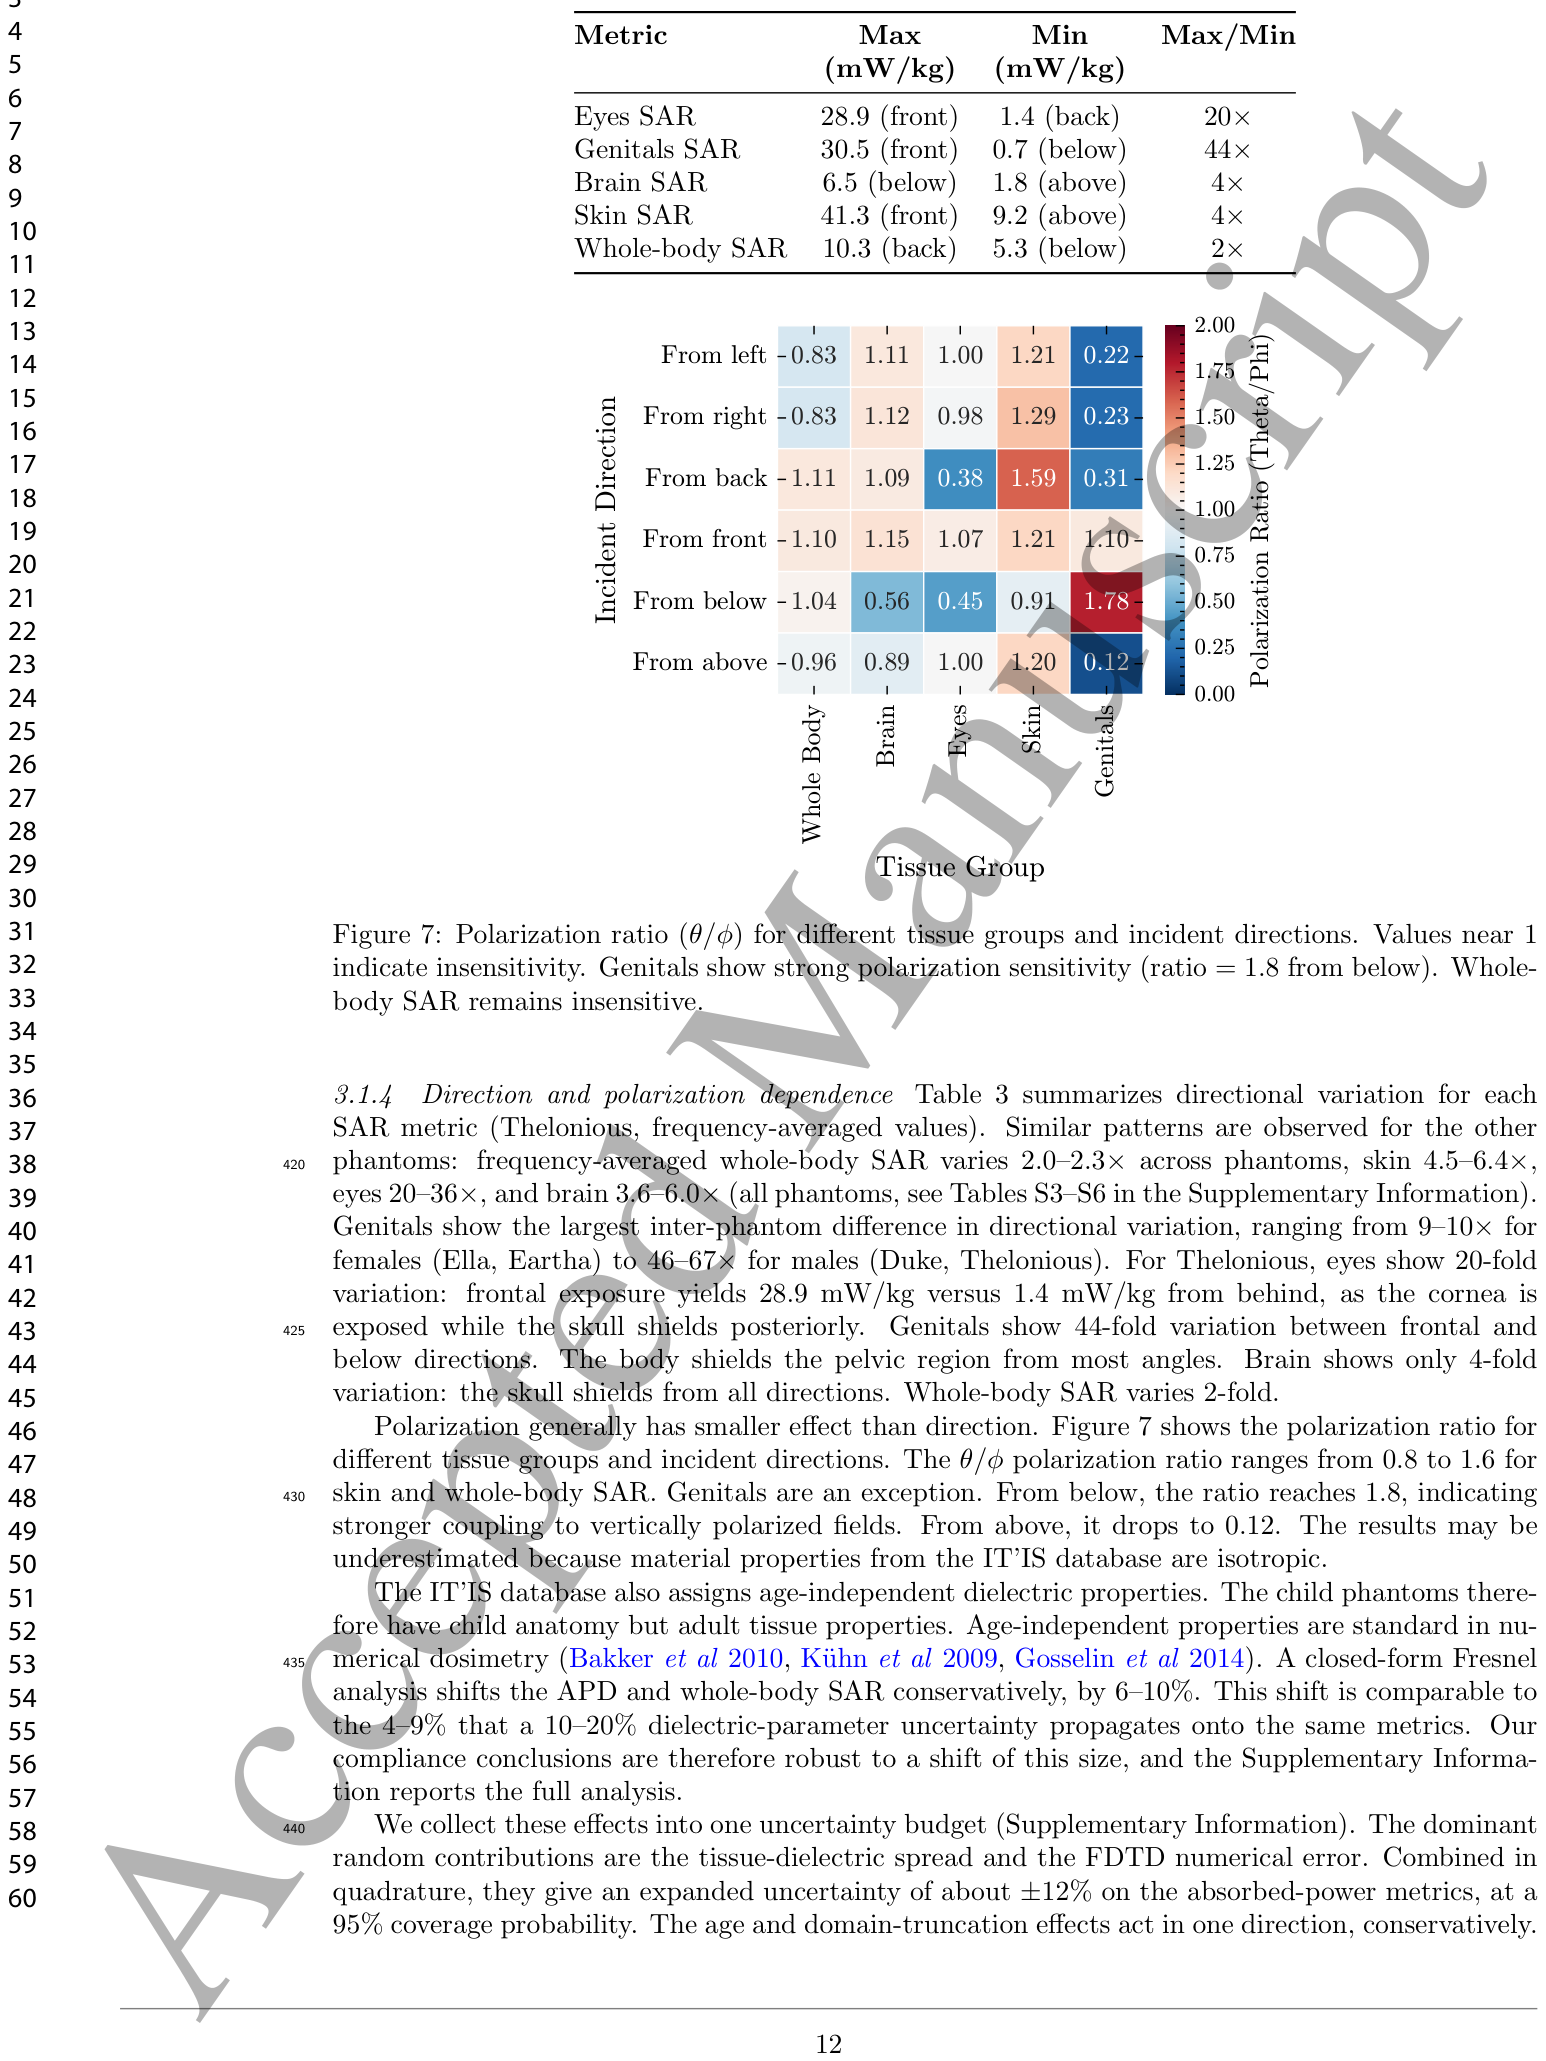
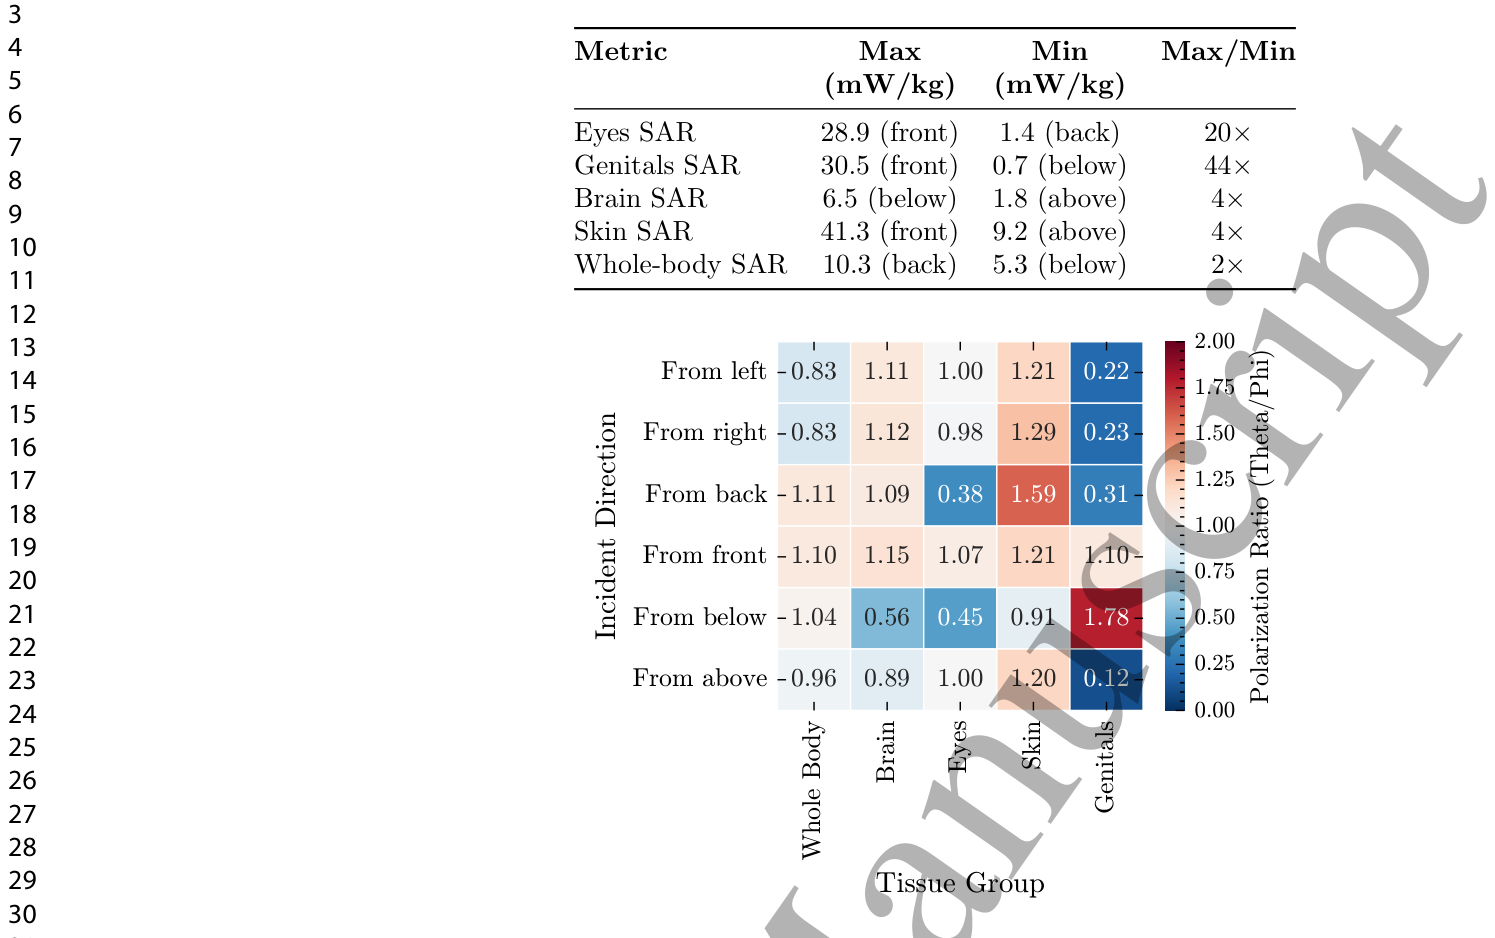
Figure 7. Figure 7: Polarization ratio (θ/ϕ) for different tissue groups and incident directions. Values near 1 indicate insensitivity. Genitals show strong polarization sensitivity (ratio = 1.8 from below). Whole- body SAR remains insensitive.解説: この図は、異なる組織グループと入射方向における偏波比(θ/φ)を示しています。比率が1に近い値は、偏波に影響されにくいことを示します。生殖器は偏波に強い感度を示し、下方からの入射では比率が1.8に達しています。一方で、全身SARは偏波の影響を受けにくいことが示されています。
Figure 8
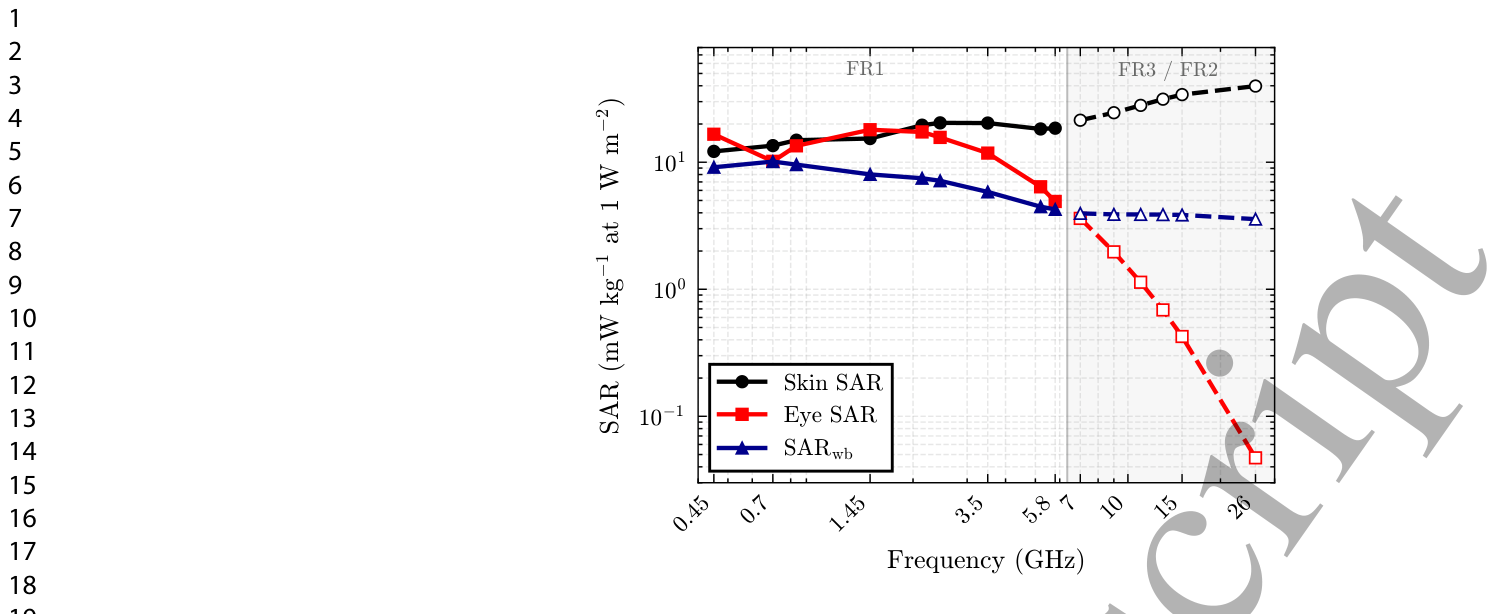
Figure 8. Figure 8: Eye SAR collapses 77-fold from 7 to 26 GHz as penetration depth falls below eyelid thickness. Skin SAR rises through the full band. Mass-averaged SAR for Thelonious. Solid lines: FR1. Dashed lines: FR3 and FR2. Skin and eye SAR: right-side illumination throughout. Whole- body SAR: FR1 solid = 12-direction isotropic average, FR3/FR2 dashed = single right-side direction. Brain and genitals SAR are excluded due to PML boundary artifacts in the FR3 half-phantom.
Figure 9
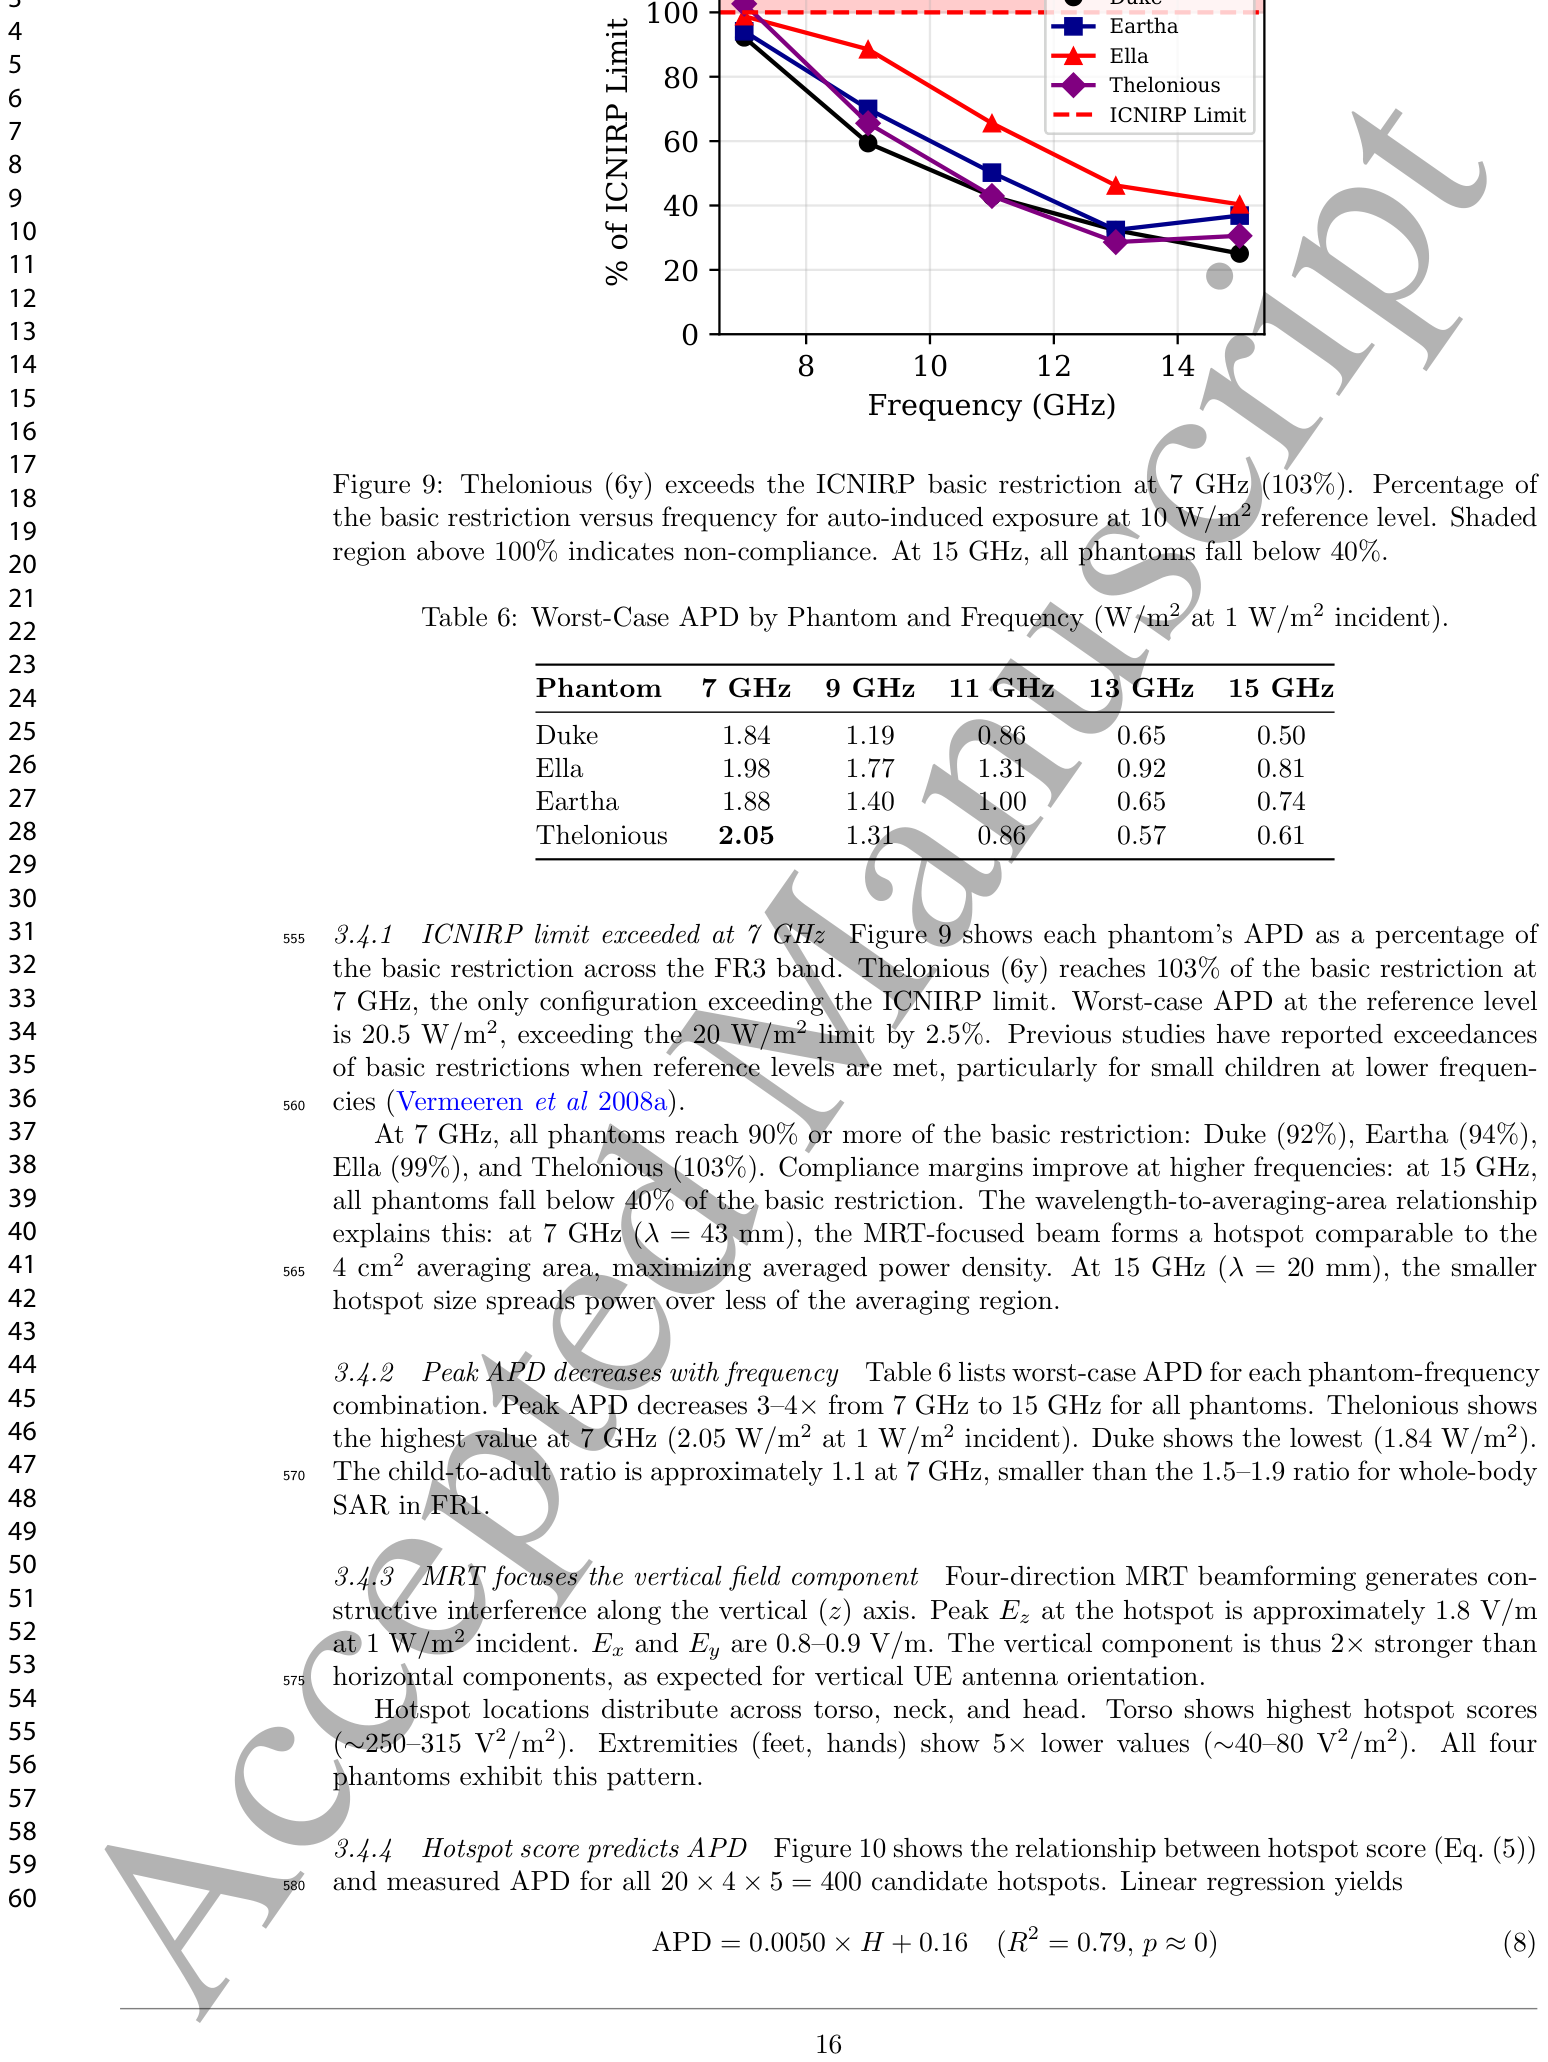
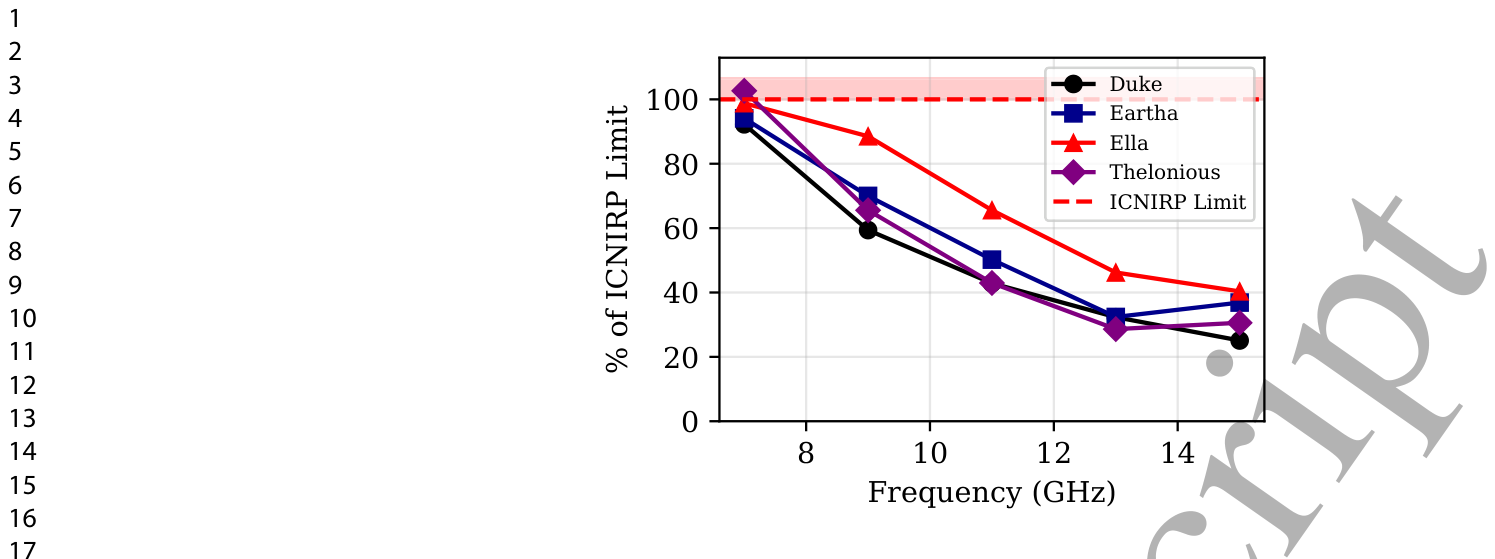
Figure 9. Figure 9: Thelonious (6y) exceeds the ICNIRP basic restriction at 7 GHz (103%). Percentage of the basic restriction versus frequency for auto-induced exposure at 10 W/m2 reference level. Shaded region above 100% indicates non-compliance. At 15 GHz, all phantoms fall below 40%.
Figure 10
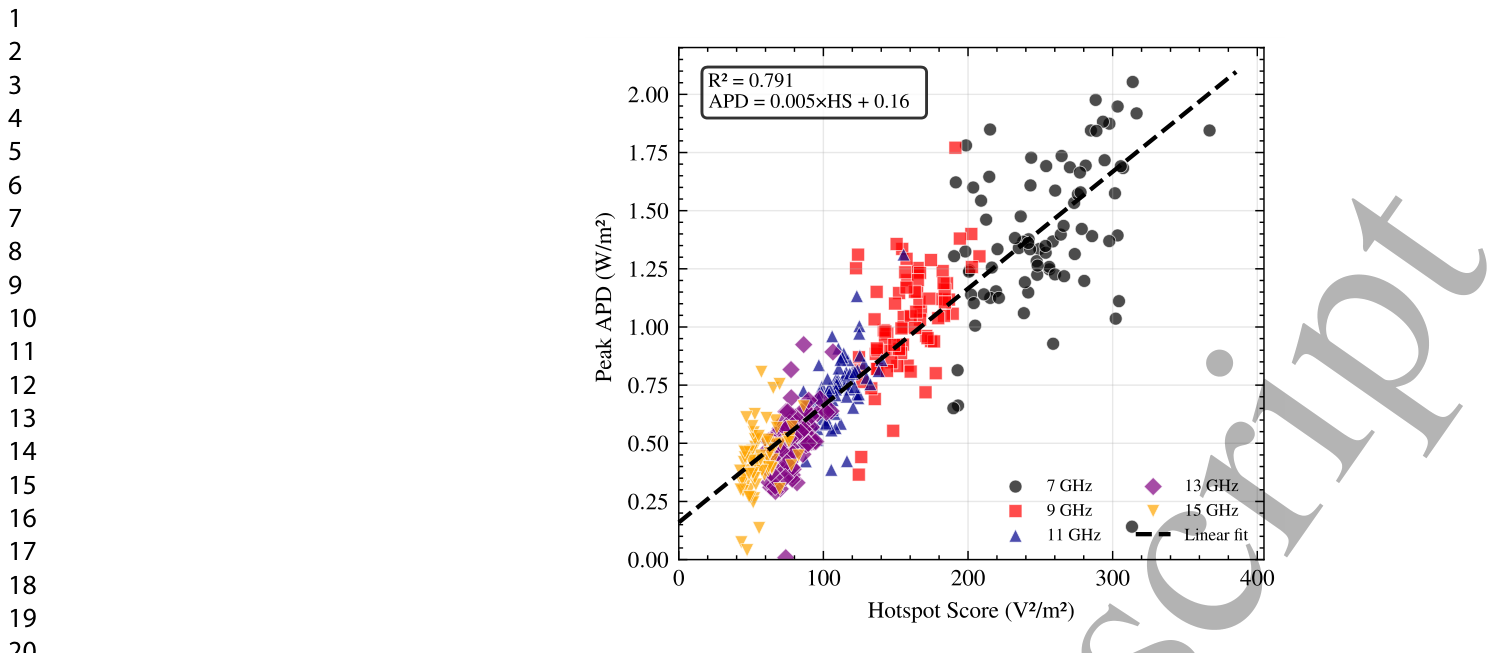
Figure 10. Figure 10: Hotspot score predicts actual APD (R2 = 0.79). Points colored by frequency: 7 GHz candidates (black) cluster at high hotspot score and high APD. 15 GHz candidates (orange) cluster at low values.


コメントを残す