どうも、Beyond the Pixelです。心臓の健康を脅かす冠動脈疾患(CAD)は、その進行をいかに早期に、そして正確に評価するかが重要です。これまで、冠動脈の狭窄度や心筋虚血の有無が主要な評価指標とされてきましたが、最新の研究では、血管内のプラーク(動脈硬化巣)の量と心臓への血流状態が、時間とともにどのように変化するかが注目されています。本日は、この重要なテーマに関する最新のオープンアクセス論文をご紹介します。この研究は、冠動脈のプラーク量と心筋への血流(虚血)が、将来の心血管イベントに時間と共にどのように異なる影響を与えるかを詳細に評価したものです。疑われる冠動脈疾患を持つ対象者において、これらの指標が短期、中期、長期の予後とどのように関連するのかを探りました。
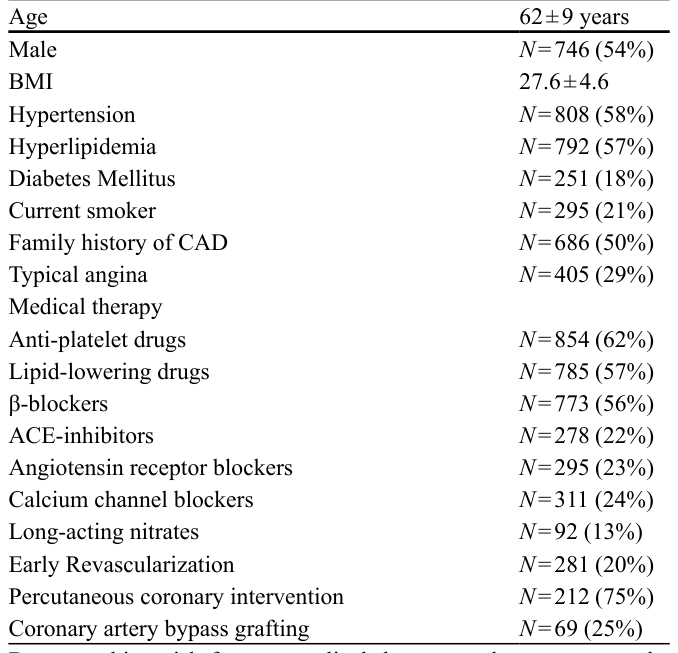
Table 1. Table 1 Baseline characteristics (N = 1385) Age 62 ± 9 years Male N = 746 (54%) BMI 27.6 ± 4.6 Hypertension N = 808 (58%) Hyperlipidemia N = 792 (57%) Diabetes Mellitus N = 251 (18%) Current smoker N = 295 (21%) Family history of CAD N = 686 (50%) Typical angina N = 405 (29%) Medical therapy Anti-platelet drugs N = 854 (62%) Lipid-lowering drugs N = 785 (57%) β-blockers N = 773 (56%) ACE-inhibitors N = 278 (22%) Angiotensin receptor blockers N = 295 (23%) Calcium channel blockers N = 311 (24%) Long-acting nitrates N = 92 (13%) Early Revascularization N = 281 (20%) Percutaneous coronary intervention N = 212 (75%) Coronary artery bypass grafting N = 69 (25%) Demographics, risk factors, medical therapy, and symptoms at the time of scan; early revascularization within 6 months following the scan. Percentages are calculated based on available data; denomina tors vary due to missing values. Data are mean ± SD or n (%).Abbre viations: ACE Angiotensin-converting enzyme; ARB Angiotensin receptor blocker; BMI Body mass index; CABG Coronary artery bypass grafting; CAD Coronary artery disease; PCI Percutaneous coronary intervention解説: この表は、研究に参加した対象者(N=1385)のベースライン特性を示しています。年齢、性別、BMI、高血圧、糖尿病などの危険因子や、画像診断時の薬物治療、早期血行再建術の実施状況などが報告されています。
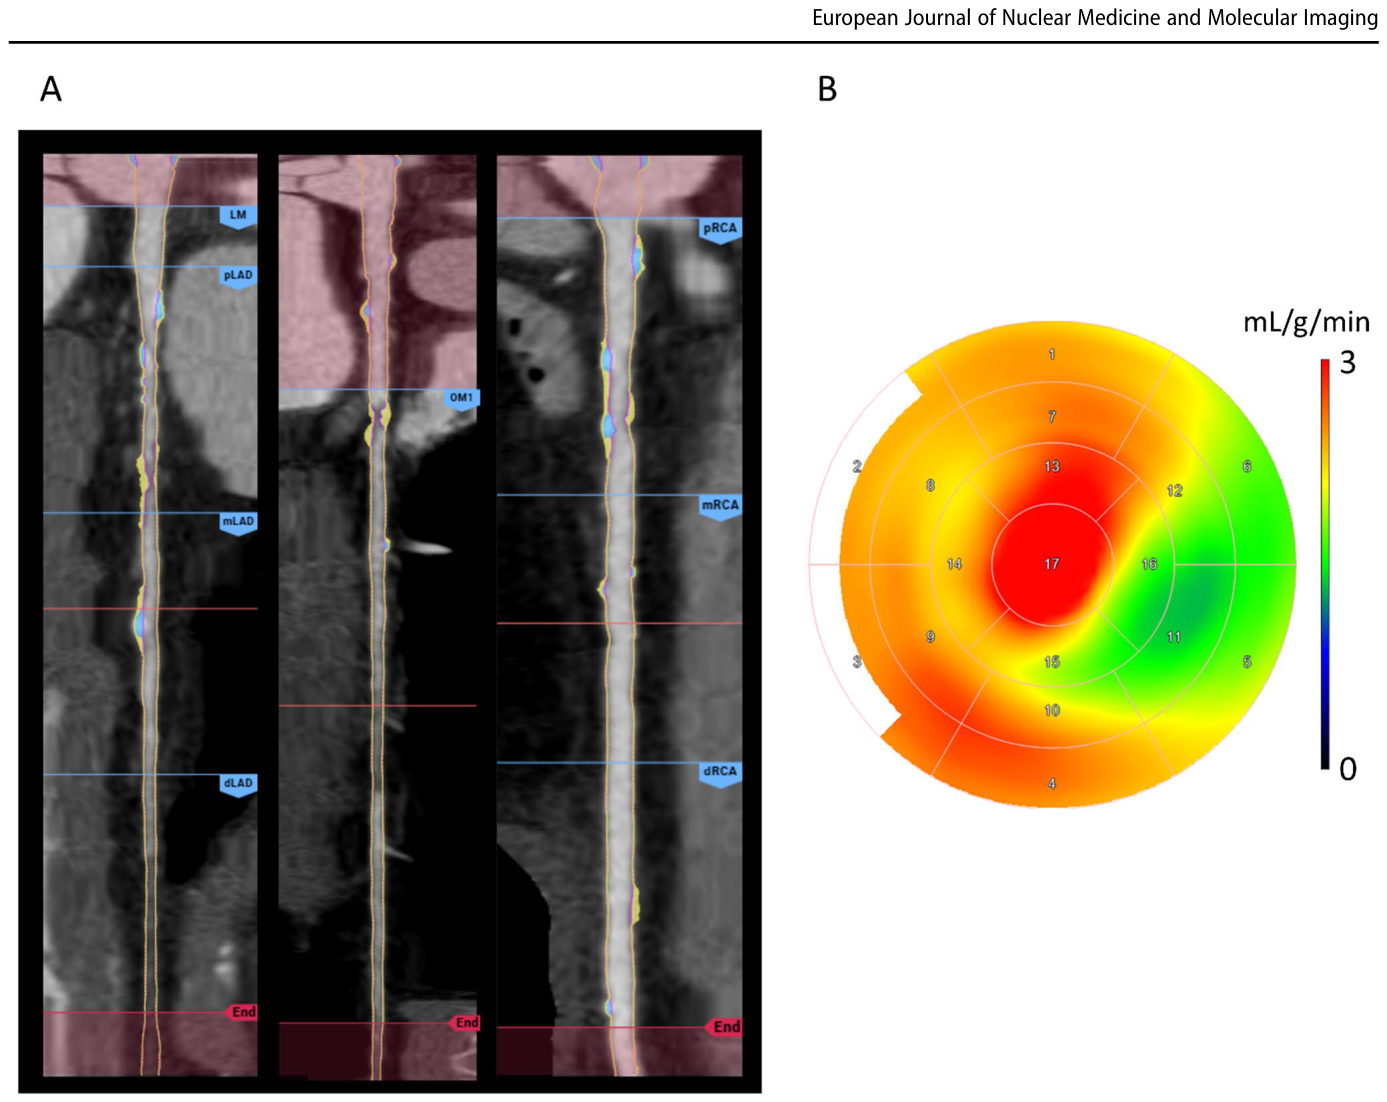
Figure 1. Fig. 1 Case example. An example of quantitative AI-QCT analysis of CCTA and quantitative [15O]H₂O PET MPI in the same patient. A Quantitative AI-QCT plaque analysis showing non-calcified (yel low) and calcified (blue) atherosclerotic plaque in the LAD, in the OM branch of the LCx, and in the RCA. The TPV is 340 mm3, correspond ing to a per-patient PAV of 10.9% (Stage 2 PAV) when normalized by the individual vessel volume of 3128 mm3. B hMBF by PET MPI is presented according to the standard 17-segment model, revealing a perfusion defect in the lateral left ventricular wall consistent with解説: この図は、CCTAによるAI-QCTプラーク解析と、[15O]H₂O PET MPIによる定量的hMBF評価の例を示しています。Aは冠動脈の非石灰化(黄色)および石灰化(青色)アテローム性プラークを、Bは標準17セグメントモデルで示された心筋血流(hMBF)の灌流欠損を示しています。
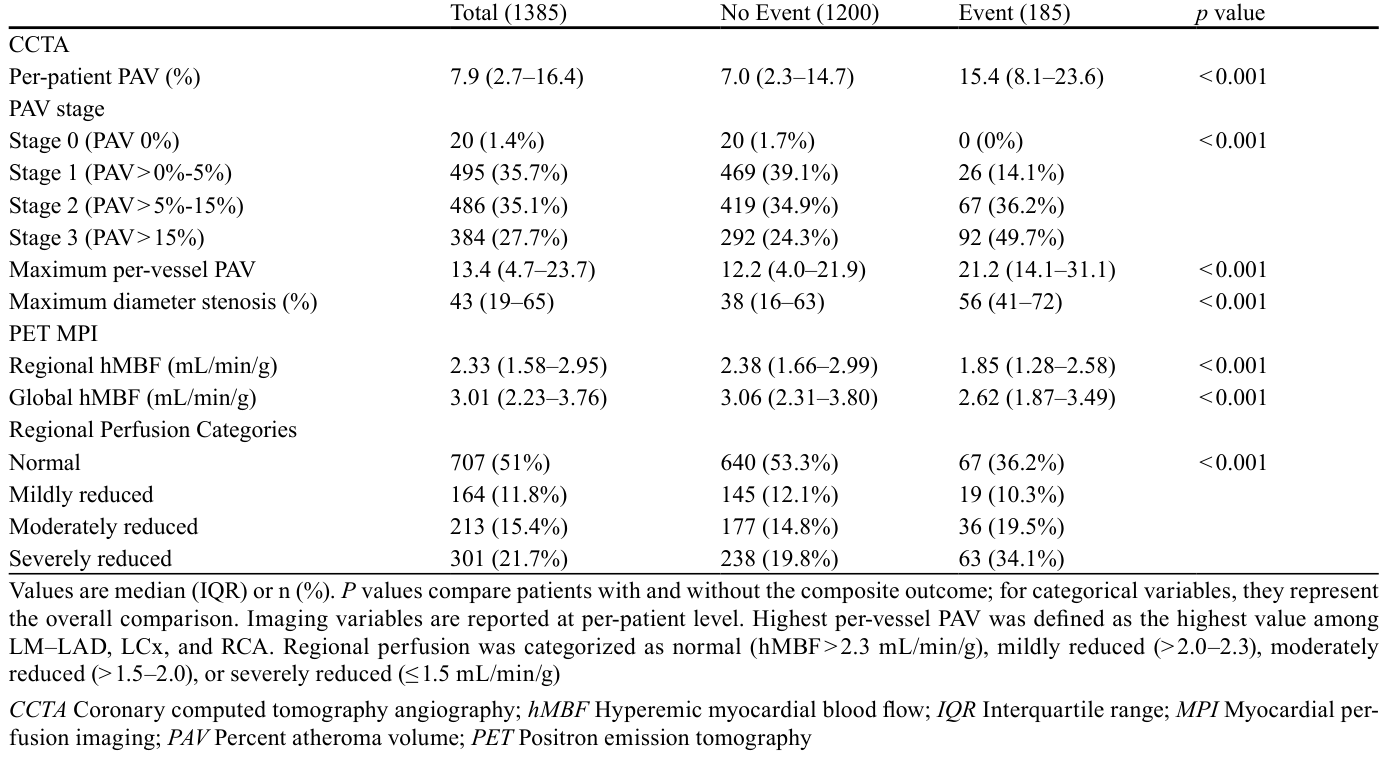
Table 2. Table 2 CCTA and PET MPI findings according to clinical outcome status解説: この表は、臨床アウトカムの有無に応じたCCTAとPET MPIの検査結果を示しています。イベントを経験した対象者では、PAVが有意に高く、地域hMBFが有意に低いことが示されています。
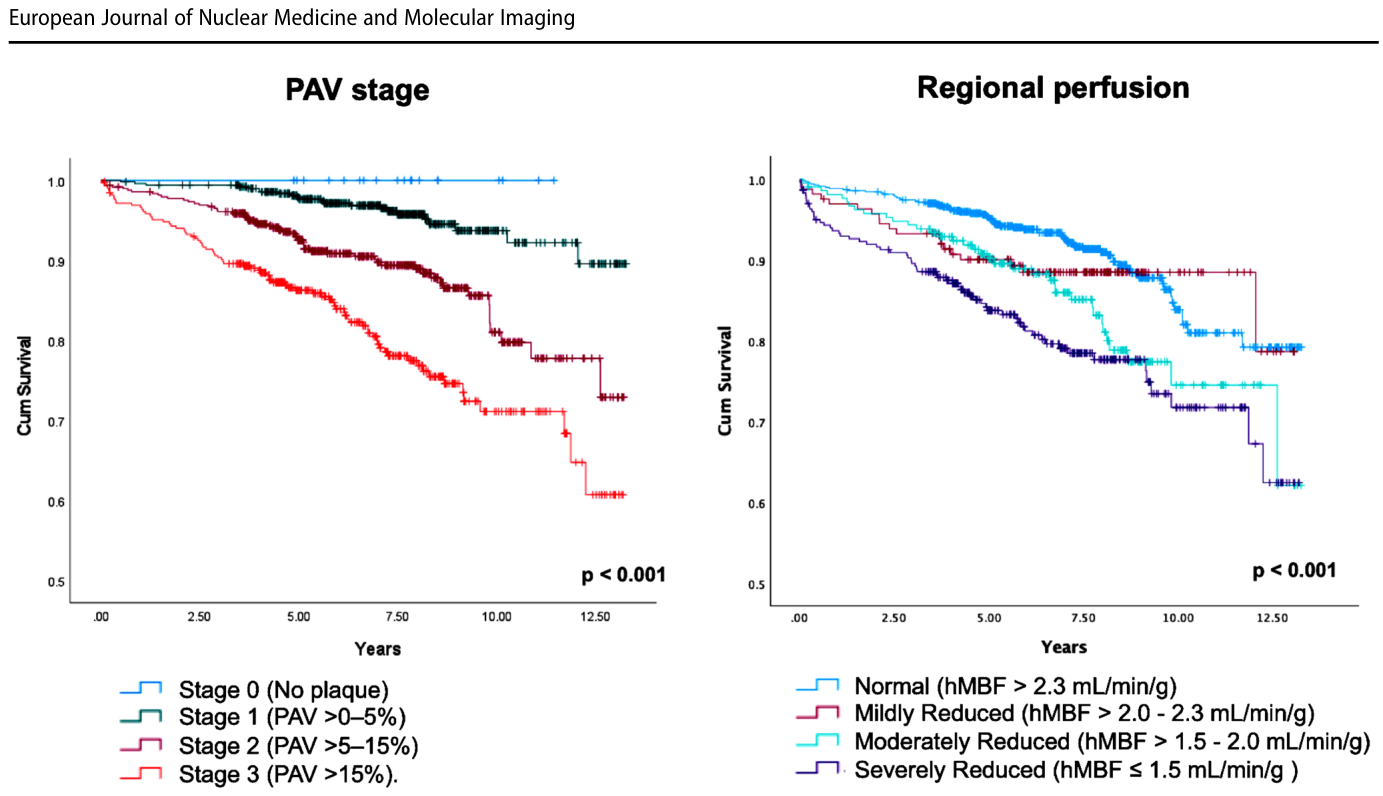
Figure 3. Fig. 3 Kaplan–Meier Curves for the Composite Outcome by PAV Stage and Regional Perfusion Category. Kaplan–Meier curves illus trating survival for the composite outcome (all-cause death, myo cardial infarction, and unstable angina) by PAV stage and the pres ence of regional ischemia. PAV was stratified into four stages: Stage 0 (no plaque), Stage 1 (PAV > 0–5%), Stage 2 (PAV > 5–15%), and解説: PAVステージと地域灌流カテゴリー別の複合アウトカムに対するカプラン・マイヤー曲線を示しています。PAVステージの上昇と地域灌流障害の重症度が増すにつれて、イベントフリー生存率が段階的に低下することを示しています。
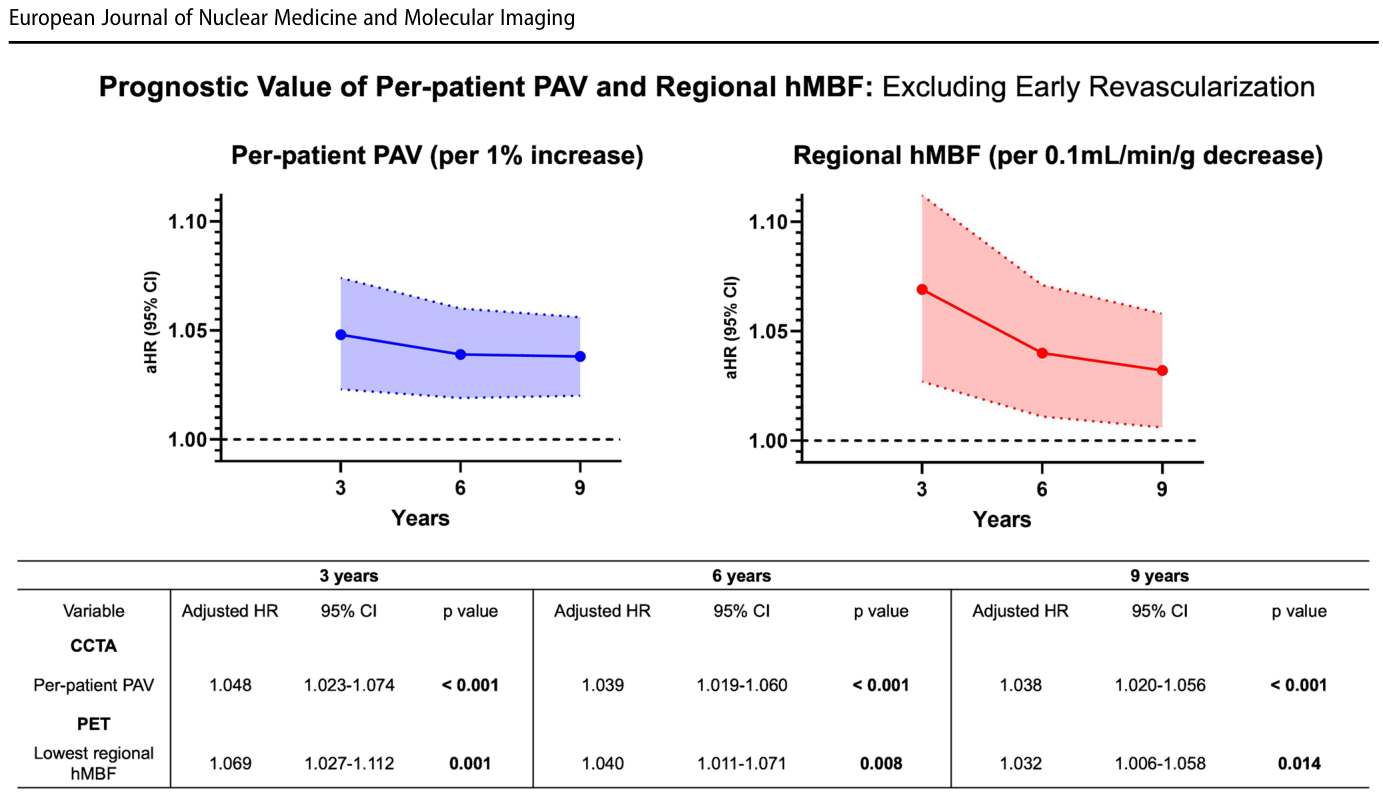
Figure 5. Fig. 5 Combined Model for PAV and Regional hMBF predicting clini cal outcomes in patients without early revascularization (n = 1,104), at different follow-up times. Adjusted hazard ratios with 95% CI for the composite outcome (all-cause death, myocardial infarction, and unstable angina) are shown for PAV (per 1% increase, left panel) and regional hMBF (per 0.1 mL/min/g decrease, right panel) at 3-, 6-, and 9-year follow-up timepoints. Patients who underwent early revascu解説: 早期血行再建術を受けなかった対象者(n=1,104)におけるPAVと地域hMBFが臨床アウトカムを予測する複合モデルを示しています。心血管危険因子で調整されたハザード比(95%信頼区間)が、3年、6年、9年の追跡時点についてPAV(1%増加ごと)と地域hMBF(0.1 mL/min/g減少ごと)で示されています。
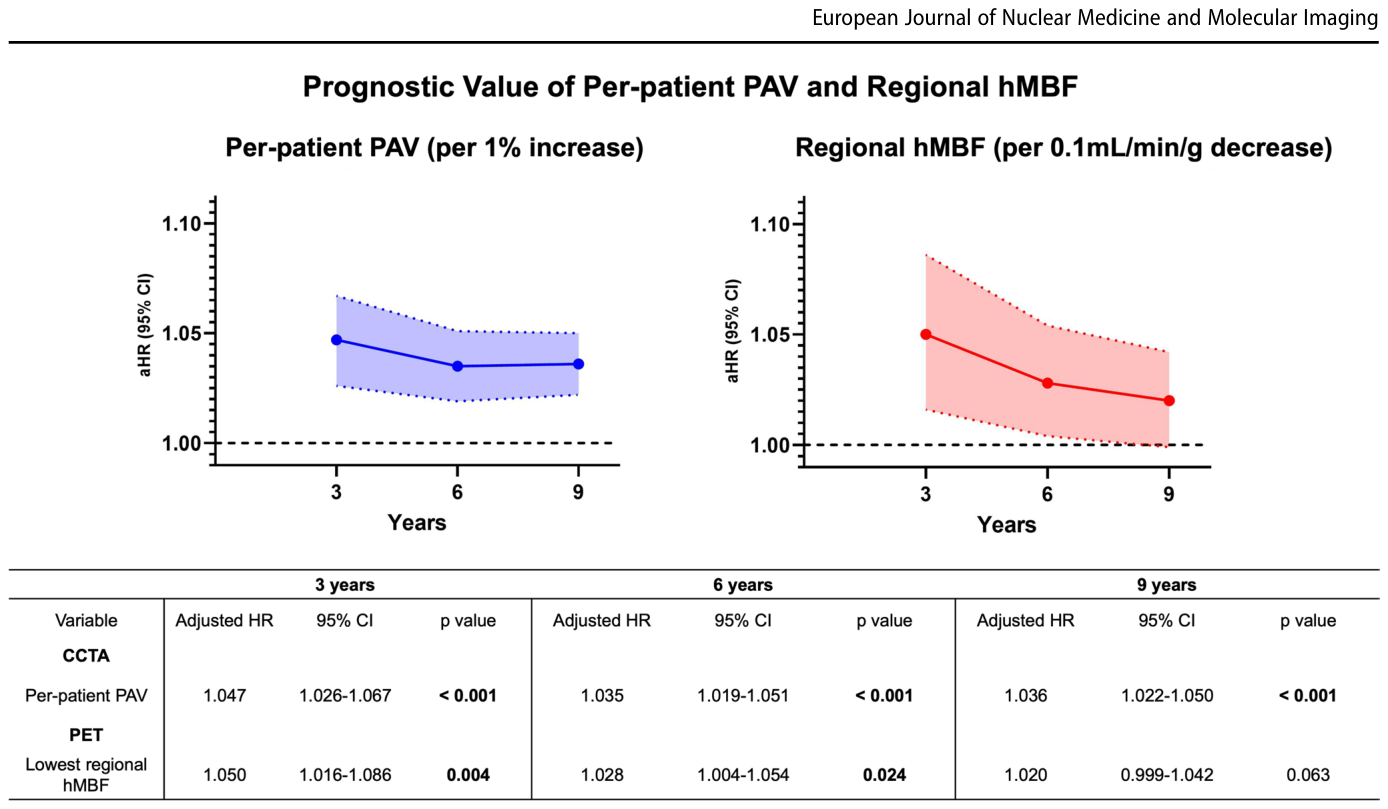
Figure 4. Fig. 4 Combined model for PAV and Regional hMBF predicting clini cal outcomes at different follow-up times. Adjusted hazard ratios with 95% CI for the composite outcome (all cause death, myocardial infarc tion and unstable angina) are shown for PAV (per 1% increase, left panel) and regional hMBF (per 0.1 mL/min/g decrease, right panel) at 3-, 6-, and 9-year follow-up timepoints. Both imaging variables were解説: 異なる追跡期間におけるPAVと地域hMBFが臨床アウトカムを予測する複合モデルを示しています。心血管危険因子と早期血行再建で調整されたハザード比(95%信頼区間)が、3年、6年、9年の追跡時点についてPAV(1%増加ごと)と地域hMBF(0.1 mL/min/g減少ごと)で示されています。


コメントを残す