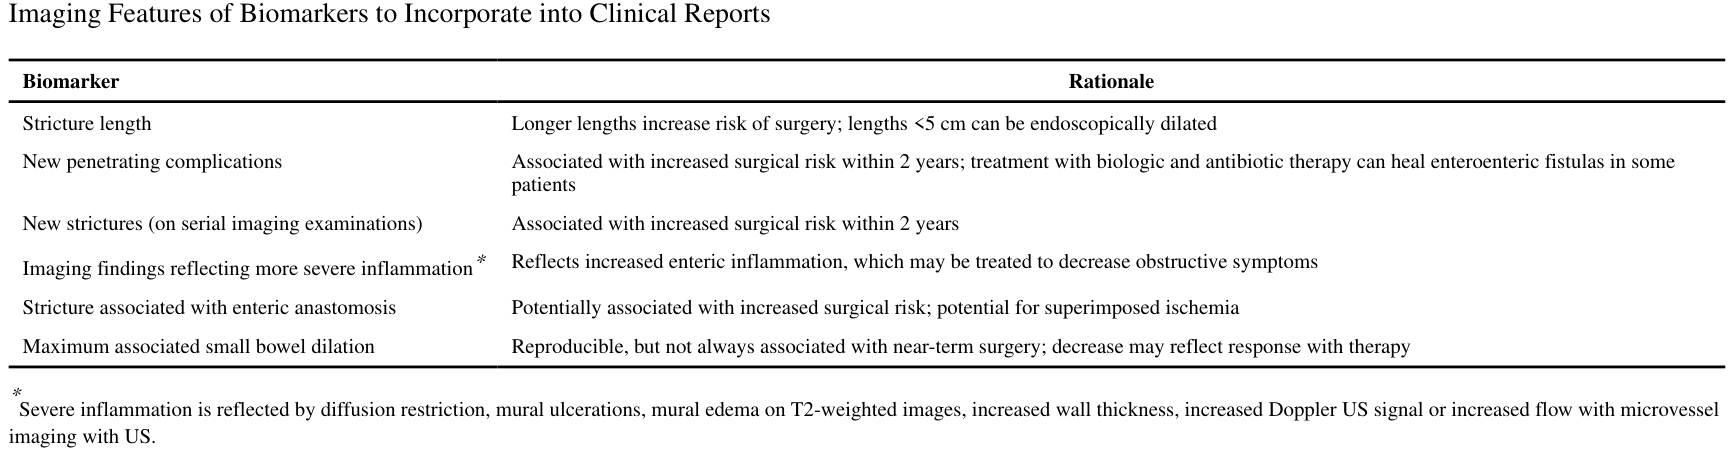
どうも、Beyond the Pixelです。クローン病(CD)は、消化管のどの部位にも影響を及ぼし得る慢性の炎症性腸疾患です。その中でも特に、小腸に発生する狭窄(腸管の内腔が狭くなる病変)は、緊急医療や入院、外科的介入、そして長期的な腸管損傷や身体機能の障害につながる重要な合併症として知られています。約40%のクローン病対象者が狭窄を発症し、最終的には80%が手術を必要とすると報告されています。内視鏡検査では到達が困難な場合が多く、腸管壁深部や周囲の組織を評価できないため、画像診断がその診断、評価、モニタリングにおいて極めて重要な役割を担っています。本記事では、この困難な狭窄病変をより正確に診断し、治療方針を決定するための「画像バイオマーカー」に焦点を当てた最新の研究について深掘りしていきます。
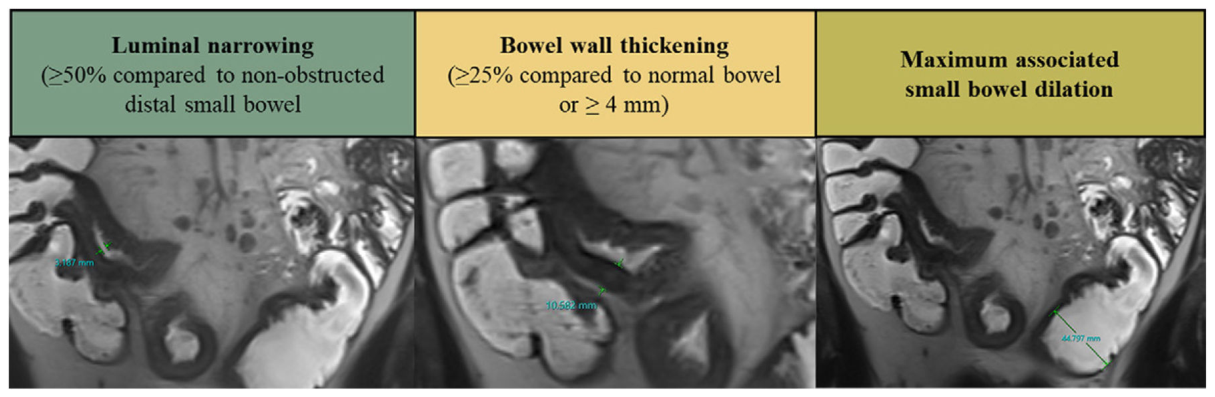
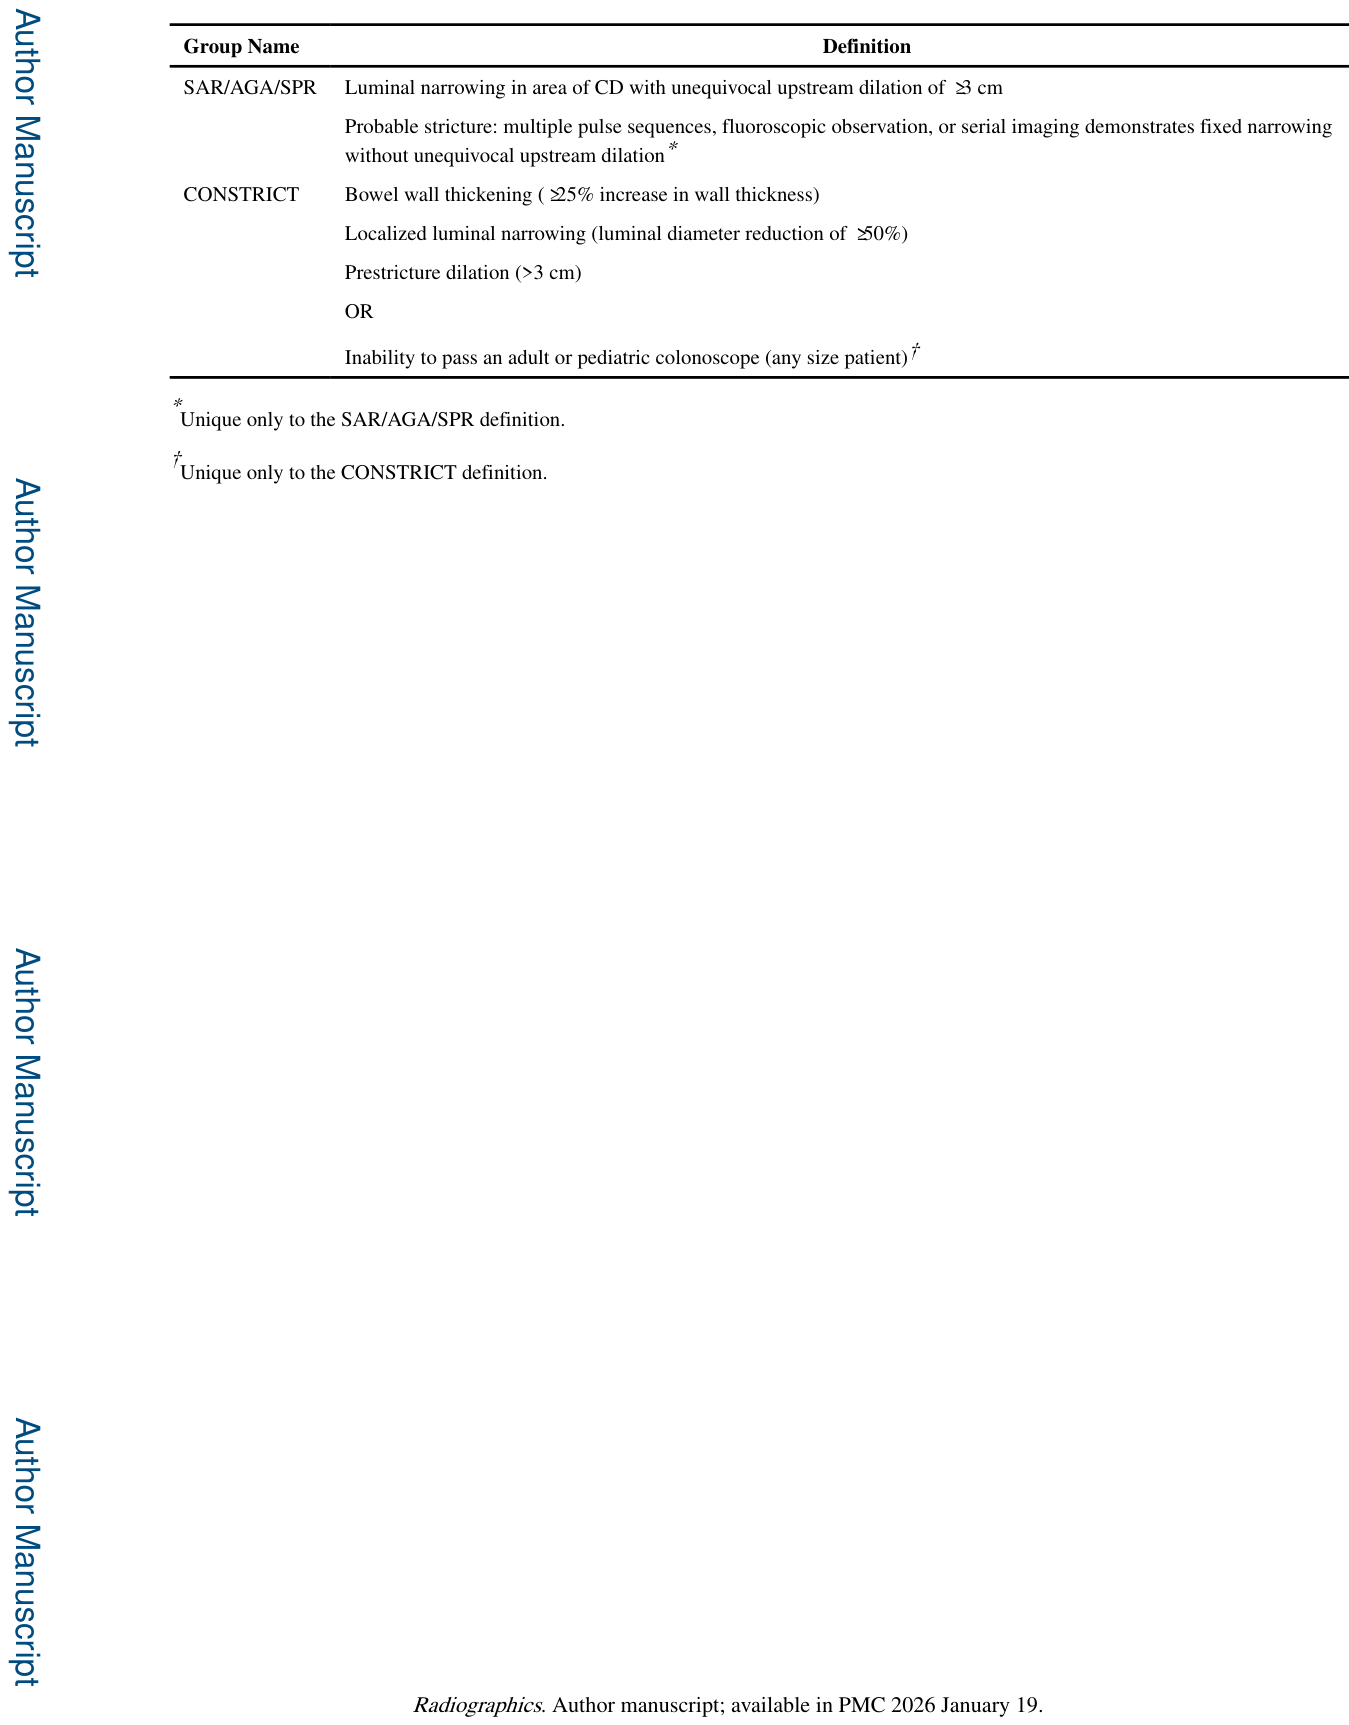
Figure 1. Figure 1. Strictures, by definition, require bowel luminal narrowing, bowel wall thickening, and maximum associated small bowel dilation of 3 cm or greater using either SAR/AGA/SPR or CONSTRICT criteria. CONSTRICT criteria additionally require the metrics listed in parentheses.解説: 本図は、クローン病における狭窄の定義を示す画像とイラストです。腸管内腔の狭小化(非閉塞性の遠位小腸と比較して50%以上)、腸管壁の肥厚(正常腸管と比較して25%以上、または4mm以上)、および最大関連小腸拡張が示されています。Table 1. Table 1: SAR/AGA/SPR and CONSTRICT Imaging Criteria for CD Small Bowel Strictures
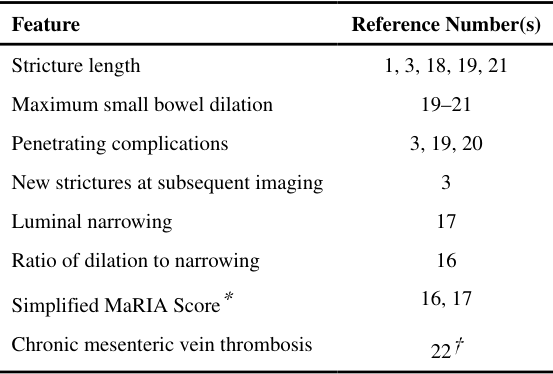
Table 2. Table 2: Studies Highlighting the Imaging Features of Small Bowel CD Strictures Associated with Surgery and Near- Term Surgery
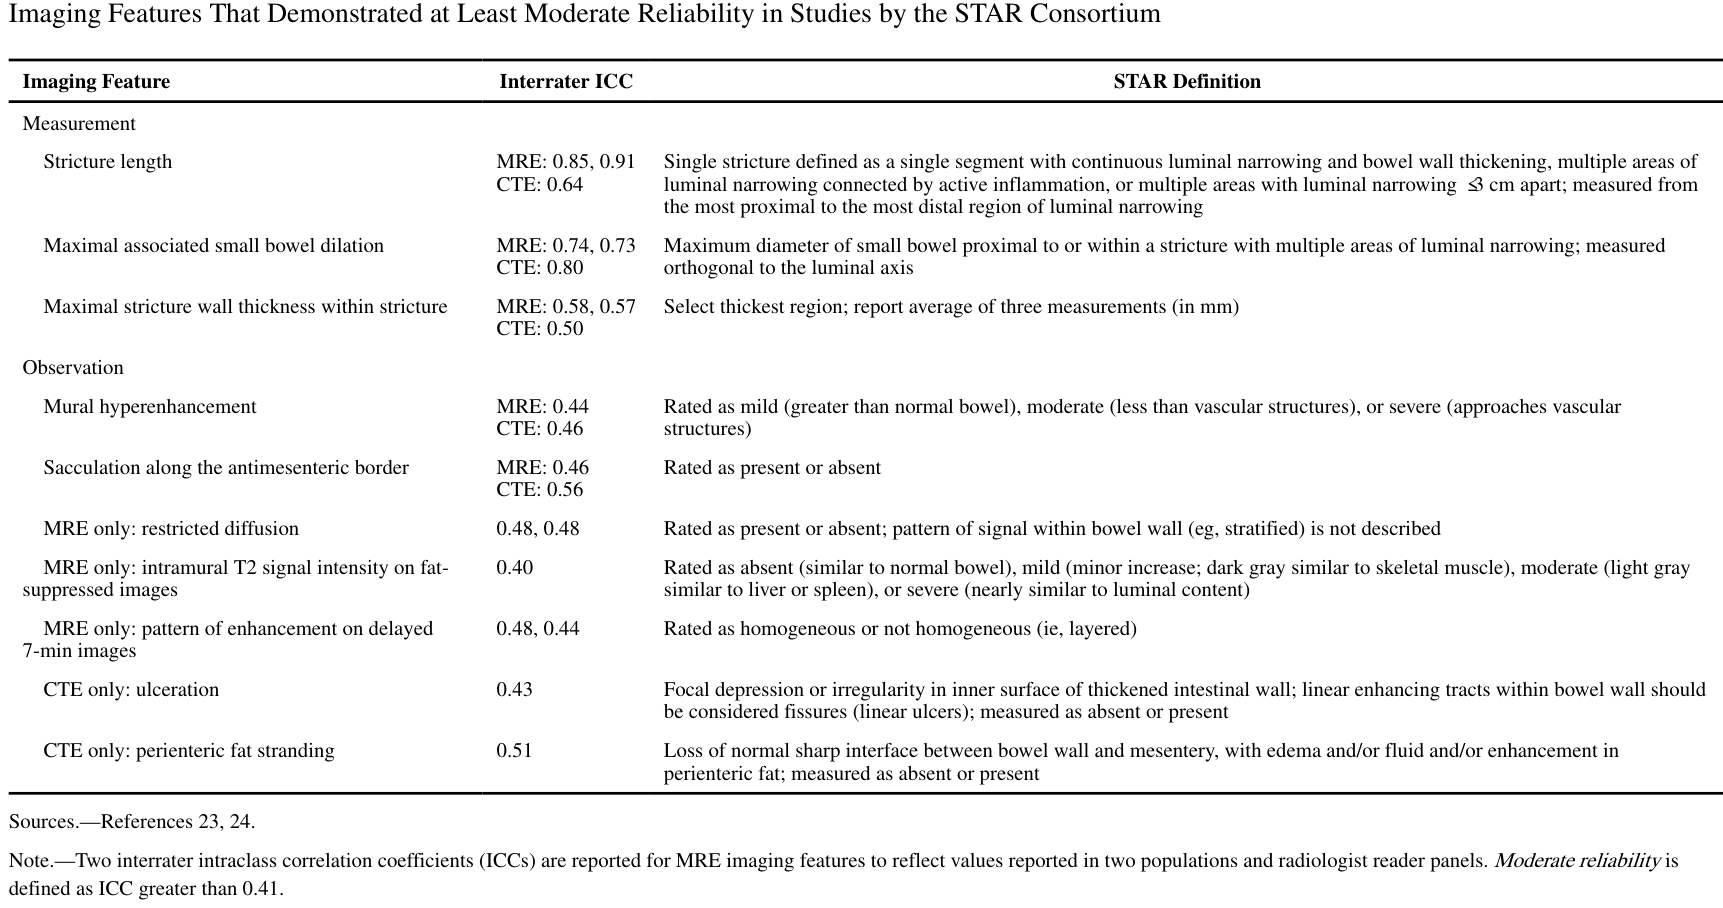
画像バイオマーカーの測定と報告の標準化:STARコンソーシアムの取り組み
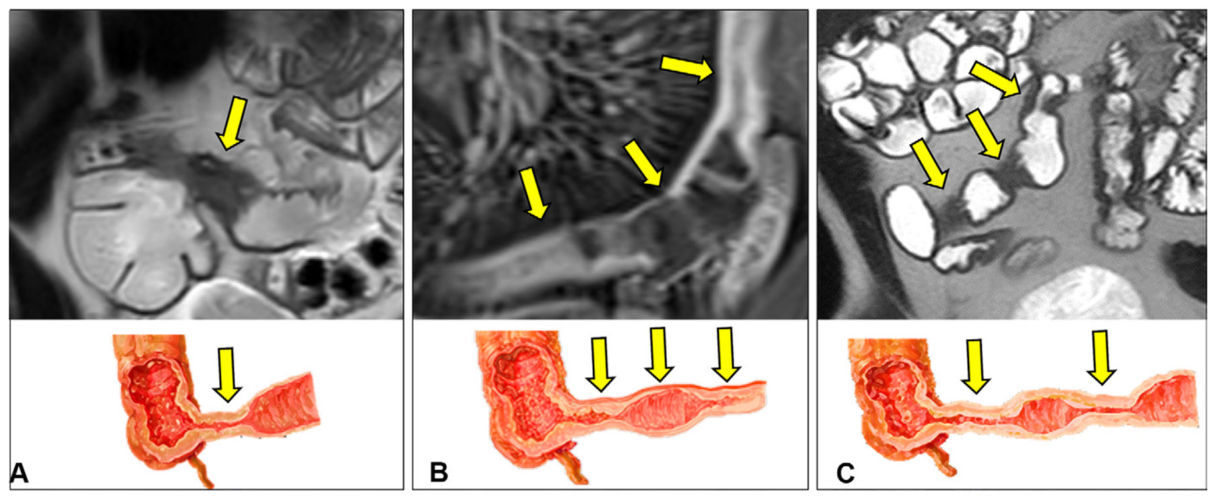
現在の診断および予後バイオマーカーを臨床診療に導入する上での課題の一つは、狭窄長や近位(または最大関連)小腸拡張といった主要な画像特徴をどのように測定し、他の特徴をどのように記述すべきかについての指針が不足していたことです。この課題に対し、STARコンソーシアム(Stenosis Therapy and Anti-Fibrotic Research Consortium)が最近、MRE(MRエンテログラフィー)およびCTE(CTエンテログラフィー)の画像特徴を記述するための画像定義と運用規則を体系的に確立しました。これらの定義によれば、単一の狭窄とは、連続的な内腔狭窄と腸管壁肥厚を伴う単一の腸管セグメント、あるいは炎症所見(例:腸間膜辺縁の炎症)によって連結された複数の狭窄セグメント、または3cm以内で分離された複数の狭窄セグメントを指します。
Figure 2. Figure 2. STAR Consortium definition of a single stricture. (A) Coronal MR image and illustration show a single bowel segment with continuous luminal narrowing and bowel wall thickening (arrows). (B) Coronal MR image and illustration show multiple narrowed segments linked by imaging findings of inflammation, such as mesenteric border inflammation (arrows). (C) Coronal MR image and illustration show multiple narrowed segments (arrows) separated by 3 cm or less.解説: 本図は、STARコンソーシアムによる単一狭窄の定義を示します。Aは連続的な内腔狭小化と腸管壁肥厚を伴う単一の腸管セグメント、Bは腸間膜辺縁の炎症によって連結された複数の狭窄セグメント、Cは3cm以内で分離された複数の狭窄セグメントのMR画像とイラストです。
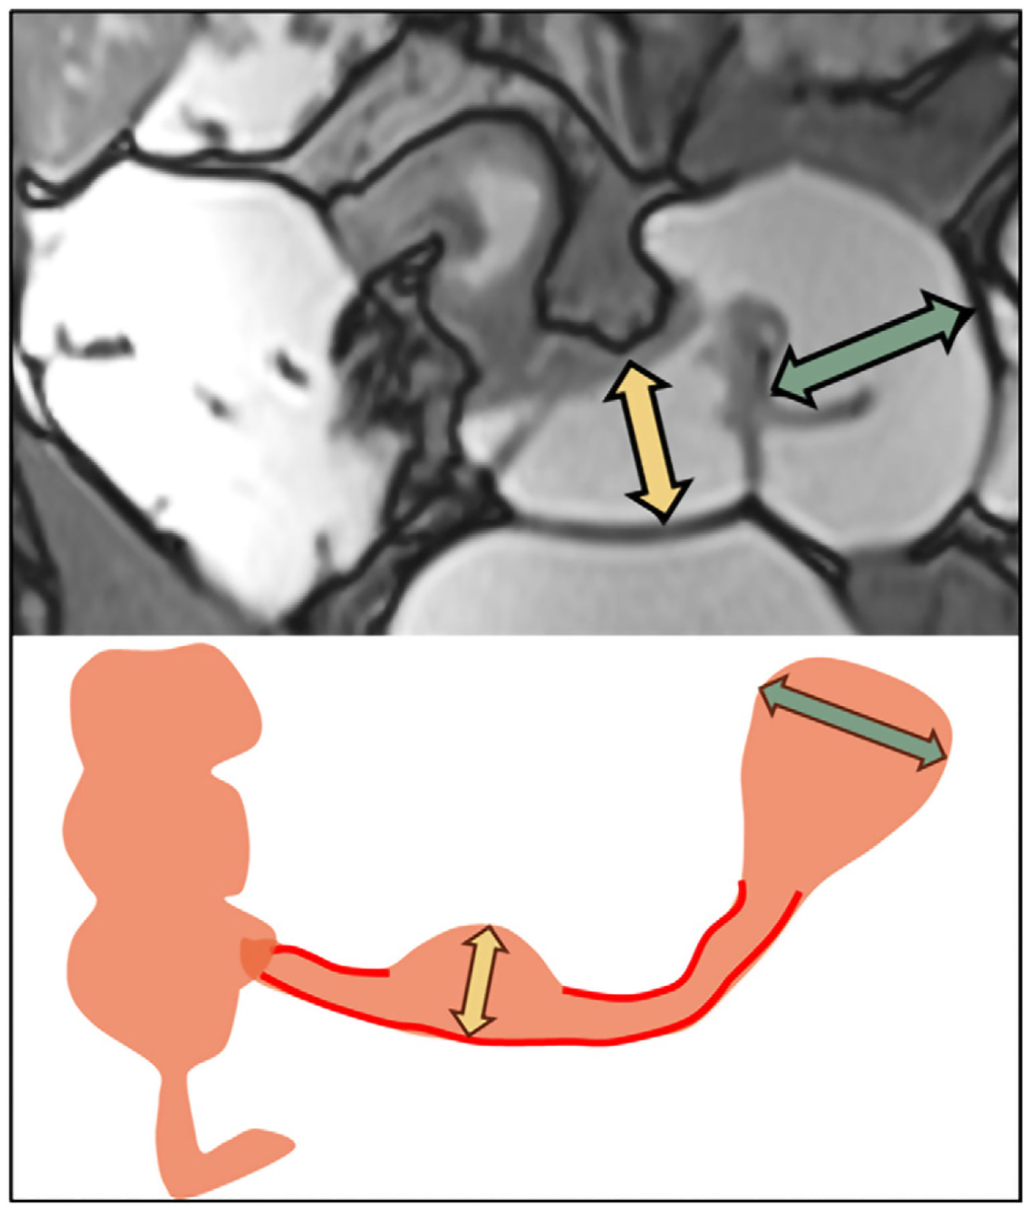
Figure 3. Figure 3. Measurement of maximum associated small bowel dilation. Coronal MR image and illustration show that maximum dilation is measured perpendicular to the center line or axis of the small bowel, from the midpoint of one bowel wall to the midpoint of the opposite bowel wall (as shown). Some strictures may exhibit multiple areas of severe narrowing within the stricture itself. Therefore, the maximum associated small bowel dilation might be found within the stricture (yellow double-headed arrows) rather than proximal to it (green double-headed arrows). In such cases, the larger dilation should be measured.解説: 本図は、最大関連小腸拡張の測定方法を示します。冠状MR画像とイラストにより、拡張した腸管ループが楕円形である場合も含め、腸管の内腔軸に垂直に、狭窄の近位または内部で最大拡張を測定することが示されています。測定は腸管壁の中央から反対側の腸管壁の中央まで行われます。
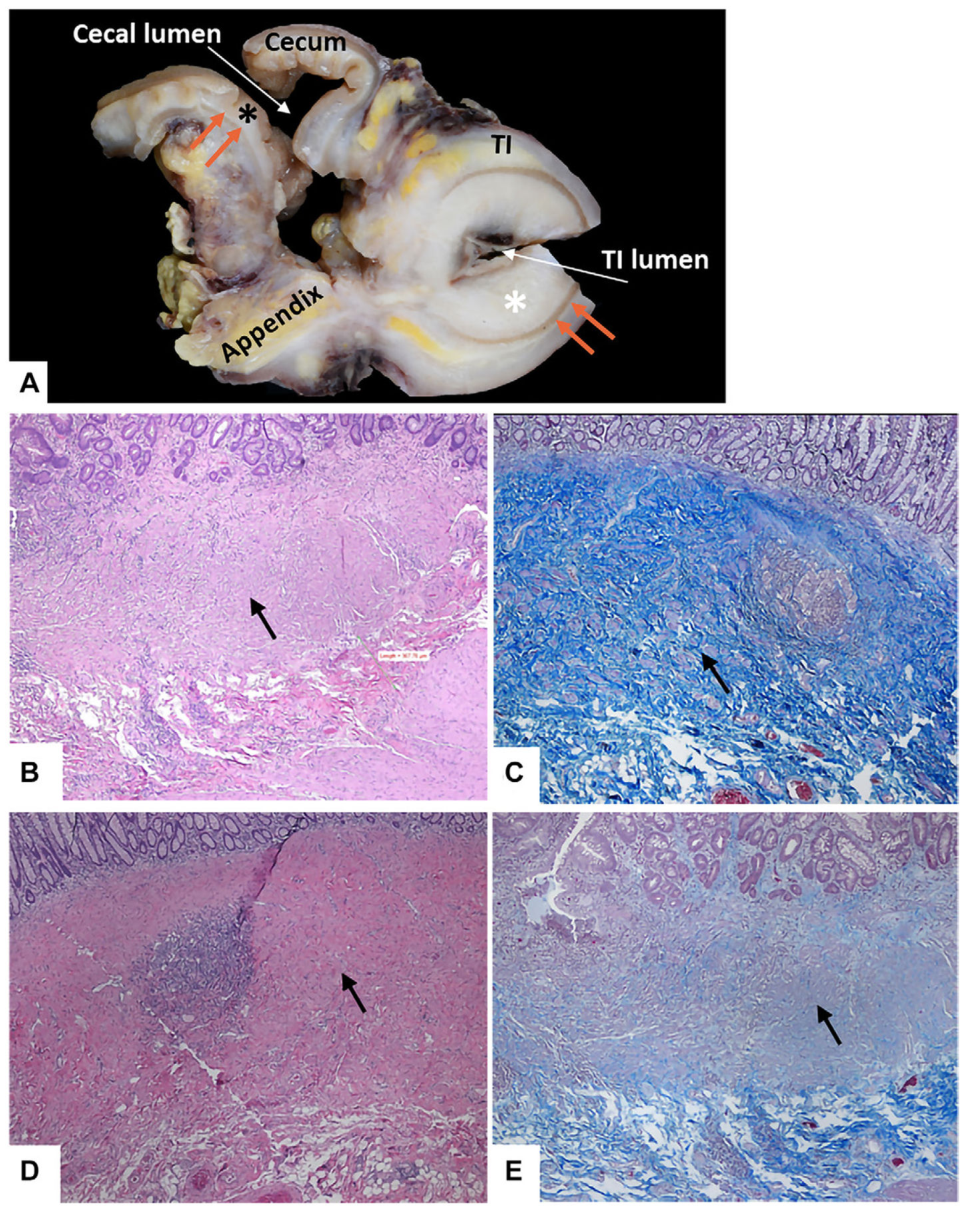
Figure 4. Figure 4. Manifestation of CD strictures in different patients. (A) Photograph of the gross specimen shows the submucosa (black *) and the dual layers of the muscularis propria (orange arrows) within the cecum. Conversely, in the terminal ileum (TI), the submucosa (white *) appears considerably thickened and is situated between the lumen (white arrows) and the muscularis propria. (B, C) Photomicrographs in a different patient show wall thickening attributed predominantly to submucosal fibrosis (arrow) (B). (Hematoxylin-eosin [H-E] stain; original magnification, ×4.) This is indicated by the royal blue collagen staining with the trichrome stain (C). (Masson trichrome stain; original magnification, ×4.) (D, E) In another patient, photomicrograph (D) shows that the wall thickening primarily results from submucosal muscular hyperplasia (arrow in D). (H-E stain; original magnification, ×4.) The submucosal muscular hyperplasia (arrow in E) is highlighted by the pale gray-red hue with the trichrome stain (E). (Masson trichrome stain; original magnification, ×4.)解説: 本図は、異なる対象者のクローン病狭窄の病理像を示します。Aは肉眼標本の写真で、粘膜下組織の肥厚が認められます。BとDはヘマトキシリン・エオジン染色、CとEはマッソントリクローム染色による病理組織像で、線維化、炎症、平滑筋過形成、神経過形成など、狭窄の組織学的組成の多様性が示されています。
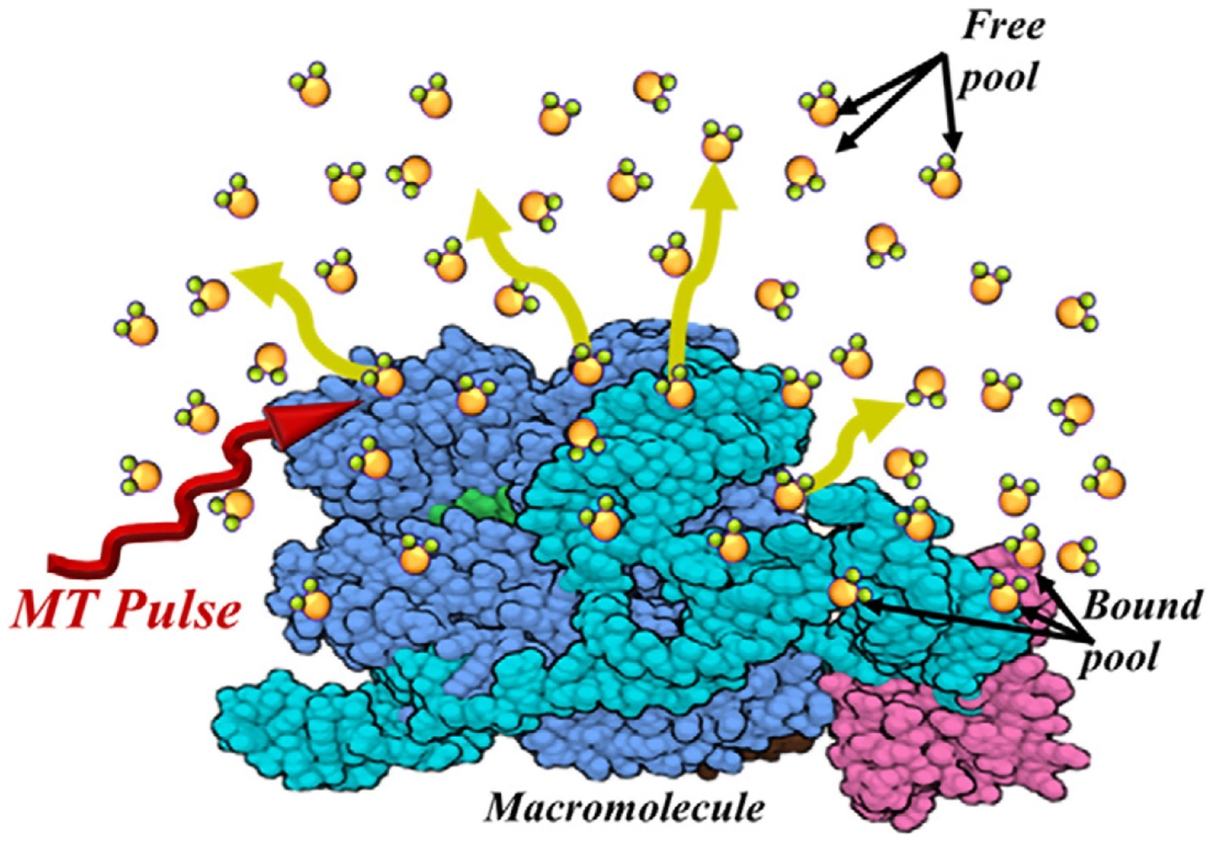
Figure 5. Figure 5. Illustration of MT-MRI. Hydrogen nuclei contributing to the MR signal include a free pool (free water) and a bound pool (bound water and macromolecule). In MT-MRI, the MT-pulse targets the bound pool and injects energy that subsequently transfers to the free pool. This pulse saturates the protons within the macromolecular pool and indirectly saturates those in the free water pool, as well. Following this, routine radiofrequency pulses and gradients cause a decrease in signal intensity in areas containing both pools. (Created with BioRender.com.)解説: 本図はMT-MRIの原理を示しています。MR信号生成に寄与する水素原子核は、自由水を含む「自由プール」と、結合水およびマクロ分子を含む「結合プール」に分けられます。MTパルスを使用すると、マクロ分子プールにエネルギーが注入され、そのエネルギーが「マグネティゼーション・トランスファー」と呼ばれるプロセスで自由プールに転送される様子が示されています。
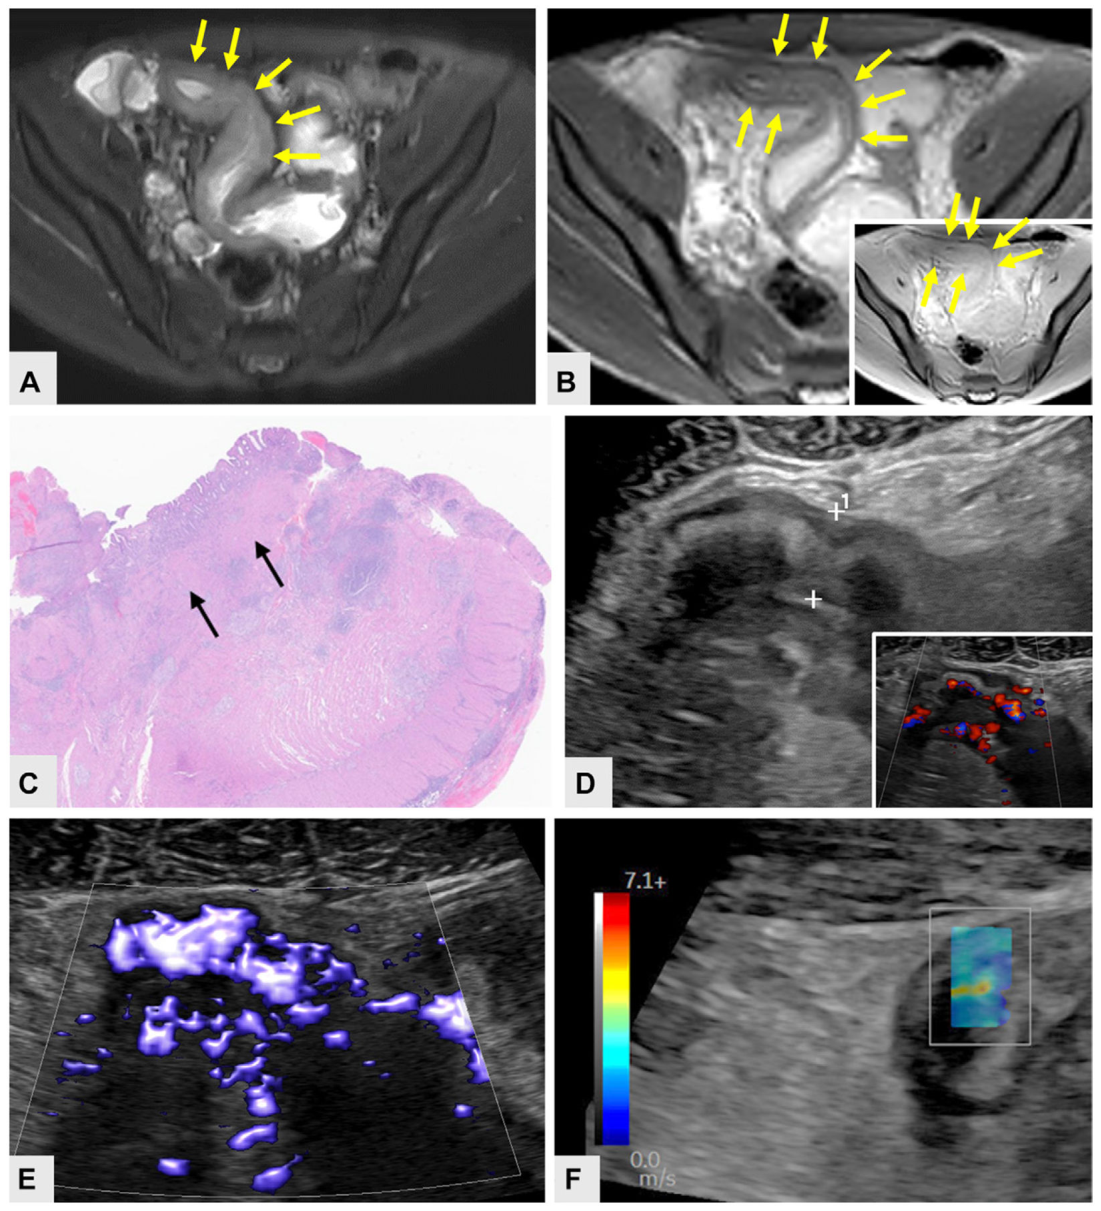
Figure 6. Figure 6. CD in a 29-year-old man who presented with ongoing postprandial symptoms of pain and abdominal cramping and a normal colonoscopy result. (A) Axial single-shot fast spin- echo fat-saturated MR image shows a stricture (arrows) with inflammation and intramural T2-weighted edema. (B) Corresponding axial two-dimensional MT image with MT-pulse applied shows substantial loss of signal intensity in the stricture wall (arrows). Inset shows the stricture without MT-pulse with high signal intensity in the stricture wall (arrows in inset). (C) Photomicrograph of the histopathologic specimen shows submucosal fibrosis and smooth muscle hyperplasia (arrows) in a stricture with inflammation and fibrosis. (H-E stain; original magnification, ×2.) (D, E) US images show wall thickening on the gray-scale image (D), with increased vascularity reflecting inflammation on the Doppler US image (inset in D), which is more pronounced on the corresponding US microvessel image (E). (F) Shear-wave elastogram shows the involved bowel segment.解説: 本図は、食後疼痛と腹部痙攣の持続症状およびMT-MRIの評価のために受診した29歳男性のクローン病の画像所見と病理組織像です。MR画像(A, B)ではMTパルスにより信号低下が見られ、これは線維化や平滑筋の増加を示唆しています。病理組織像(C)と超音波画像(D, E, F)も示されています。
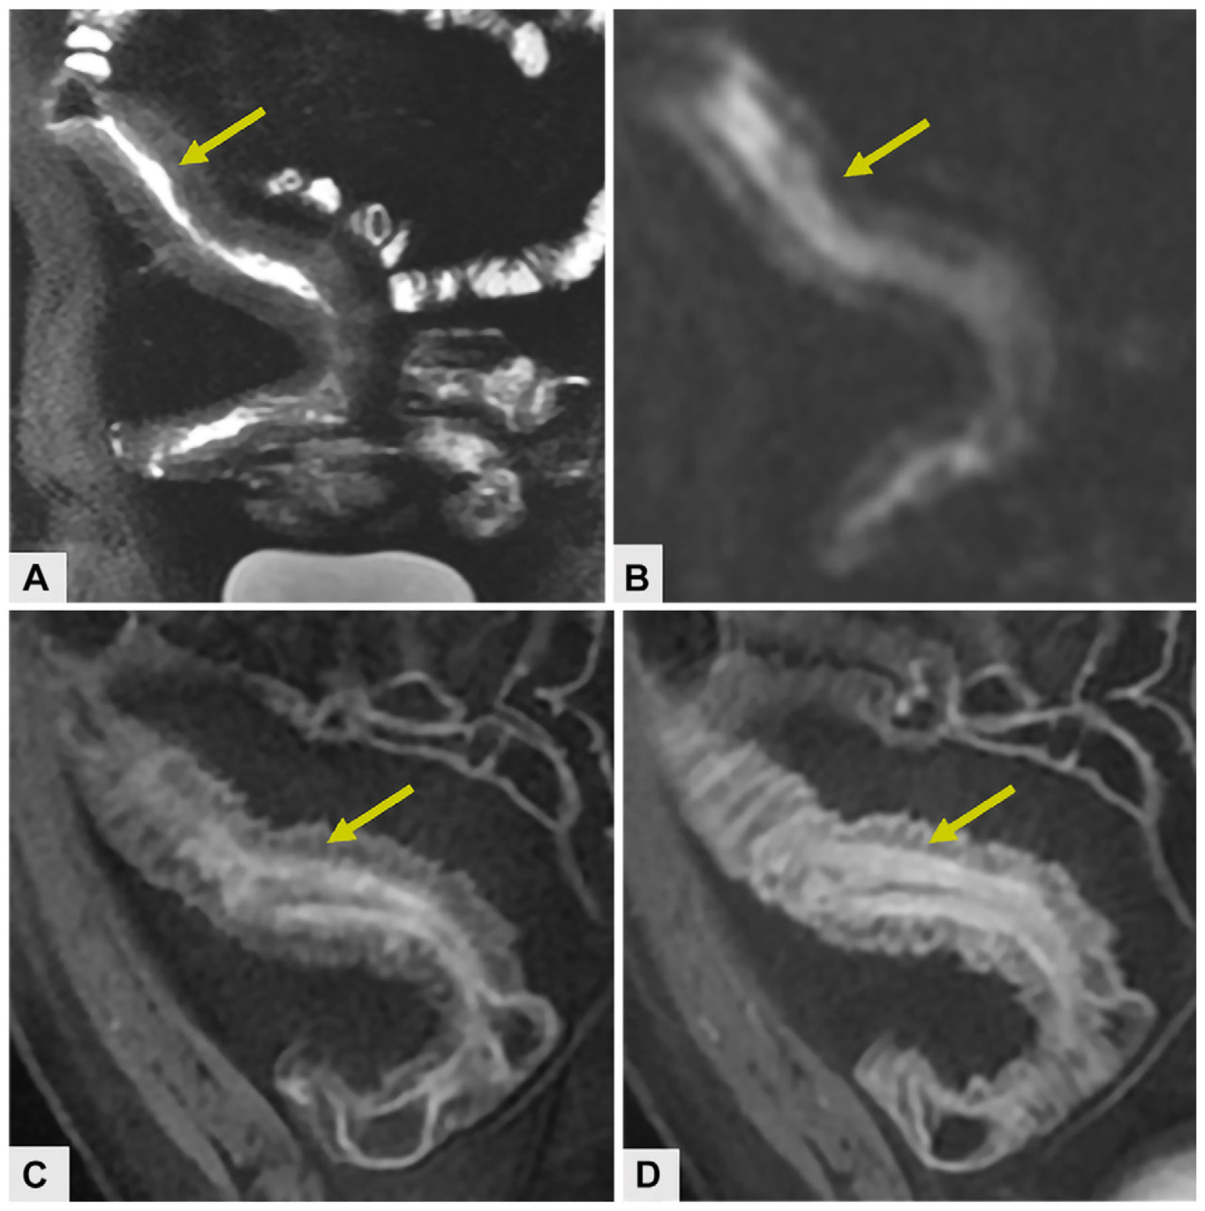
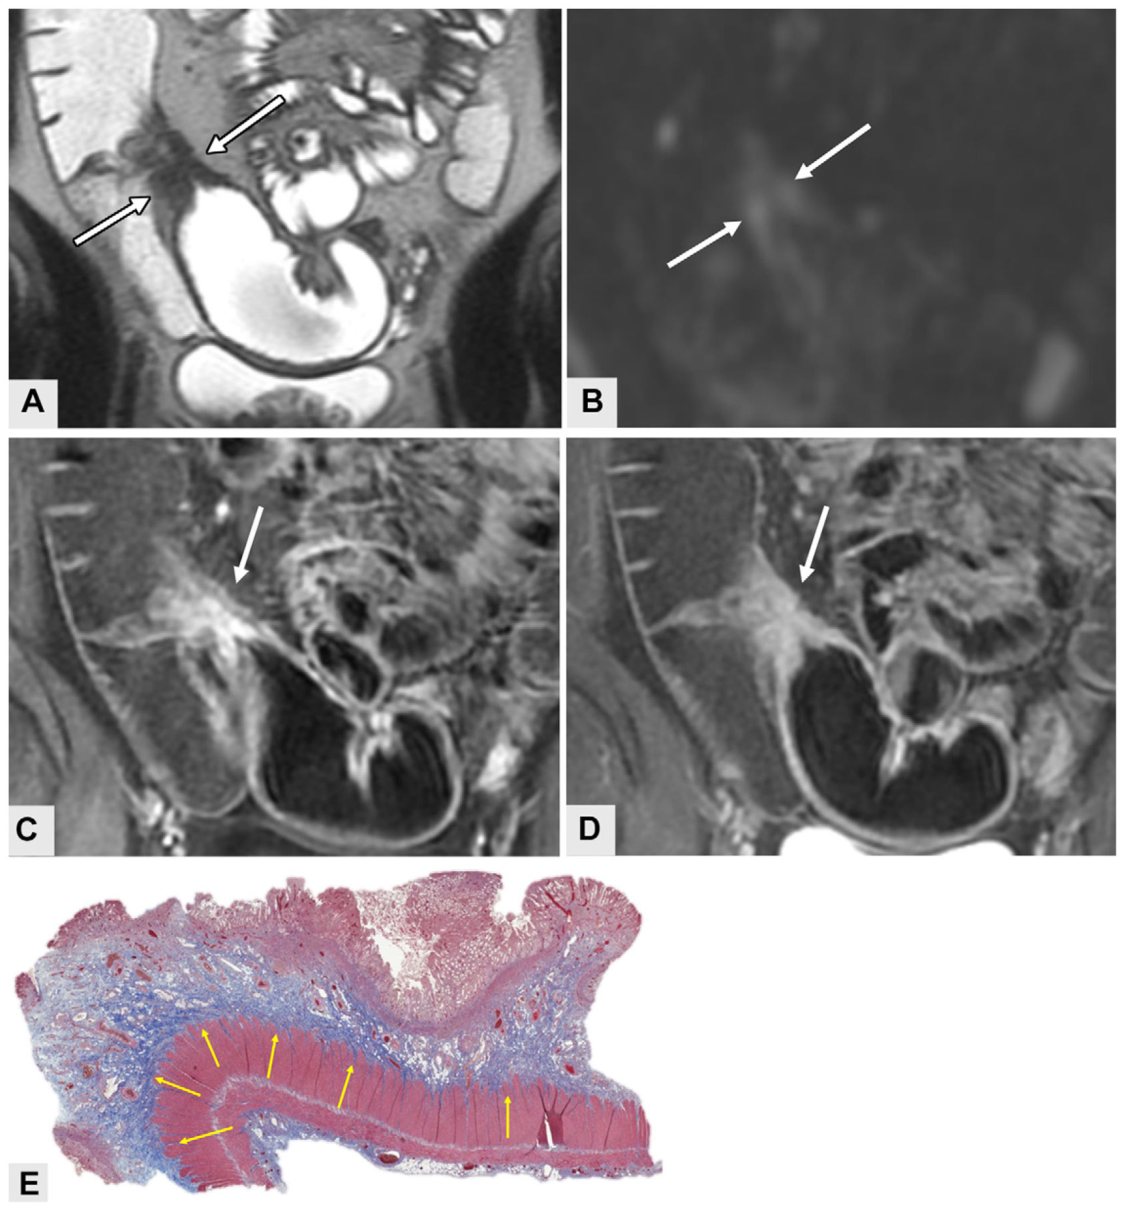
Figure 7. Figure 7. CD stricture with inflammation in a 32-year-old man. (A) Coronal T2-weighted single-shot fast spin-echo fat-saturated MRE image shows ileal luminal narrowing (arrow) with mild-to- moderate intramural edema. (B) Coronal diffusion-weighted MRE image shows restricted diffusion along the inner wall of the stricture (arrow). (C, D) Coronal contrast-enhanced fast spoiled gradient-echo fat-saturated MRE images show a layered pattern of intramural enhancement at 70 seconds (C) and 7 minutes (D), as well as enhancement gain, which is most characteristic of strictures (arrow) with high levels of inflammation, as well as fibrosis.解説: 本図は、32歳男性の炎症を伴うクローン病狭窄の画像所見です。冠状T2強調単発高速スピンエコー脂肪抑制画像(A)では腸管壁の浮腫が認められ、拡散強調画像(B)では拡散制限が見られます。造影後MR画像(C, D)も示されており、これらは炎症を評価するために使用されます。Figure 8. Figure 8. Imaging patterns of a neoterminal ileum CD stricture in a 17-year-old male patient. (A) Coronal T2-weighted single-shot fast spin-echo image shows a short terminal ileal stricture (arrows). (B) Coronal diffusion-weighted image shows faint diffusion restriction (CD stricture; arrows). (C, D) Coronal postcontrast MRE images show a layered enhancement pattern of the bowel wall at 70 seconds (CD stricture; arrow) (C), which progressively becomes homogeneous at 7 minutes (CD stricture; arrow) (D). This likely indicates a fibrotic component to the stricture. (E) Photomicrograph of the histologic section shows submucosal fibrosis (arrows) of the involved segment. (Masson trichrome stain; original magnification, ×2.)解説: 本図は、17歳男性の回腸末端部クローン病狭窄の画像パターンを示します。T2強調画像(A)や拡散強調画像(B)では炎症の所見が示され、造影後画像(C, D)では遅延造影剤増強が確認できます。病理組織像(E)も合わせて提示されています。
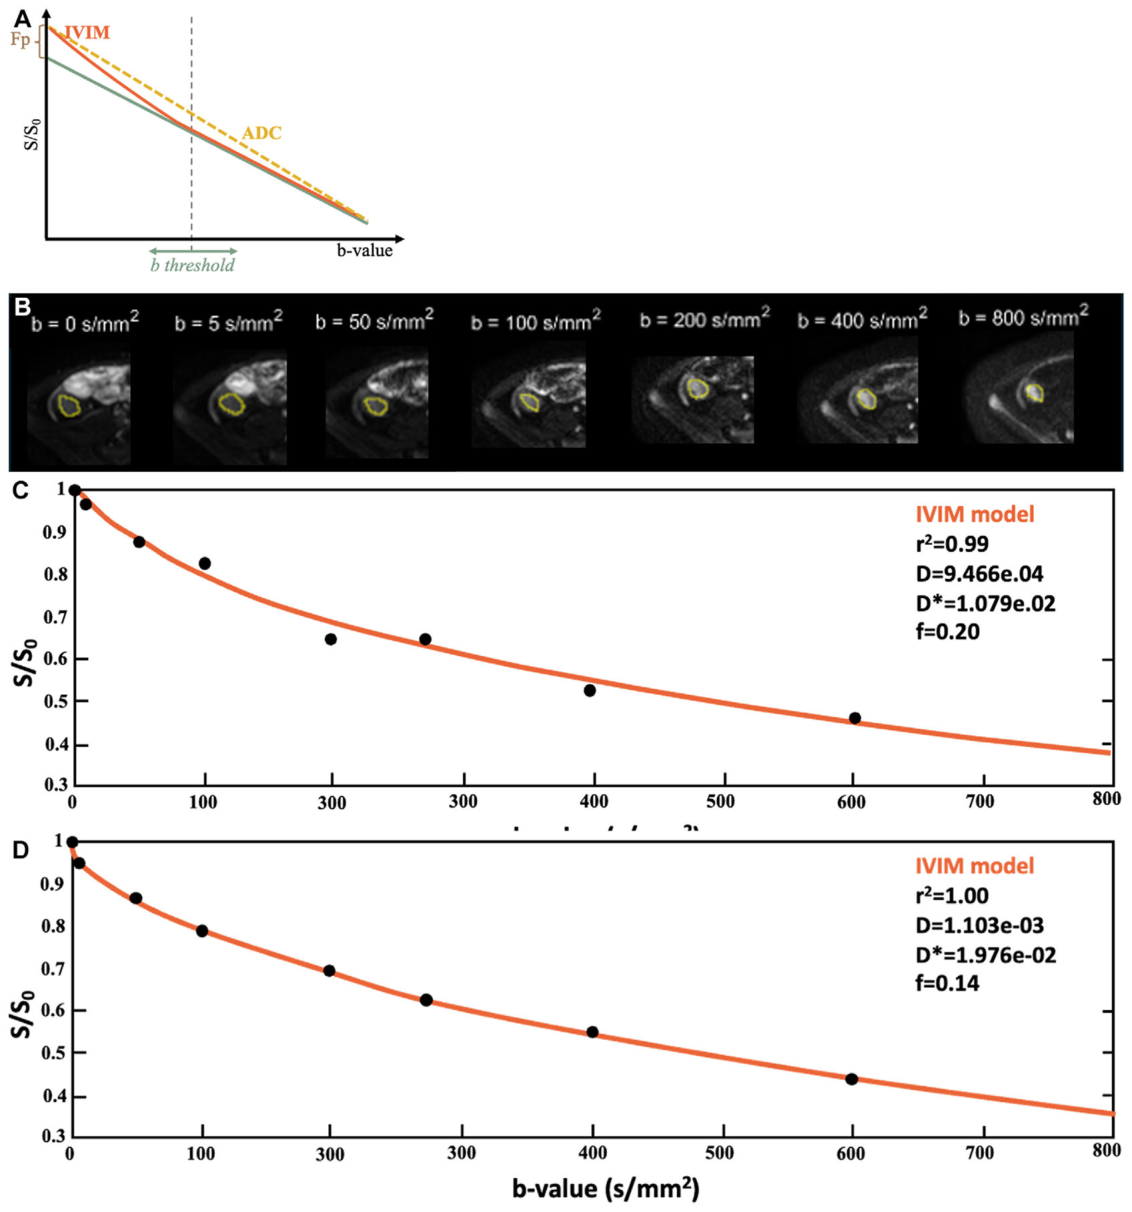
Figure 9. Figure 9. Application of intravoxel incoherent motion (IVIM) imaging in a 17-year-old patient with newly diagnosed ileal CD. (A) Graph shows two modeling approaches for analyzing DWI data acquired at multiple b values. The yellow dashed line represents a monoexponential model estimating apparent diffusion coefficient (ADC), whereas the orange line illustrates the IVIM model, which uses a biexponential function to account for both diffusion and perfusion components. The IVIM analysis provides key parameters, including perfusion fraction (f), true diffusion coefficient (D), and pseudodiffusion coefficient (D*). Note that the IVIM effect is best observed at the low b values. (B) IVIM images were acquired at multiple b values ranging from 0 to 800 sec/mm2 (selected b values shown). Regions of interest were placed in the terminal ilium at the site of the bowel wall thickening and luminal narrowing. (C, D) Signal intensity versus b-value plots from IVIM imaging at diagnosis (C) and 6 weeks after initiation of biologic therapy (D). IVIM model shows that the perfusion
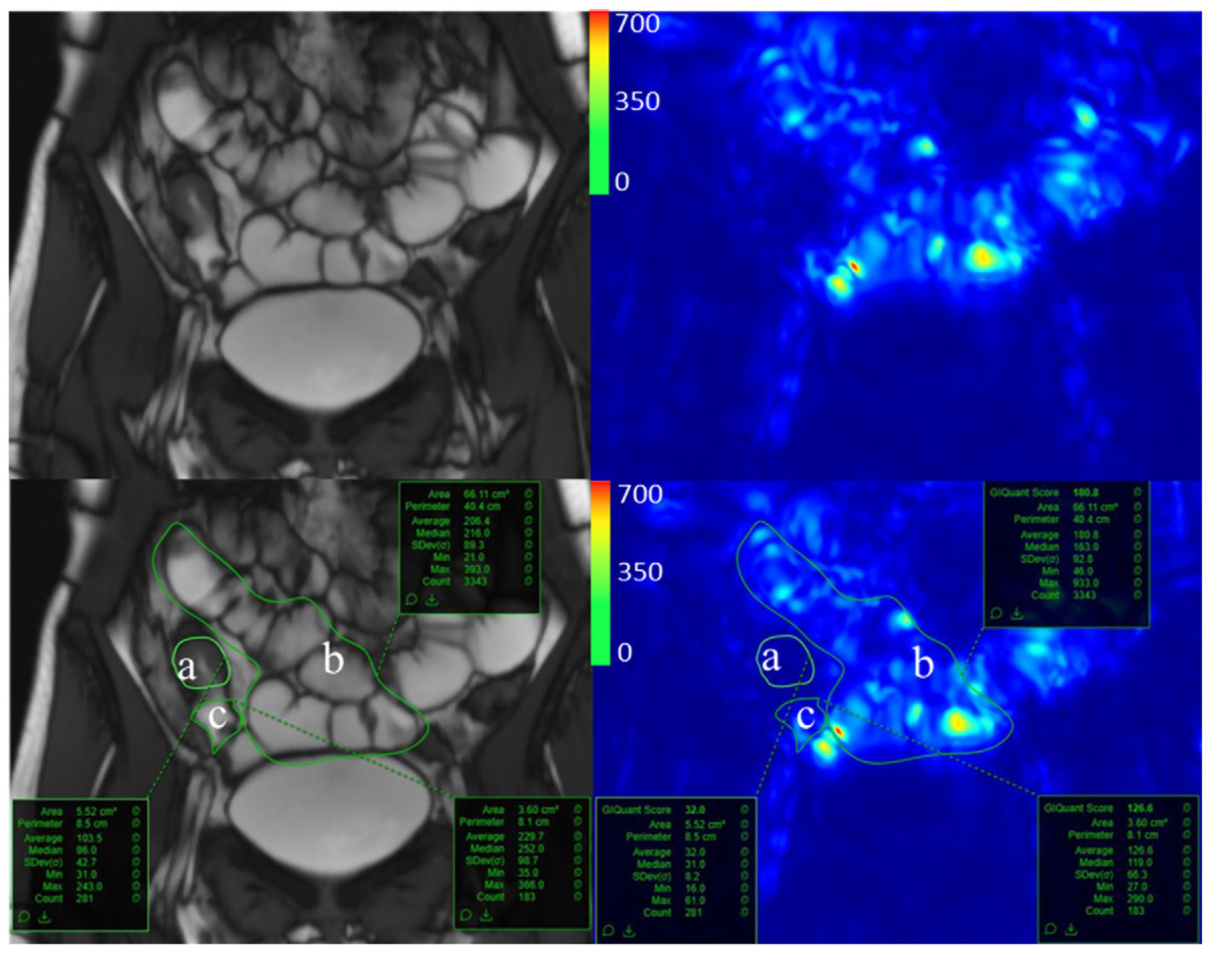
Figure 10. Figure 10. Quantified small bowel motility in a patient with terminal ileal CD. Anatomic reference True-FISP (fast imaging with steady-state precession; Siemens) MR images are on the left, with the corresponding color motility maps at the same location on the right. The bottom row of images shows regions of interest (green lines) drawn over three anatomic locations, as follows: over the terminal ileal stricture (a), over the uninvolved ileum (b), and just proximal to the stricture segment (c). The motility scores, derived from the GIQuant system, reveal a score of 32 at the stricture, in contrast to the uninvolved loop (score, 181), and just proximal to the stricture (score 127).
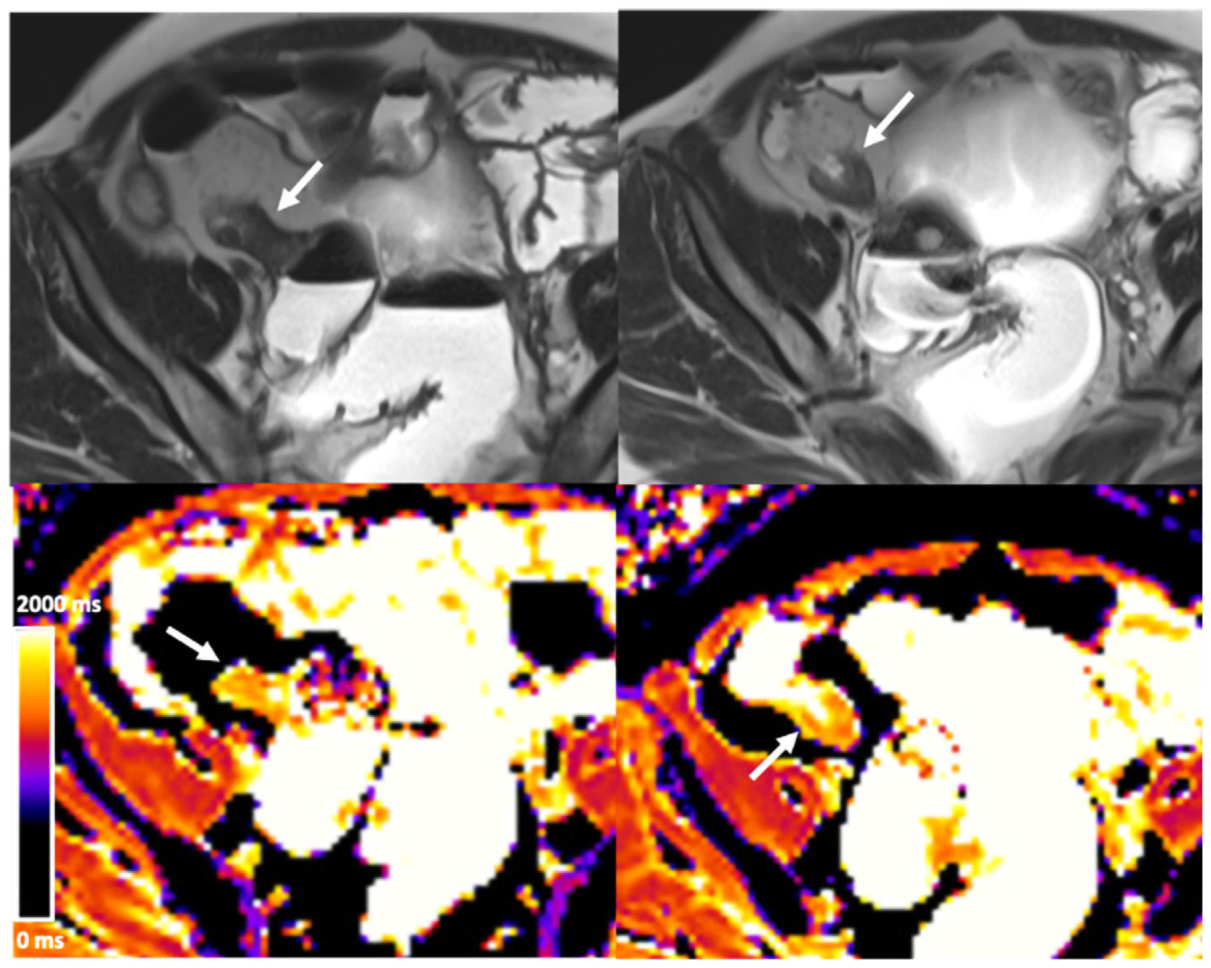
Figure 11. Figure 11. T1-mapping images of a CD stricture in the neoterminal ilium in a 41-year-old woman with an ileosigmoid anastomosis. Axial T2-weighted MR images in the top row show a thickened bowel wall (arrows). The bottom row contains corresponding axial parametric maps of the ileum produced from native T1 relaxometry (modified Look-Locker inversion recovery), with arrows pointing to the same stricture. The parametric maps are color coded according to T1 values of the tissue (inset, bottom left): yellow and orange represent higher T1 values. Bowel wall T1 estimates are increased in patients with ileal CD compared with uninvolved segments. In this case, endoscopic findings showed a short-segment stricture, which could be traversed with a pediatric endoscope, and 5 cm of endoscopic inflammation proximally.
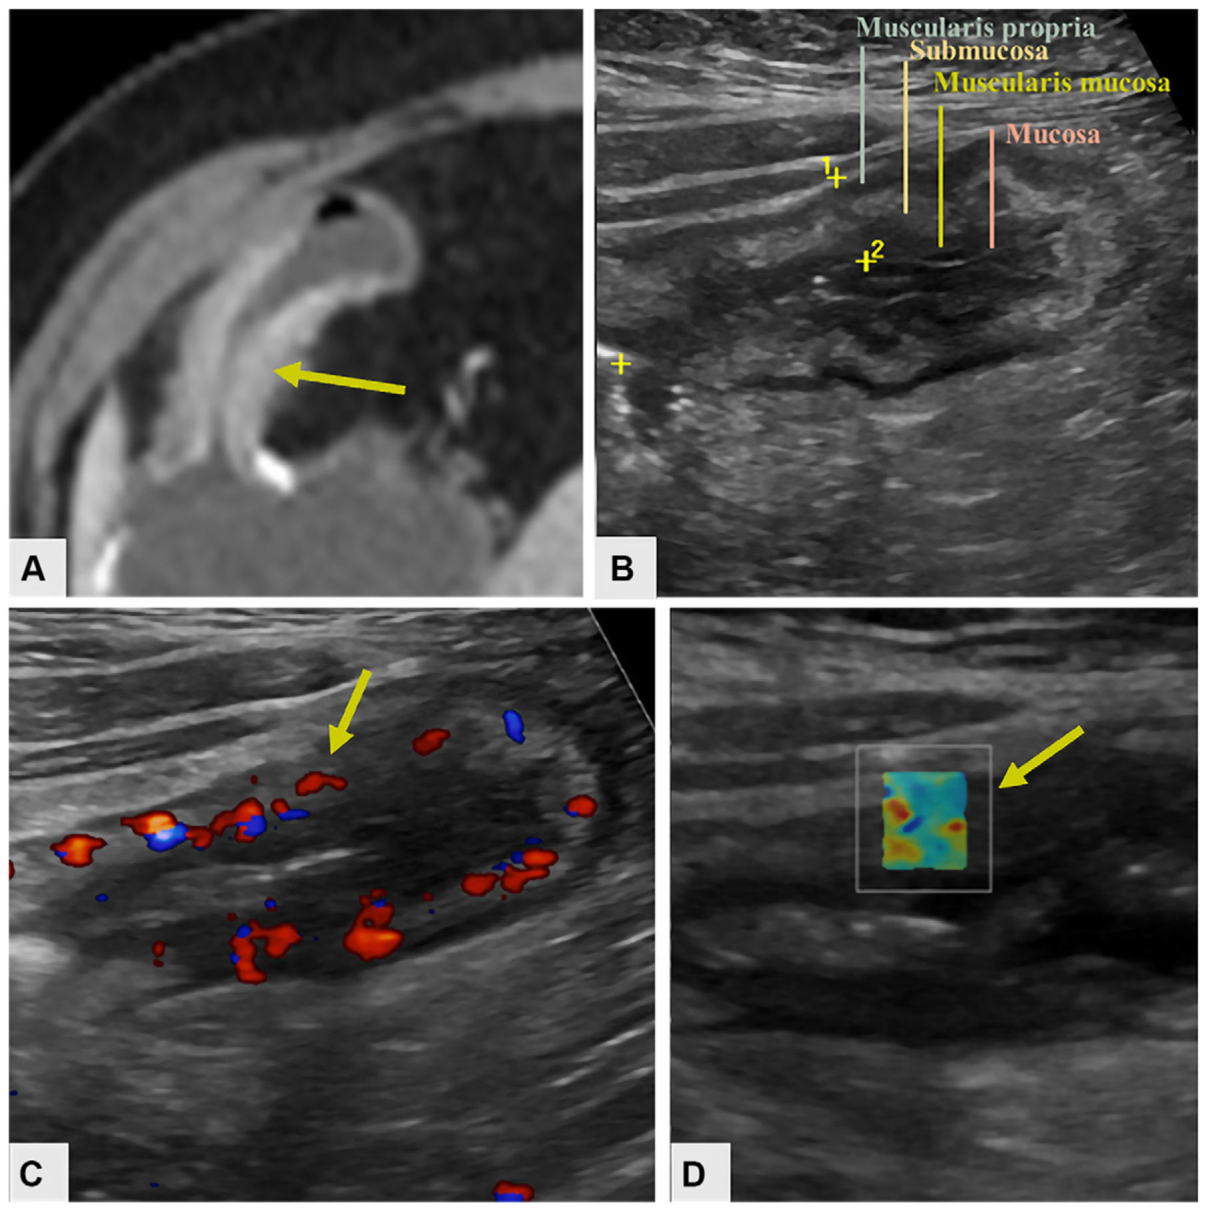
Figure 12. Figure 12. Short-segment stricture with inflammation involving the neoterminal ileum in a 42-year-old woman with prior ileocecal resection. (A) Axial contrast-enhanced CT image shows a 5-cm long stricture (arrow) with inflammation in the distal neoterminal ileum, which is characterized by 9-mm wall thickening, mural enhancement, and luminal narrowing. (B) Longitudinal gray-scale US image shows bowel wall thickening with mainly an expanding submucosal layer. (C, D) Additional longitudinal images with color Doppler US (C) and shear-wave elastography (D) show enhanced vascularity (arrow in C) and increased stiffness of the involved segment (arrow, inset in D), respectively.
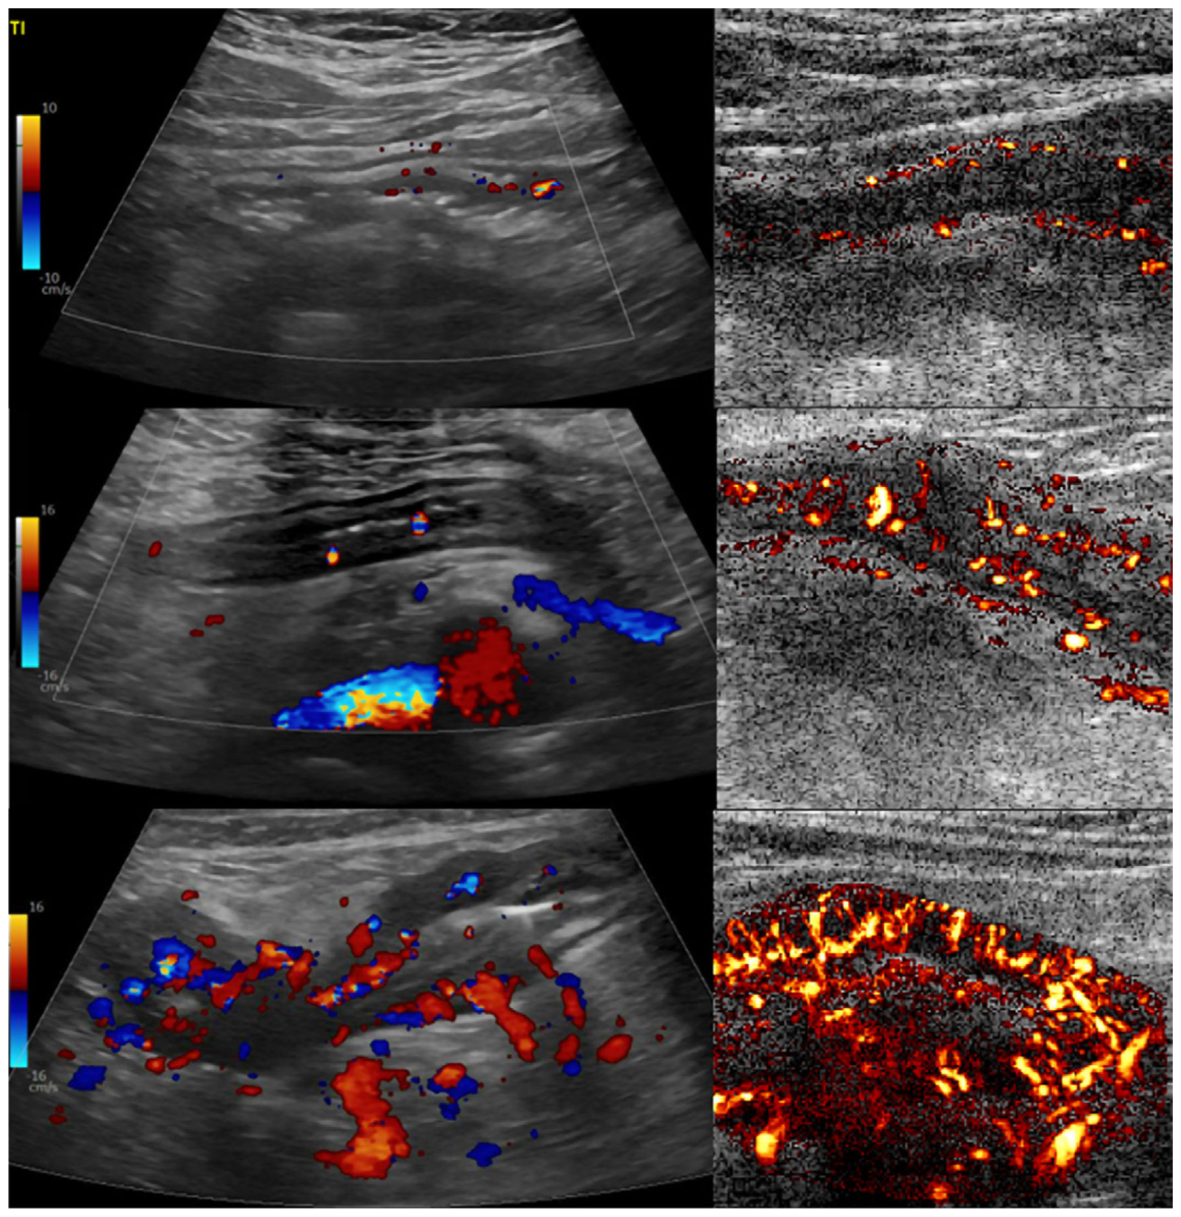
Figure 13. Figure 13. Color Doppler US images (left) and US microvessel images (right) in three patients with ileal CD. The top row shows a 32-year-old man with a vessel-to-length ratio (VLR) score of 0.36 based on UMI. The middle row shows a 44-year-old woman with a VLR of 4.42. The bottom row shows a 27-year-old man with a VLR of 12.81. Histopathologic evaluation of the involved segments indicated mild, moderate, and severe inflammation, respectively.
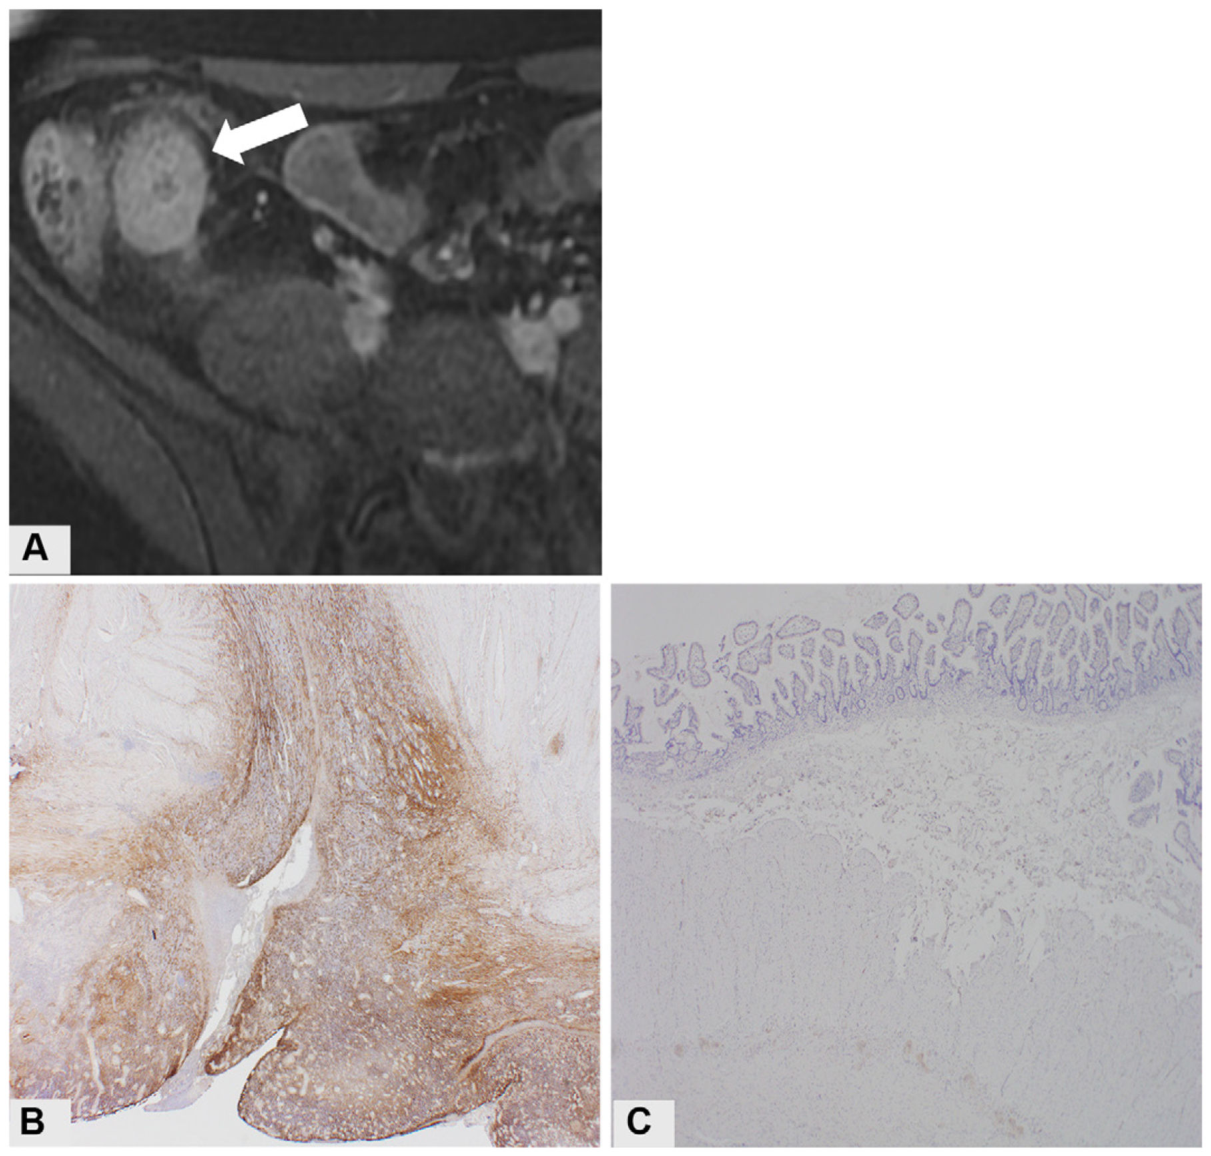
Figure 14. Figure 14. CD in a 25-year-old woman with who underwent ileocecal resection. (A) Axial fat-saturated T1-weighted MR image with a 7-minute delay shows luminal narrowing marked bowel wall thickening with homogeneous enhancement of bowel wall (arrow). (B) Photomicrograph of fibroblast activation protein (FAP) immunohistochemical findings shows a prominent staining reaction. (3,3′diaminobenzidine [DAB] stain; original magnification, ×4.) (C) Photomicrograph of immunohistochemical staining in another patient without CD stricture shows a lack of FAPI binding. (DAB stain; original magnification, ×4.)

コメントを残す