どうも、Beyond the Pixelです。慢性血栓塞栓性肺高血圧症(CTEPH)は、肺の血管に古い血栓が残り、血管が詰まることで肺動脈圧が上昇する進行性の疾患です。診断と治療には、複数の診断戦略と学際的な連携が不可欠とされています。しかし、多くの対象者が進行した機能段階で診断されている現状があり、CTEPHの認識不足や診断の遅れが示唆されています。現在、慢性血栓塞栓性疾患を検出するための第一選択の画像診断法として推奨されているのは、換気血流シンチグラフィー(V/Q-SPECT)です。V/Q-SPECTは、肺の換気と血流の不一致を示す特徴的な所見を捉えることで、96%から98%の感度と90%から95%の特異度でCTEPHを診断できると報告されています。しかし、このV/Q-SPECTにはいくつかの課題があります。例えば、中心部に位置する非閉塞性血栓塞栓性病変の過小評価、限られた空間分解能、そして肺の実質の解剖学的詳細が不足している点などが挙げられます。このような課題に対し、新しい画像診断技術であるフォトンカウンティングCT(PCCT)が注目を集めています。PCCTは、従来のCT装置とは異なるエネルギー分解能を持つ検出器を使用することで、より高解像度の画像を提供し、放射線量効率も向上させています。これにより、1回のスキャンで肺の血流、血管構造、実質の評価が可能となり、診断精度が向上する可能性を秘めているのです。
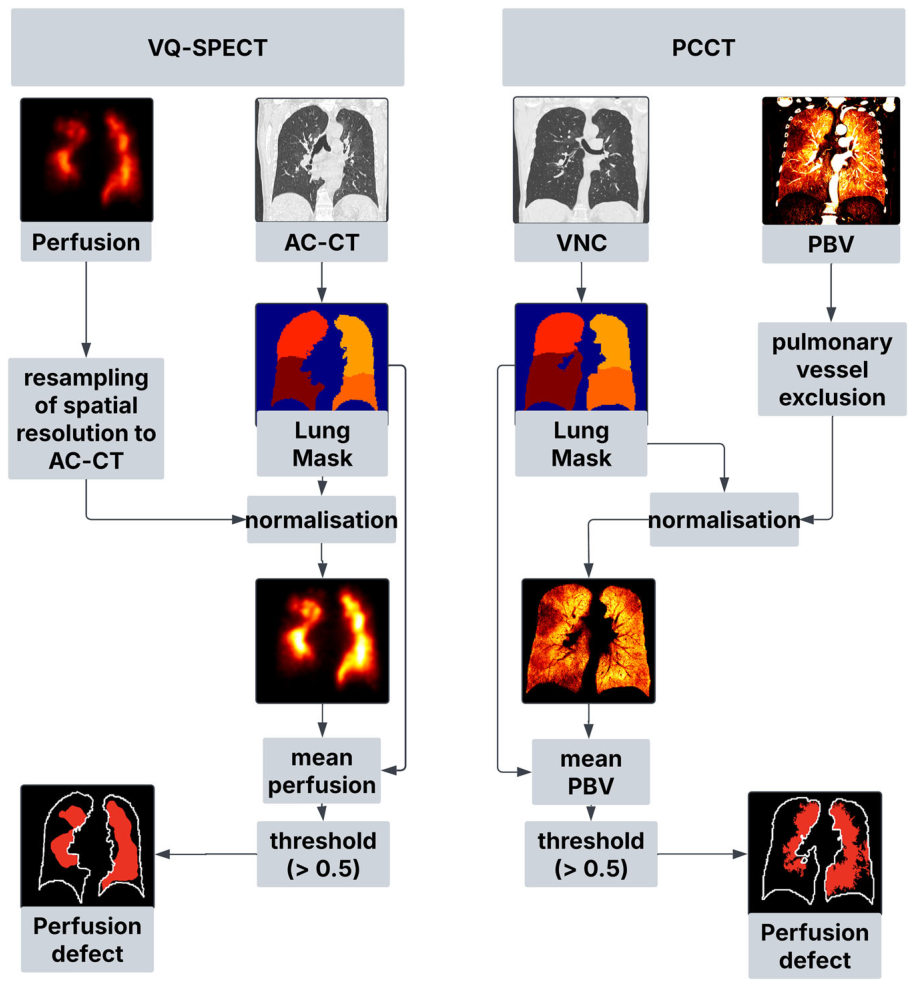
Figure 1. Fig. 1 Image processing workflow for quantification of lobar mean perfusion and perfusion defect percentage from PCCT and V/Q-SPECT images. Lung and lobar segmentation were performed on inspiratory PCCT virtual non-contrast (VNC) and attenuation-correction CT (AC-CT) images using TotalSegmentator. Pulmonary vessels were excluded from PBV maps using a threshold-based vessel mask to enable comparison with V/Q-SPECT-derived perfusion. For inter-modal comparison, perfusion data from both imaging techniques were standardised using z-score normalisation (95% confidence interval). Mean PBV as a surrogate for lung perfusion was calculated for each lobe and the entire lung and used to derive lobar and whole-lung perfusion defect volumes解説: PCCTとV/Q-SPECT画像から肺葉ごとの平均血流と血流欠損の割合を定量化するための画像処理ワークフローです。肺と肺葉のセグメンテーションは、PCCTの仮想非造影(VNC)画像と減弱補正CT(AC-CT)画像にTotalSegmentatorを使用して行われました。V/Q-SPECTから得られた血流と比較するため、PBVマップから閾値ベースの血管マスクを用いて肺血管が除外されました。モダリティ間の比較のため、両方のイメージング手法からの血流データはZスコア正規化されました。
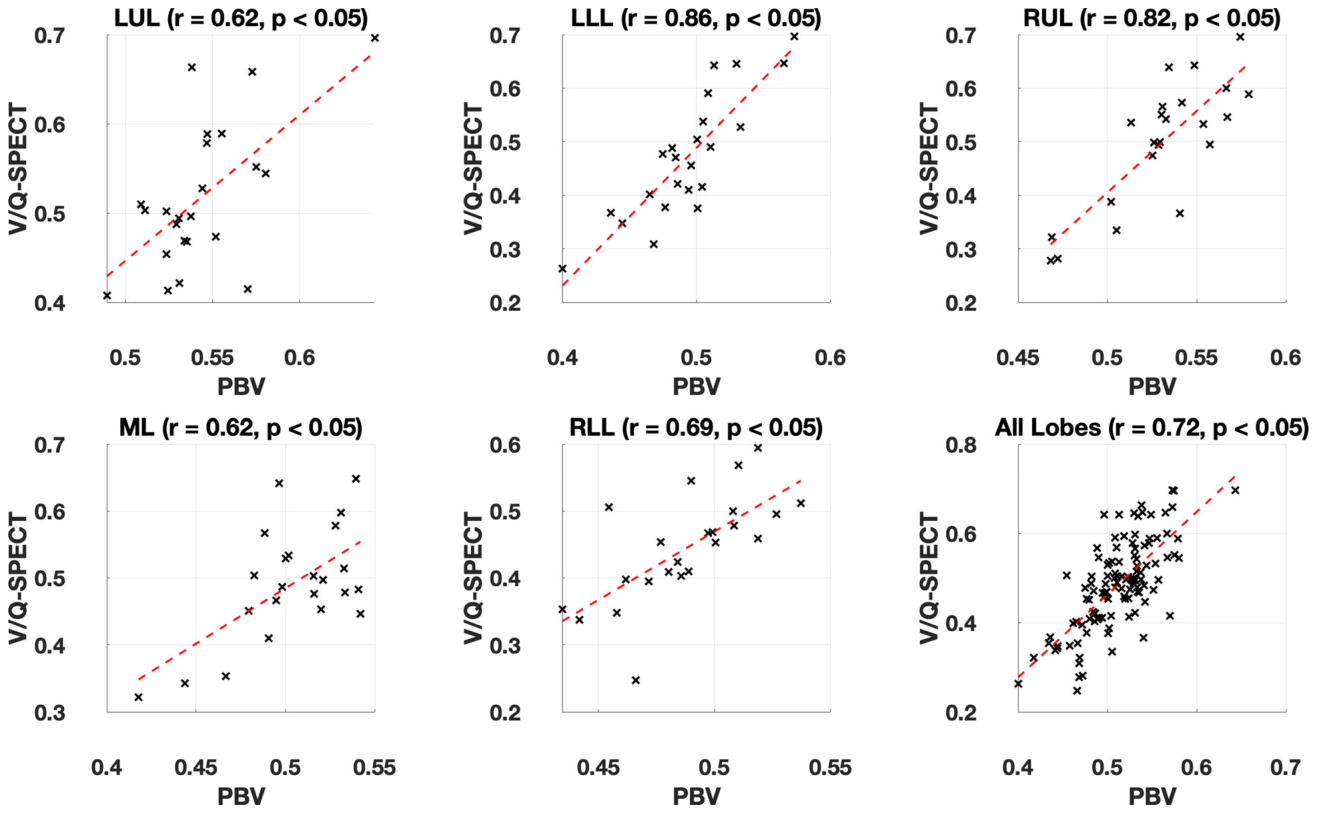
本研究の結果、PCCTで算出された肺全体の灌流血液量(PBV)とV/Q-SPECTによる血流の間には、強い相関が見られました(ピアソン相関係数r = 0.72, p < 0.05)。肺葉レベルでは、相関はr = 0.62からr = 0.85の範囲で確認されました。
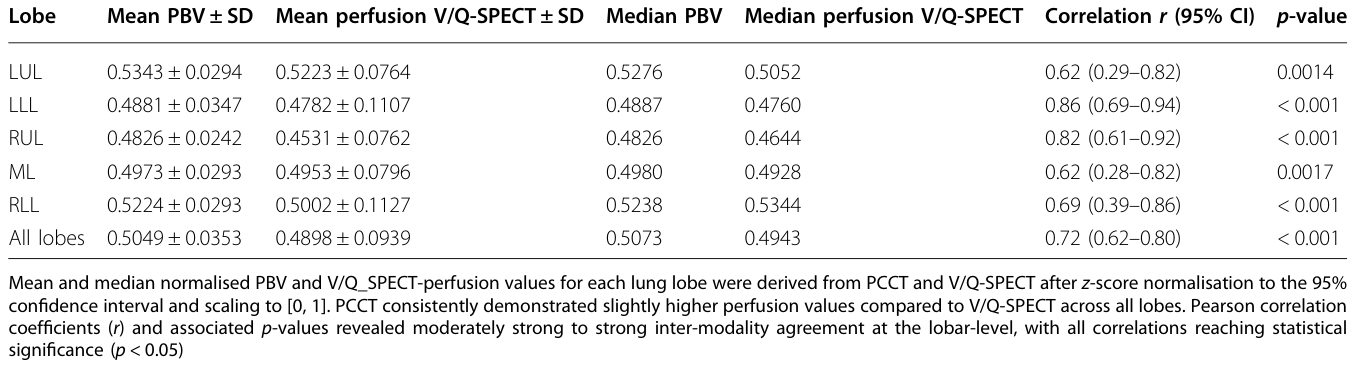
Table 2. Table 2 Lobe-wise perfusion metrics and corresponding correlations of mean PBV and V/Q-SPECT-perfusion解説: PCCTとV/Q-SPECT間の平均PBVとV/Q-SPECT血流の、肺葉ごとの血流指標と対応する相関関係を示しています。PCCTは、すべての肺葉でV/Q-SPECTと比較してわずかに高い血流値を示しました。ピアソン相関係数(r)と関連するp値は、肺葉レベルで中程度から強いモダリティ間の一致を示しており、すべての相関は統計的に有意でした(p < 0.05)。
Figure 2. Fig. 2 Lobar correlation of normalised mean PBV and V/Q-SPECT perfusion for all five lobes in 23 patients (115 lobar data points). There was a strong correlation (r = 0.72, 95% CI: 0.62–0.80) in whole-lung perfusion between PCCT and V/Q-SPECT, indicating good overall agreement between the two methods. At the lobar level, the LUL exhibited a moderately strong correlation (r = 0.62), notably lower than the LLL (r = 0.85). The reduced correlation in the LUL is likely due to contrast-related artefacts resulting from left-sided contrast administration during PCCT, which was observed in five of the 23 patients. In the right lung, the upper lobe (RUL) showed a strong correlation (r = 0.83), which exceeded those of the ML (r = 0.62) and the RLL (r = 0.69). The reduced correlations in ML and RLL may be due to spatial misalignment between PCCT and V/Q-SPECT. While V/Q-SPECT is acquired over several minutes during free breathing, the CT scan used for attenuation correction and lobar segmentation is acquired during a single mid-inspiratory breath hold. This temporal and respiratory phase mismatch can cause registration errors, particularly in regions like the ML and RLL, where adjacent lobe boundaries are more prone to displacement caused by breathing解説: 23人の対象者における正規化された平均PBVとV/Q-SPECT血流の肺葉ごとの相関を示しています。肺全体の血流において、PCCTとV/Q-SPECTの間には強い相関(r = 0.72)が見られました。肺葉レベルでは、左上葉(LUL)の相関は中程度に強い(r = 0.62)ものの、左下葉(LLL)の相関(r = 0.85)よりも低い結果でした。右肺では、右上葉(RUL)が強い相関(r = 0.83)を示し、中葉(ML)と右下葉(RLL)の相関(それぞれr = 0.62、r = 0.69)を上回りました。
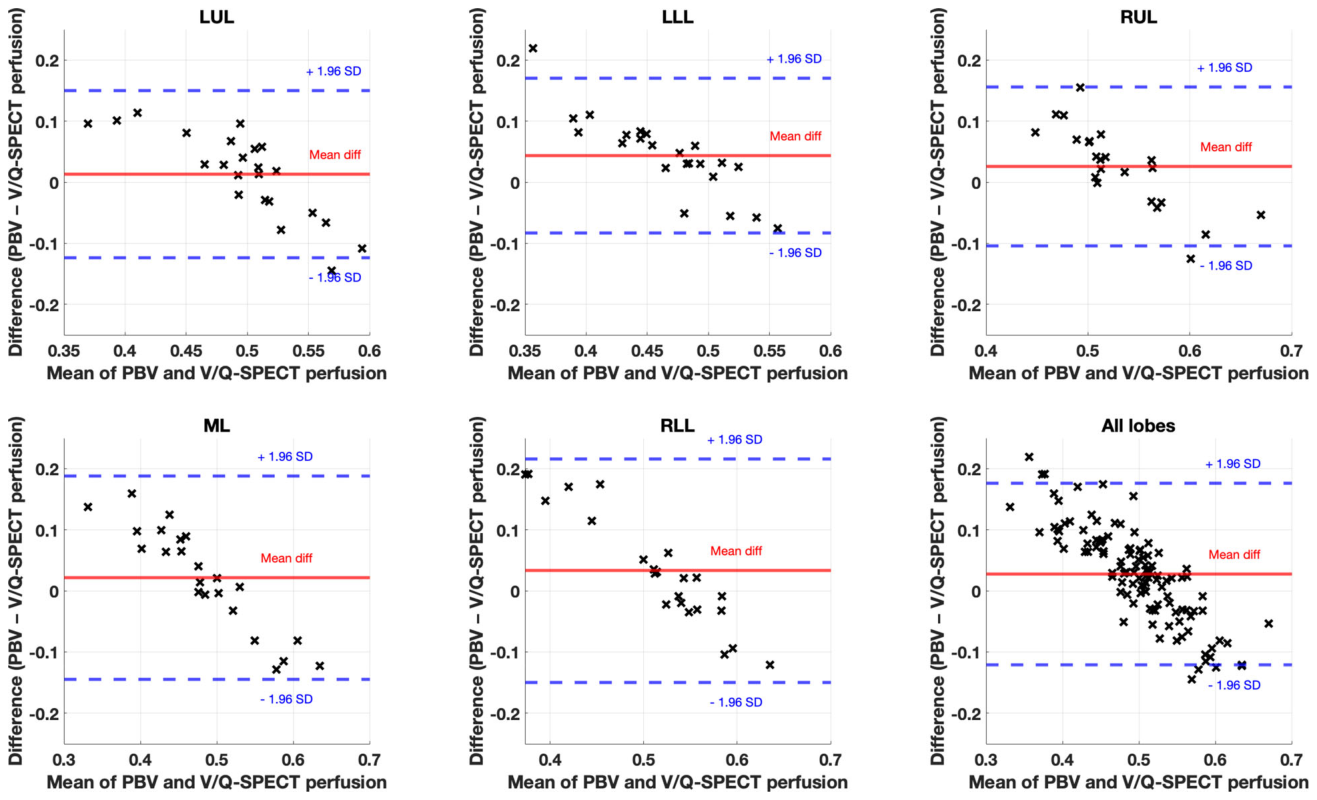
Figure 3. Fig. 3 Lobe-wise analysis of perfusion agreement between PCCT and V/Q-SPECT. Bland–Altman plots show the difference in normalised lobar mean perfusion (PCCT minus V/Q-SPECT) against the corresponding lobar averages for all five lobes in 23 patients. Lobe-wise Bland–Altman analysis. The analysis revealed a mean bias of + 0.015, with limits of agreement ranging from –0.13 to + 0.16, suggesting a small but systematic overestimation of perfusion by PCCT. A negative trend with greater agreement at higher perfusion values can be observed, indicating a potential systematic proportional bias (see also Fig. 5)解説: PCCTとV/Q-SPECT間の肺葉ごとの血流一致度を分析した図です。ブランド・アルトマンプロットは、23人の対象者における正規化された肺葉ごとの平均血流の差(PCCTとV/Q-SPECTの差)を、対応する肺葉の平均値に対してプロットしています。平均バイアスは+0.015であり、PCCTがわずかに血流を過大評価する傾向があることを示しています。血流値が高いほど一致度が高くなるという負の傾向が観察されました。
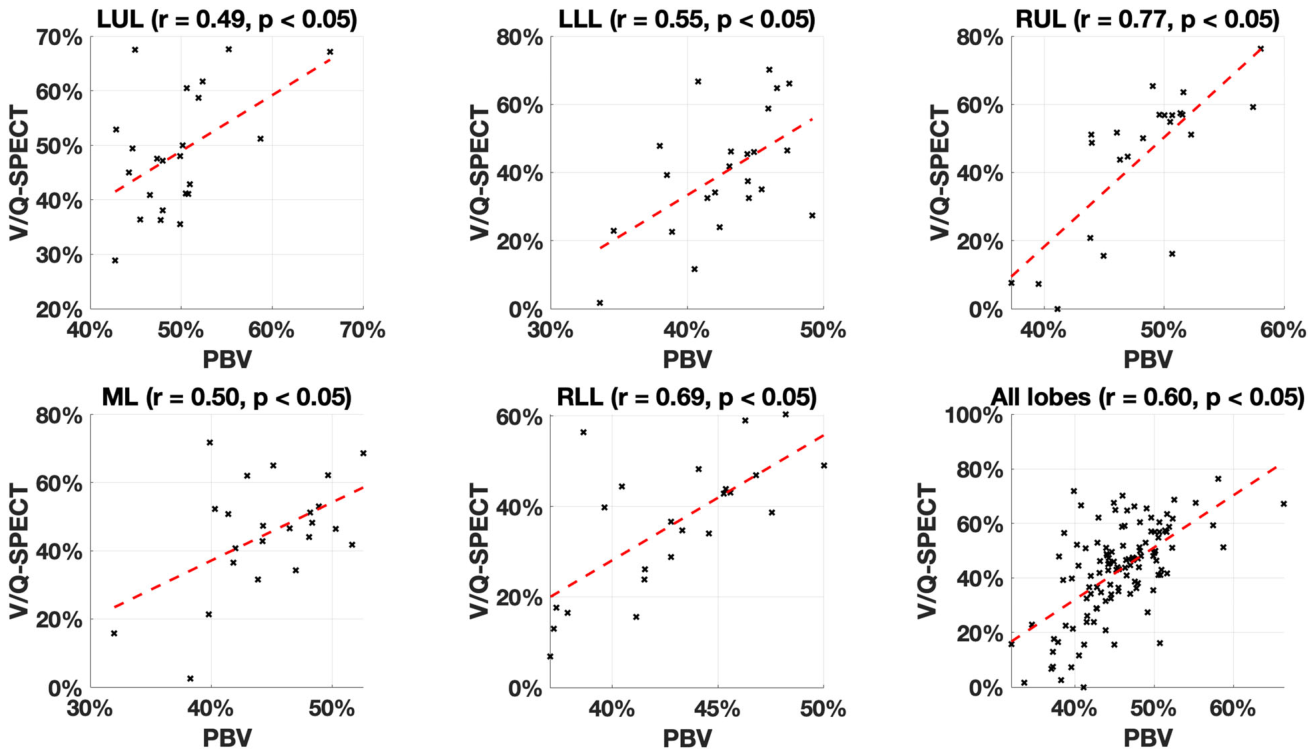
Figure 4. Fig. 4 Correlation of perfused lung volume (%) per lobe and whole-lung (Threshold = 0.5). Lobar and whole-lung correlation of perfused lung volume (in percentage) derived from z-score–normalised perfusion maps in 23 patients. Correlations are generally slightly lower compared to the mean Perfusion analysis, ranging from 0.49 to 0.77. Yet, correlation for the entire lung was moderately strong (r = 0.60, p < 0.05). The lobar correlations of perfused lung volume demonstrated a pattern consistent with the mean perfusion correlation: the LUL showed lower correlation compared to the LLL. Similarly, correlations in the ML and RLL were lower than those observed in the RUL (see explanation in Fig. 2)解説: 閾値0.5における肺葉および肺全体の灌流肺容積(%)の相関を示しています。正規化された血流マップから導き出された肺葉および肺全体の灌流肺容積の相関は、平均血流分析と比較してやや低いものの、肺全体では中程度の強さ(r = 0.60)を示しました。肺葉ごとの相関パターンは、左上葉(LUL)が左下葉(LLL)よりも低い相関を示し、中葉(ML)と右下葉(RLL)が右上葉(RUL)よりも低い相関を示しており、平均血流の相関と同様でした。
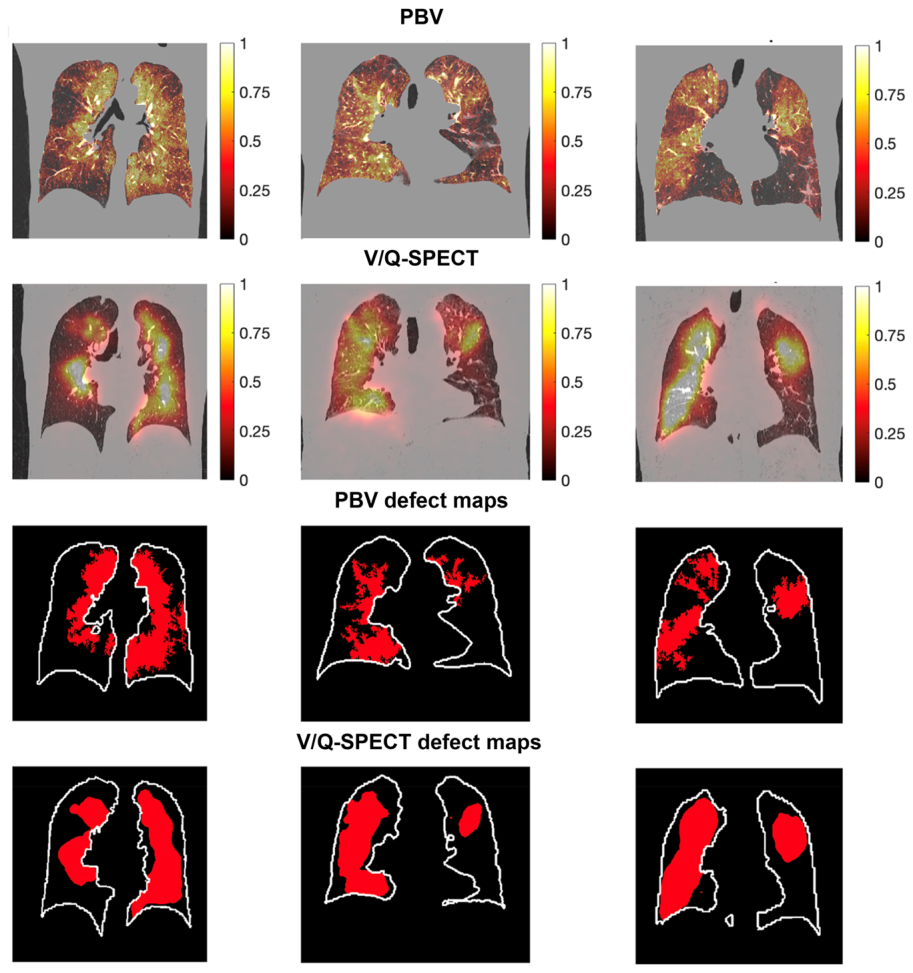
Figure 5. Fig. 5 Representative examples of matched perfusion defects in CTEPH visualised by PCCT and V/Q-SPECT. Representative examples of three patients with CTEPH demonstrating matched perfusion defects in PCCT and V/Q-SPECT. The top rows display 5 mm coronal reformats of PBV maps from PCCT. The second row shows the corresponding V/Q-SPECT perfusion images, affinely registered to PCCT for visual comparison. The bottom rows present binary perfusion defect maps derived from z-score normalised perfusion images of both modalities, using a threshold of 0.5 (red areas indicate V/Q- SPECT-perfusion and PBV, respectively > 0.5). Patient 1 exhibits wedge-shaped perfusion defects in V/Q-SPECT, which correspond well with defects in both the normalised PCCT images and their defect maps. Patients 2 and 3 show predominant perfusion defects in the LLLs. Compared to V/Q-SPECT, PBV defect maps reveal a more heterogeneous or “scattered” appearance of preserved perfusion, reflecting its higher spatial resolution.解説: CTEPH対象者におけるPCCTとV/Q-SPECTで可視化された、一致する血流欠損の代表的な例です。上段はPCCTのPBVマップの5mm冠状再構成画像、中段はV/Q-SPECT血流画像、下段は両モダリティの正規化された血流画像から閾値0.5を用いて導き出されたバイナリ血流欠損マップ(赤色の領域は欠損を示す)です。PCCTの血流欠損マップは、V/Q-SPECTと比較して、より不均一な、または「散らばった」ような灌流が維持されている様子を示しており、PCCTの高い空間分解能を反映しています。
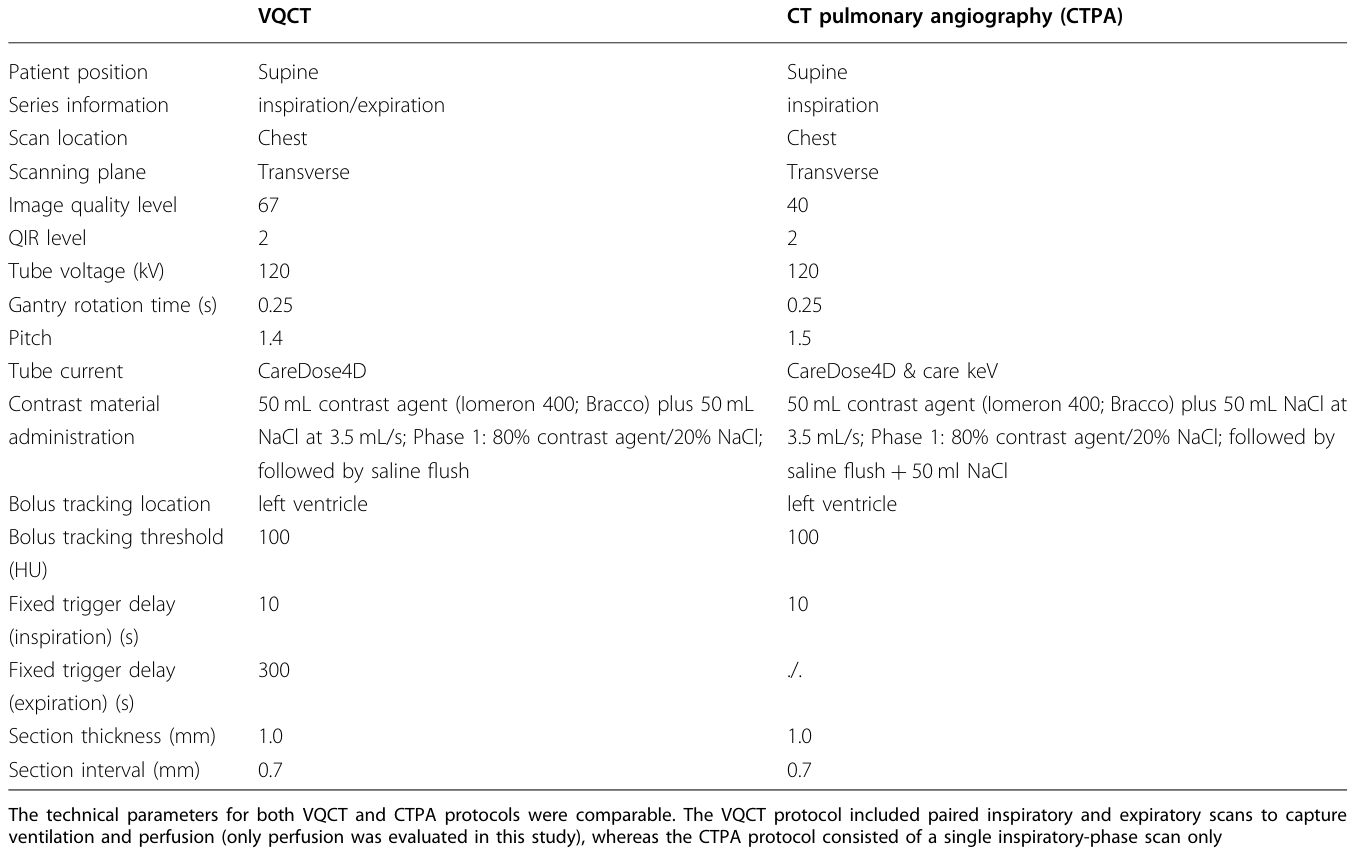
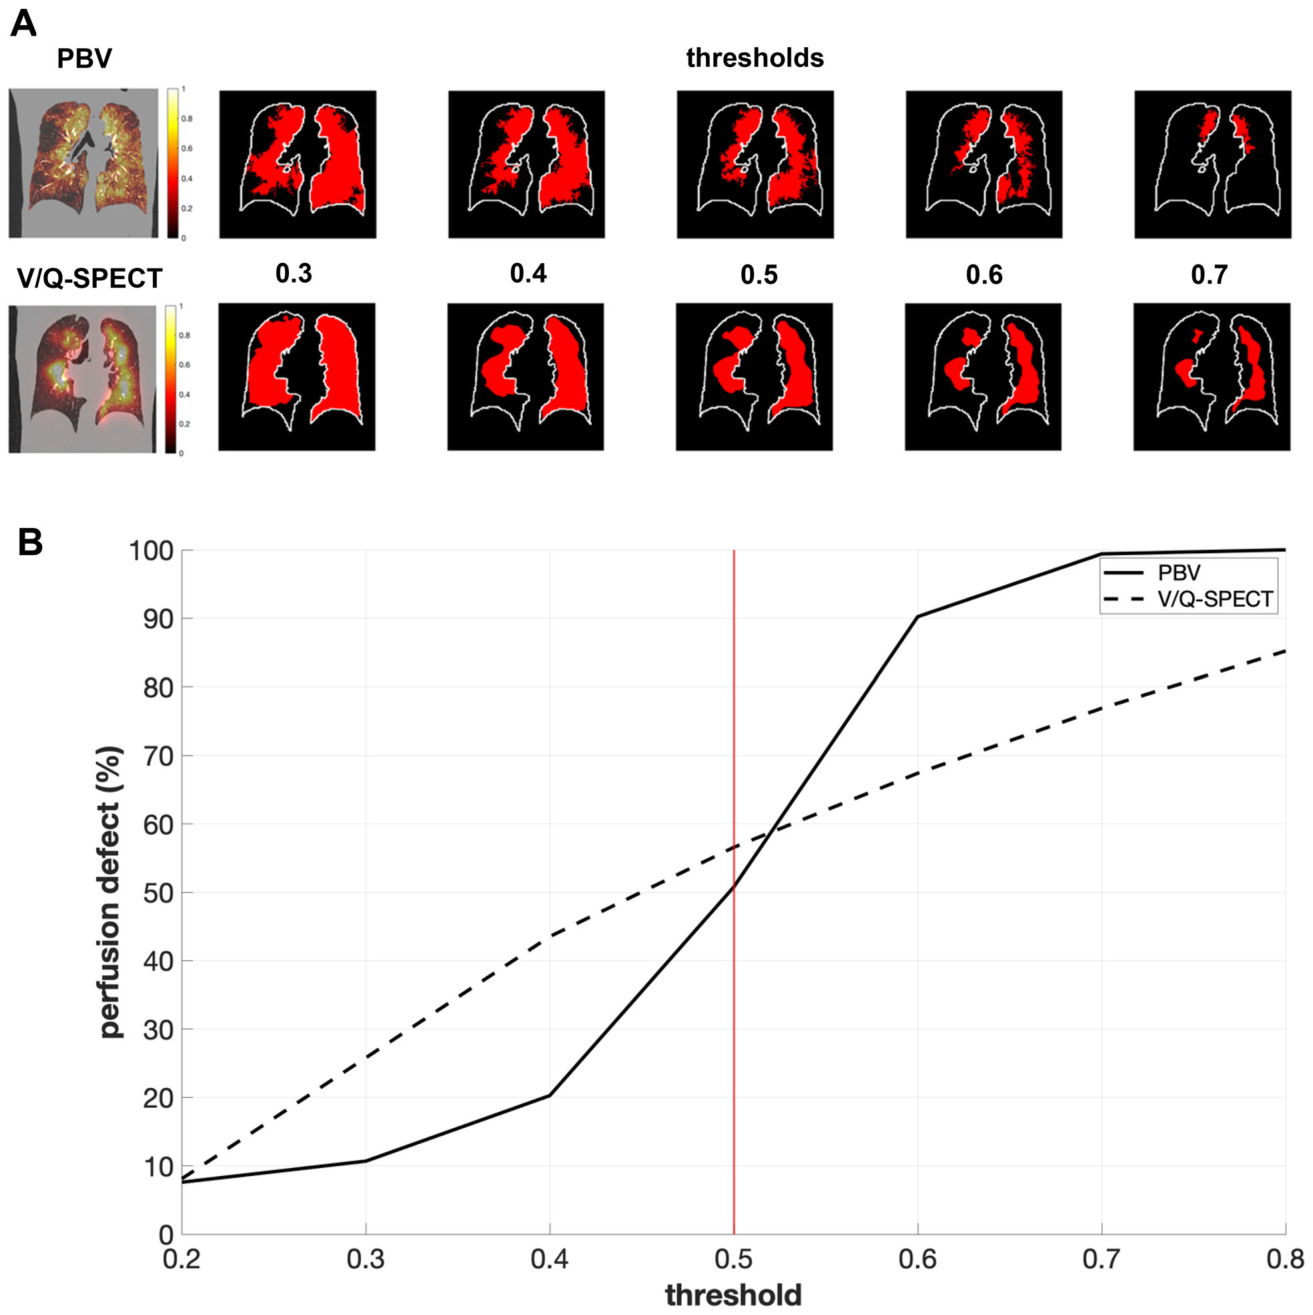
Table 1. Table 1 Overview of the two CT scan protocols used in this study解説: 本研究で用いられた2つのCTスキャンプロトコル(VQCTとCT肺血管造影(CTPA))の概要です。VQCTプロトコルは換気と血流を捕捉するために吸気と呼気のペアスキャンを含んでいましたが(本研究では血流のみ評価)、CTPAプロトコルは単一の吸気フェーズスキャンのみで構成されていました。両プロトコルの技術的パラメータは類似していました。Figure 6. Fig. 6 Influence of threshold on perfusion volume defects. A Effect of thresholding on perfusion defect maps derived from PCCT (top row) and V/Q- SPECT (bottom row) in a representative patient, using z-score–normalised perfusion maps scaled to the range [0, 1]. A threshold near 0.5 yields the highest visual concordance between the two modalities; both lower and higher thresholds introduce pronounced discrepancies. B The percentage of perfused volume is plotted against threshold values ranging from 0.2 to 0.8 for both PCCT and V/Q-SPECT across all 23 patients. The PCCT response exhibits a sigmoidal trend, while the V/Q-SPECT curve remains nearly linear. The curves intersect at a threshold of approximately 0.52. This indicates that PCCT underestimates hypoperfusion below this point and overestimates it above. The intersection suggests that a threshold of 0.52 provides the best alignment between PCCT and V/Q-SPECT perfusion assessments for the chosen normalisation scheme解説: 閾値が灌流容積欠損に与える影響を示しています。Aは、代表的な対象者におけるPCCT(上段)とV/Q-SPECT(下段)から導き出された血流欠損マップに対する閾値処理の効果を示しています。閾値が約0.5のときに両モダリティ間の視覚的な一致度が最も高くなります。Bは、23人の全対象者におけるPCCTとV/Q-SPECTの血流容積率を閾値0.2から0.8までプロットしたものです。PCCTはシグモイド曲線を描くのに対し、V/Q-SPECTはほぼ直線的なプロファイルを示します。両曲線は約0.52の閾値で交差しています。


コメントを残す