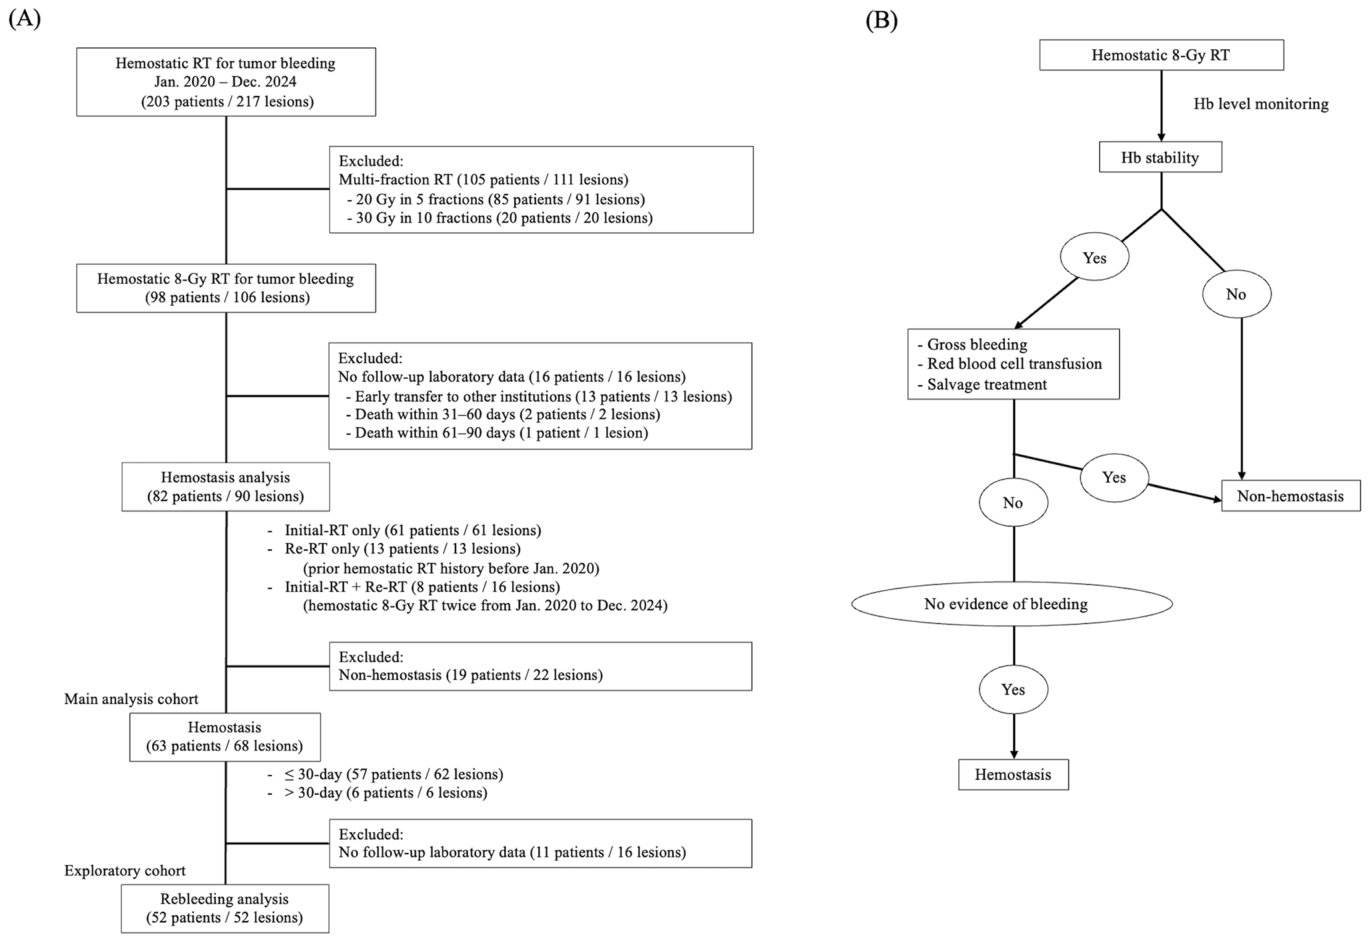
Figure 1. Fig. 1 Study flow diagram and criteria for hemostatic response. A Study flow diagram; B Criteria for hemostatic response. Hemoglobin (Hb) stability was defined as an Hb level of ≥ 8.0 g/dL and the absence of a decrease in Hb level of ≥ 1.0 g/dL for 7 consecutive days. RT, radiotherapy解説: 図1は、研究の対象者フローダイアグラムと止血反応の評価基準を示しています。(A)は腫瘍出血に対する単回8Gy放射線治療を受けた対象者の選定プロセス、除外基準、最終的な解析コホートの内訳を示しています。(B)は止血反応を「血色素(Hb)の安定性」「肉眼的出血の有無」「赤血球輸血の必要性の有無」「サルベージ治療の必要性の有無」に基づいて判断する基準をフローチャートで示しています。
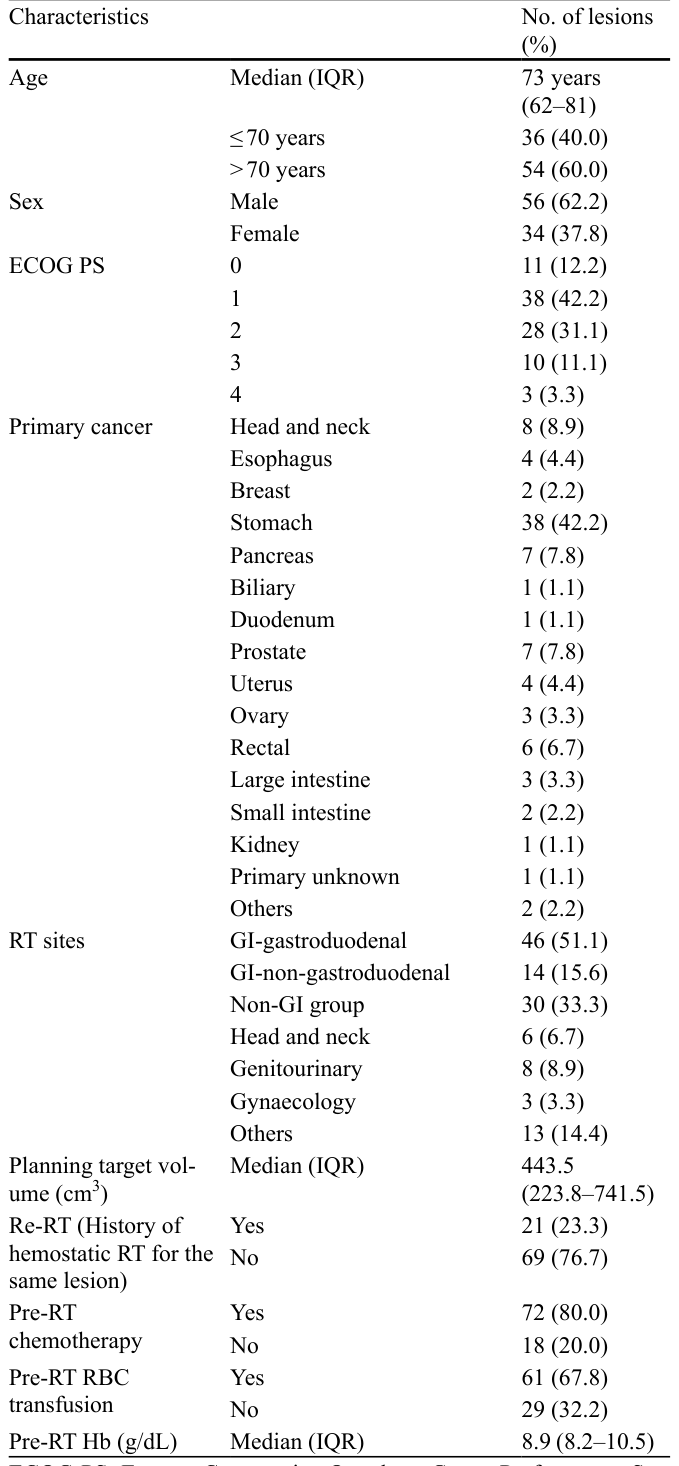
対象者の背景情報として、年齢、性別、ECOG-PS(Eastern Cooperative Oncology Group Performance Status、対象者の身体活動能力を評価する尺度)、原発がんの種類、放射線治療部位などが詳細に記録されています。
Table 1. Table 1 Characteristics at the start of RT (90 lesions) Characteristics No. of lesions (%) Age Median (IQR) 73 years (62–81) ≤ 70 years 36 (40.0) > 70 years 54 (60.0) Sex Male 56 (62.2) Female 34 (37.8) ECOG PS 0 11 (12.2) 1 38 (42.2) 2 28 (31.1) 3 10 (11.1) 4 3 (3.3) Primary cancer Head and neck 8 (8.9) Esophagus 4 (4.4) Breast 2 (2.2) Stomach 38 (42.2) Pancreas 7 (7.8) Biliary 1 (1.1) Duodenum 1 (1.1) Prostate 7 (7.8) Uterus 4 (4.4) Ovary 3 (3.3) Rectal 6 (6.7) Large intestine 3 (3.3) Small intestine 2 (2.2) Kidney 1 (1.1) Primary unknown 1 (1.1) Others 2 (2.2) RT sites GI-gastroduodenal 46 (51.1) GI-non-gastroduodenal 14 (15.6) Non-GI group 30 (33.3) Head and neck 6 (6.7) Genitourinary 8 (8.9) Gynaecology 3 (3.3) Others 13 (14.4) Planning target vol ume (cm3)解説: 表1は、放射線治療開始時点の対象者(90病変)の特性をまとめたものです。年齢、性別、ECOG-PS、原発がんの種類、放射線治療部位、再治療の有無、治療前の化学療法や赤血球輸血の有無、治療前の血色素(Hb)レベルなど、様々な臨床因子が示されています。
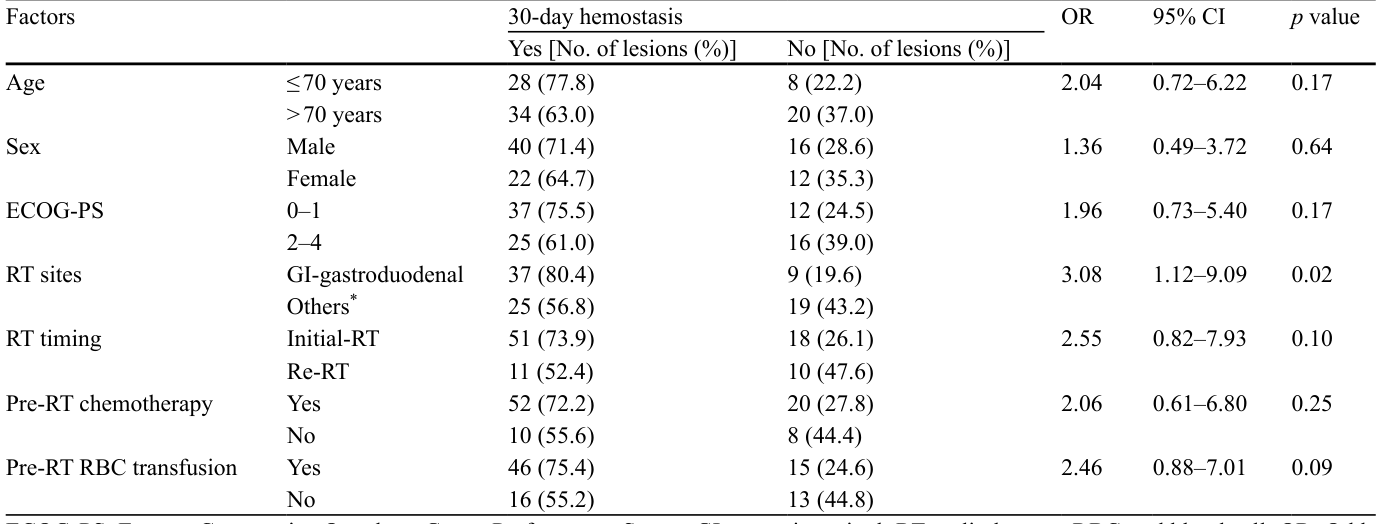
本研究の主な結果として、全体的な30日止血奏効率は68.9%でした。探索的解析では、胃十二指腸(GI-gastroduodenal)出血、すなわち胃や十二指腸からの出血が、胃十二指腸以外の消化管(GI-non-gastroduodenal)出血や非消化管(non-GI)出血の部位と比較して、有意に高い30日止血奏効率(80.4% vs 56.8%)を示しました。
Table 2. Table 2 Factors affecting the 30-day hemostatic response (90 lesions) Factors 30-day hemostasis OR 95% CI p value Yes [No. of lesions (%)] No [No. of lesions (%)] Age ≤ 70 years 28 (77.8) 8 (22.2) 2.04 0.72–6.22 0.17 > 70 years 34 (63.0) 20 (37.0) Sex Male 40 (71.4) 16 (28.6) 1.36 0.49–3.72 0.64 Female 22 (64.7) 12 (35.3) ECOG-PS 0–1 37 (75.5) 12 (24.5) 1.96 0.73–5.40 0.17 2–4 25 (61.0) 16 (39.0) RT sites GI-gastroduodenal 37 (80.4) 9 (19.6) 3.08 1.12–9.09 0.02 Others* 25 (56.8) 19 (43.2) RT timing Initial-RT 51 (73.9) 18 (26.1) 2.55 0.82–7.93 0.10 Re-RT 11 (52.4) 10 (47.6) Pre-RT chemotherapy Yes 52 (72.2) 20 (27.8) 2.06 0.61–6.80 0.25 No 10 (55.6) 8 (44.4) Pre-RT RBC transfusion Yes 46 (75.4) 15 (24.6) 2.46 0.88–7.01 0.09 No 16 (55.2) 13 (44.8) ECOG-PS, Eastern Cooperative Oncology Group Performance Status; GI, gastrointestinal; RT, radiotherapy; RBC, red blood cell; OR, Odds Ratio; 95% CI, 95% confidence interval解説: 表2は、30日止血反応に影響を与える因子(90病変)の関連性を示しています。年齢、性別、ECOG-PS、放射線治療部位、放射線治療のタイミング、治療前の化学療法、治療前の赤血球輸血の有無といった因子と、30日止血が達成された病変の割合、オッズ比、95%信頼区間、p値が示されています。
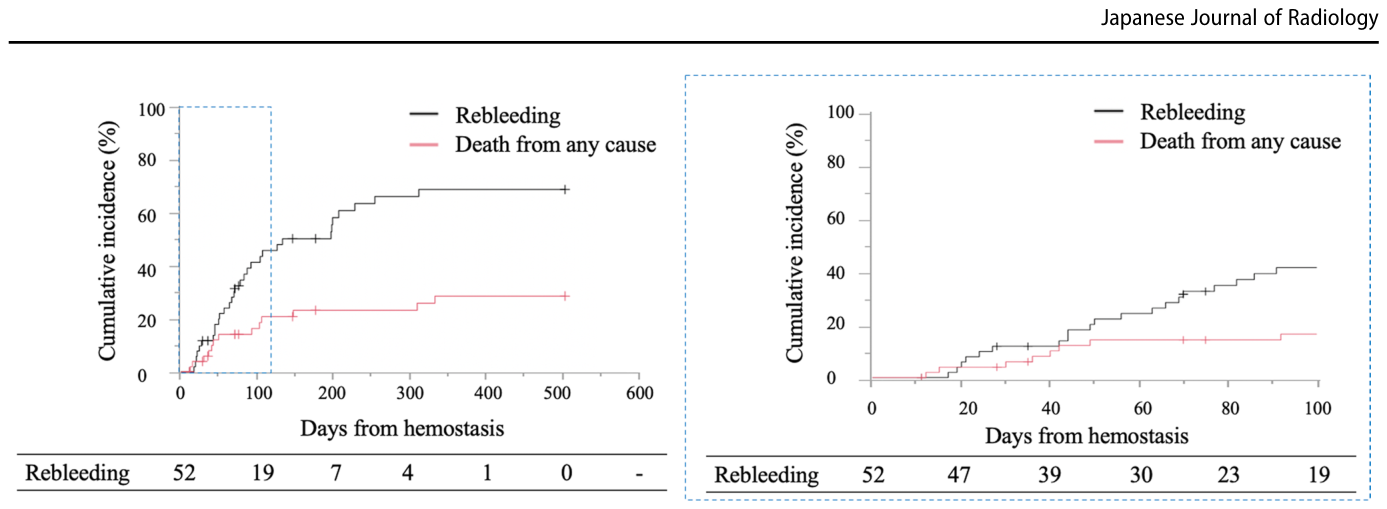
Figure 3. Fig. 3 Rebleeding from hemostasis in evaluable patients. A total of 52 patients/52 lesions were included. In the competing risk analysis, rebleeding was defined as the event of interest, whereas death from any cause was treated as a competing event. Patients who neither died nor解説: 図3は、止血を達成した評価可能な対象者における再出血の累積発生率を示しています。再出血までの期間を日数で示しており、再出血のイベントに加え、あらゆる原因による死亡が競合イベントとして考慮されています。グラフは、全体的なフォローアップ期間(左パネル)と拡大した初期期間(右パネル)での再出血率の変化を示しています。
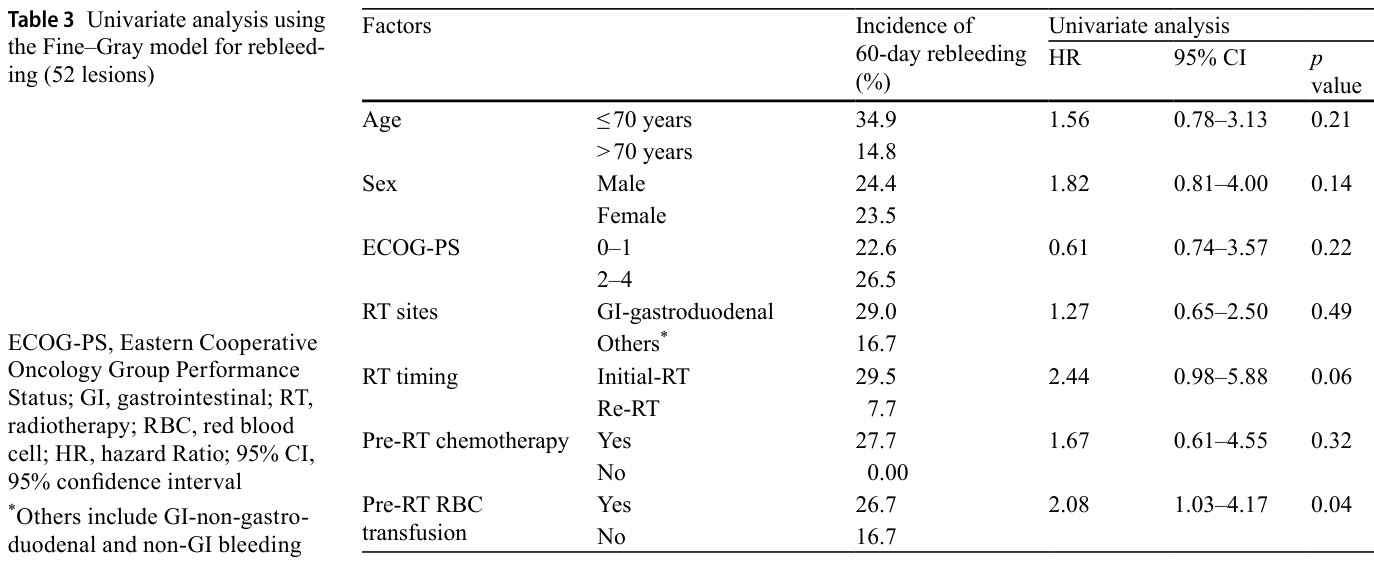
Table 3. Table 3 Univariate analysis using the Fine–Gray model for rebleed ing (52 lesions)解説: 表3は、再出血(52病変)に関するFine-Grayモデルを用いた単変量解析の結果を示しています。60日再出血の発生率、ハザード比、95%信頼区間、p値が、年齢、性別、ECOG-PS、放射線治療部位、放射線治療のタイミング、治療前の化学療法、治療前の赤血球輸血の有無といった因子ごとに示されています。

コメントを残す